


ExxonMobil Holdings Corporation XOM and BP plc BP are two integrated energy giants with promising business prospects, supported by the prevailing strength in crude oil prices. Investors’ strong preferences for both stocks are reflected in the price chart. Over the past year, XOM has jumped 53.6%, outperforming BP’s 42.5% surge.
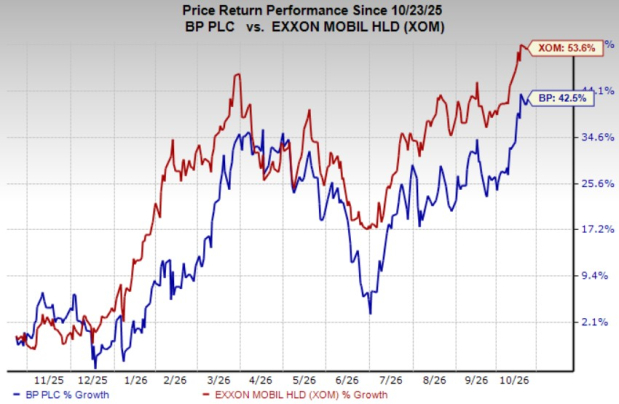
However, the stock price performance does not necessarily establish XOM's superiority over BP as an integrated energy company. Before arriving at an investment conclusion, let's examine the broader upstream business environment, which plays a crucial role in determining the cash flow potential of both energy giants.
Strong Oil Prices: A Tailwind for XOM & BP's Upstream Operations?
West Texas Intermediate (“WTI”) crude is again approaching the $100-per-barrel mark, per Oilprice.com. The high prices are being driven by intensifying conflicts in the Middle East. The U.S. Energy Information Administration, in its latest short-term energy outlook, projected WTI at $88.21 per barrel this year, higher than $65.40 last year. A highly favorable oil pricing environment is likely to continue supporting ExxonMobil’s exploration and production activities, as is likely for BP, a British energy giant.
Importantly, upstream operations generate the majority of earnings for XOM. The company has a massive footprint in the Permian, the most prolific oil and gas play in the United States, and offshore Guyana. In the Permian, the integrated giant has been employing new drilling techniques and artificial intelligence to boost and optimize production volumes at lower cost structures.
In Guyana, XOM has made several oil and gas discoveries, further highlighting its solid production outlook. Robust production from both assets has been aiding its top and bottom lines. Breakeven costs are low in both resources.
Turning to BP, the British energy major’s production outlook looks bright, as its major projects, expected to begin operations between 2028 and 2030, are moving forward as planned. Once operational, these projects could help BP increase production and generate more cash.
XOM vs. BP: Which Energy Giant Has a Stronger Balance Sheet?
Although high oil prices are acting as a tailwind for the businesses of XOM and BP, it is also necessary to analyze the companies’ financial strength to judge how well the two energy majors could weather an unfavorable commodity pricing environment.
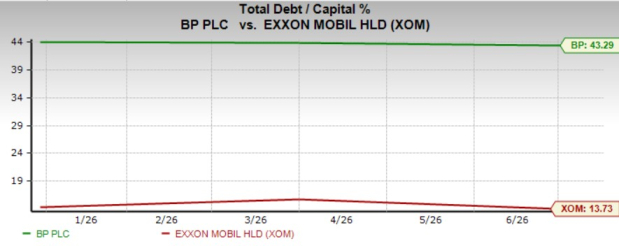
The debt-to-capitalization of XOM is 13.73%, much lower than BP’s 43.29%. Thus, with significantly lower exposure to debt capital, ExxonMobil Holdings can sail through a tough business environment. BP, although having a relatively higher debt exposure, is also financially sound, as its debt-to-capitalization ratio is not very high.
BP or XOM: Which is a Better Stock?
Coming to the valuation, BP stock is currently relatively cheap, as the integrated energy company is trading at a trailing 12-month EV/EBITDA multiple of 3.17x, which is lower than XOM’s 9.91x. In other words, investors are willing to pay a premium price for XOM over BP.
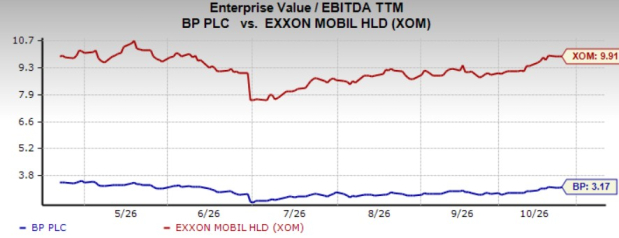
The premium valuations reflect XOM’s strong business fundamentals, sound balance sheet and long-term growth prospects. Nevertheless, BP also presents a compelling investment case, given its relatively attractive valuation and the prevailing strength in crude oil prices, which should support its upstream profitability.
Currently, both stocks are highly investment-worthy and sport a Zacks Rank #1 (Strong Buy). You can see the complete list of today’s Zacks #1 Rank stocks here.
7 Best Stocks for the Next 30 Days
Just released: Experts distill 7 elite stocks from the current list of 220 Zacks Rank #1 Strong Buys. They deem these tickers "Most Likely for Early Price Pops."
Since 1988, the full list has beaten the market more than 2X over with an average gain of +23.9% per year. So be sure to give these hand picked 7 your immediate attention.
See them now >>Want the latest recommendations from Zacks Investment Research? Today, you can download 7 Best Stocks for the Next 30 Days. Click to get this free report
BP p.l.c. (BP): Free Stock Analysis Report
ExxonMobil Holdings Corporation (XOM): Free Stock Analysis Report
This article originally published on Zacks Investment Research (zacks.com).