HamadJatoi

Hamad Jatoi

Pakistán

Gráficos e ideas

XAUUSD TRADE IDEA XAUUSD Long Gold vs US Dollar
XAUUSD TRADE IDEA
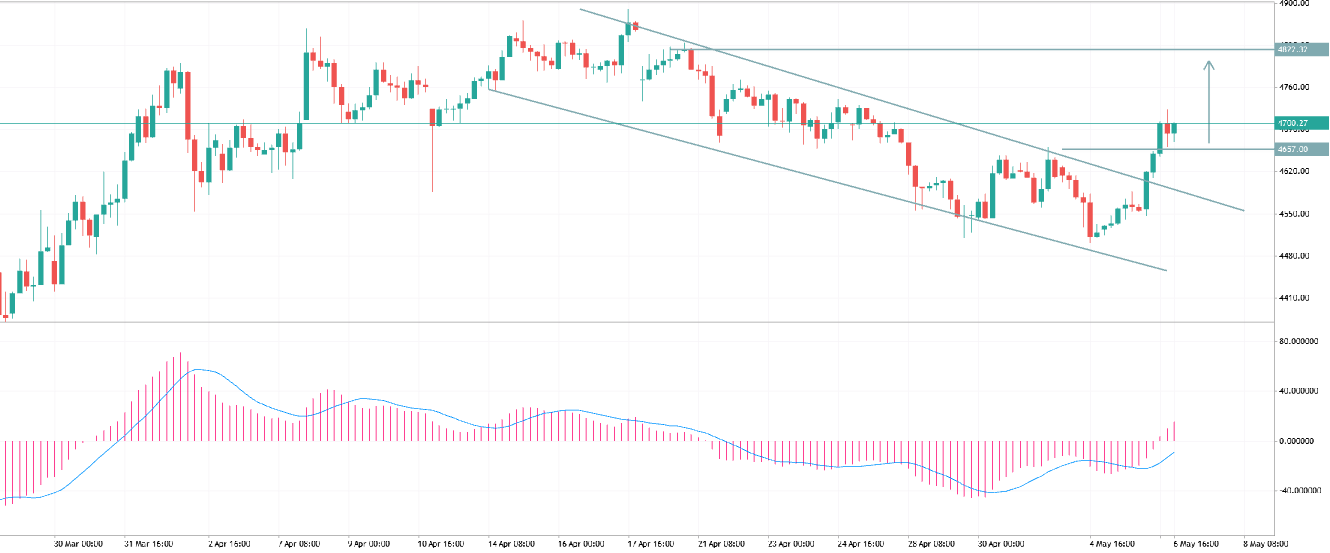
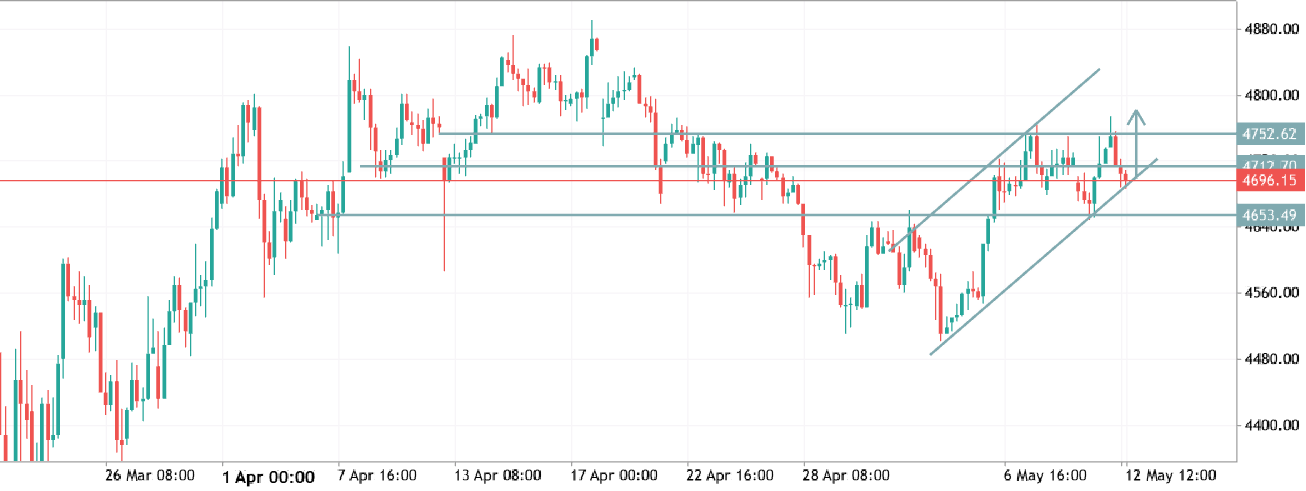
The market remains in a short-term bullish structure after forming higher lows inside the ascending channel. Price recently rejected the 4653 support zone and pushed back toward the key resistance area around 4752. However, momentum is weakening near resistance, and the latest rejection candle suggests buyers are struggling to maintain control above 4700. A confirmed break below the channel support and 4653 could trigger a deeper correction toward 4600–4560. On the bullish side, holding above 4653 keeps the upward structure valid, with a potential retest of 4752 and possibly 4800 if resistance breaks decisively. Current bias: cautiously bullish above 4653, bearish below channel support.
2026.05.12 12:35 0
GBPUSD TRADE IDEA GBPUSD Long Pound Sterling vs US Dollar
GBPUSD TRADE IDEA
GBP/USD is maintaining a bullish structure on the H4 timeframe, trading within a well-defined ascending channel after a strong rebound from the 1.3460 support zone. Price action continues to form higher lows, indicating sustained buying momentum despite short-term consolidation near resistance. The pair is currently testing the 1.3610–1.3630 resistance area. A confirmed breakout above this zone could trigger further upside toward 1.3650 and potentially 1.3680. Momentum remains constructive as long as price stays above the ascending trendline support. Immediate support is located at 1.3585, followed by 1.3550. A pullback into these areas may attract fresh buyers and preserve the bullish continuation setup. However, a breakdown below the channel structure would weaken the bullish outlook and
2026.05.11 11:28 1
XAUUSD XAUUSD Long Gold vs US Dollar
XAUUSD
Price action shows a strong bullish recovery after breaking out of the descending channel, confirming short-term momentum has shifted in favor of buyers. The market respected the 4647–4677 support zone multiple times, indicating solid demand at lower levels. Currently, price is consolidating near the 4698 resistance area. A successful hold above 4677 keeps the bullish structure intact and increases the probability of another push toward 4720 and potentially 4818 resistance. However, failure to maintain above 4677 could trigger a short-term pullback toward 4647 support before buyers attempt continuation. Overall sentiment remains cautiously bullish while price trades above the highlighted support region.
2026.05.11 07:13 0
EURUSD EURUSD Long Euro vs US Dollar
EURUSD
EUR/USD is trading inside an ascending channel on the H4 timeframe, showing a bullish structure with higher highs and higher lows. Price recently bounced from the lower trendline near 1.1720 support and is now moving toward the 1.1775 resistance area. If buyers maintain momentum above 1.1775, the next upside targets are 1.1800 and 1.1835. A breakout above 1.1835 could confirm stronger bullish continuation. On the downside, failure to hold above 1.1720 may push the pair back toward 1.1590 support. Overall trend remains bullish while price stays inside the rising channel.
2026.05.08 13:08 0
BTCUSD BTCUSD Long Bitcoin vs US Dollar
BTCUSD
Short Chart Analysis (BTC/USDT 4H): Trend: Bullish — price is moving inside a clear ascending channel (higher highs & higher lows). Current Behavior: Rejection from resistance around 82,200 , showing short-term selling pressure. Key Support: ~ 79,500 (channel support). Key Resistance: 82,200 → 83,500 zone. Scenarios: Bullish: If price holds above 81,000 and breaks 82,200 , next targets → 83,500 – 84,000 . Bearish: If price drops below 79,500 , it may fall toward 78,000 – 77,000 . Conclusion: Trend is still bullish, but current pullback suggests possible retest of support before next move.
2026.05.06 19:58 0
xauusd analysis XAUUSD Long Gold vs US Dollar
xauusd analysis
Market Structure Price was moving inside a descending channel (downtrend). Recently, it has broken above the channel , signaling a potential trend reversal or at least a strong pullback. Momentum (MACD) MACD shows a bullish crossover with histogram turning positive. Momentum is shifting upward , supporting the breakout. Key Levels Resistance: 4675–4680 → currently being tested Next target: around 4875–4880 Support (flip zone): 4655–4670 Strong support: 4540 Price Behavior Strong bullish candles pushed price above resistance. Price is now holding above breakout zone , which is a bullish sign. A retest of 4655–4670 would be healthy for continuation. Bias Short-term: Bullish Trading Idea Buy on dips near 4655–4675 Target: 4720 → 4875 Stop loss: below 4540 Invalidation If price falls below
2026.05.06 13:59 1
gold analysis for next week XAUUSD Long Gold vs US Dollar
gold analysis for next week
Market structure: Clear downtrend (series of lower highs + descending trendline still respected). Current pattern: Price is compressing into a symmetrical triangle right at ~4610 support/resistance flip zone. Key levels: Support: ~4590–4600 Resistance: ~4635–4650 (triangle top + trendline) Major target zone above: ~4725 Scenarios: Bullish: Break + hold above triangle & trendline → momentum push toward ~4700–4730 Bearish: Rejection here → continuation of overall downtrend → retest 4550 → possibly lower Bias: Neutral → waiting for breakout confirmation (trend is bearish, but structure is coiling). Smart takeaway: No edge inside the triangle — trade the breakout, not the guess.
2026.05.03 08:36 0