GOLD BREAKOUT: Massive Head & Shoulders Drop Incoming! XAUUSD Short Gold vs US Dollar

GOLD BREAKOUT: Massive Head & Shoulders Drop Incoming!

📉 SELL SIGNAL / SHORT TRADE SETUP 📉 Instrument: XAUUSD (Gold) Timeframe: M15 (Intraday) Pattern: Head & Shoulders (Bearish Reversal) 🎯 Trade Execution Parameters Entry Zone: 4250.00 – 4258.00 (Entry on Retest / Neckline Breakout) Stop Loss (SL): 4272.00 (Positioned above the Right Shoulder for protection) Take Profit 1 (TP1): 4200.00 (Intermediate psychological & liquidity level) Take Profit 2 (TP2): 4160.00 (Major Support Zone marked on chart) Risk/Reward Ratio (RRR): ~1:4.5 (High R/R Setup) 🔍 Technical Reasons & Setup Analysis Head & Shoulders Structural Formation: Left Shoulder: Rejection near the 4258.00 zone. Head: Peak push up to the 4295.00 level before sharp selling pressure. Right Shoulder: Lower high printed around 4258.00, confirming buyers are losing
XAUUSD TRADEIDEA XAUUSD Short Gold vs US Dollar

XAUUSD TRADEIDEA

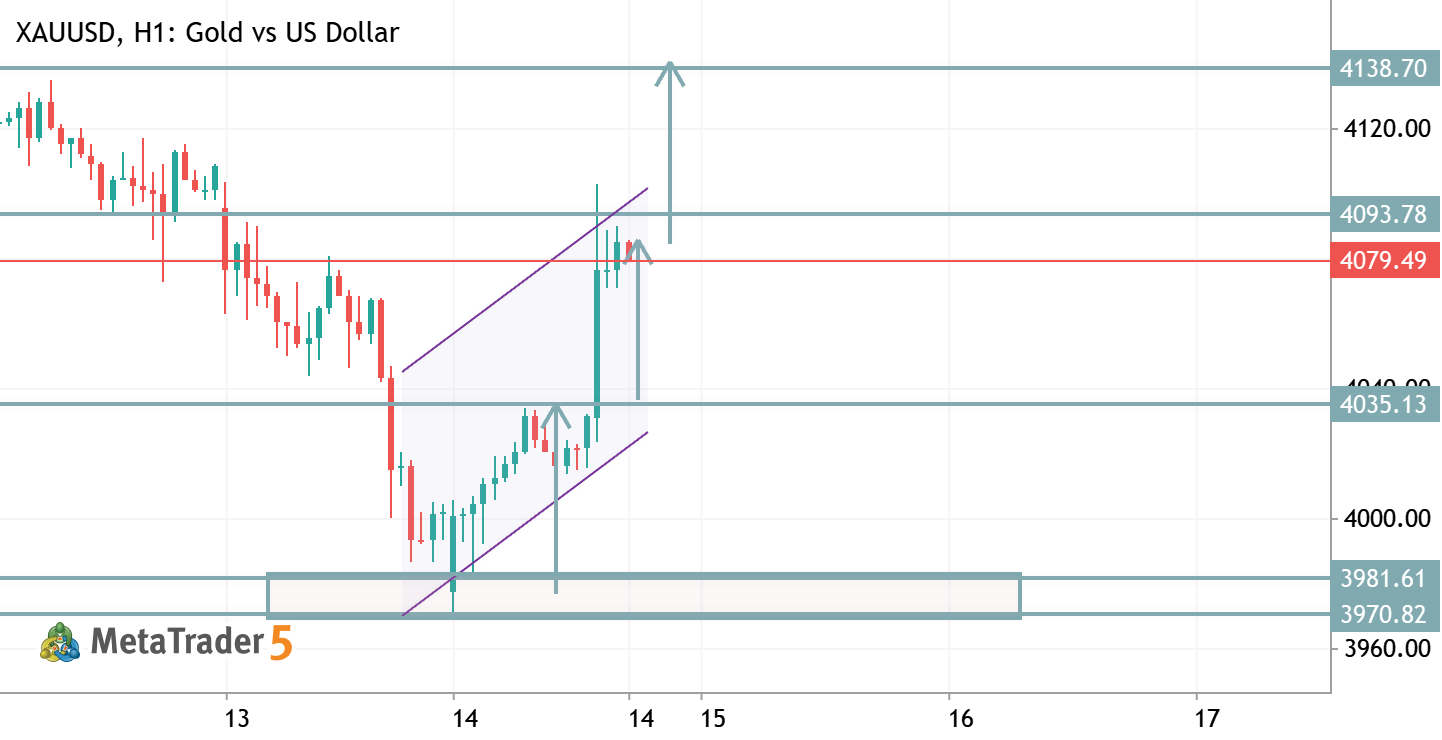
XAUUSD Bias: Bearish Price remains below the descending trendline, indicating sellers are still in control. Resistance: 4075–4080 (key rejection zone). Current Support: Around 4045 . A decisive break below this level increases bearish momentum. Next Target (TP): 3963 (major support shown on the chart). Invalidation / SL: Above 4080–4090 or after a strong H4 candle closes above the trendline. Trade Idea: Favor short positions on rallies or after a confirmed break below 4045 , targeting 3963 while maintaining disciplined risk management.
XAUUSD (Gold) Macro Breakdown Analysis: Potential Bearish Wave to 3650 Order Block XAUUSD Short Gold vs US Dollar

XAUUSD (Gold) Macro Breakdown Analysis: Potential Bearish Wave to 3650 Order Block

Trade Breakdown / Signal: SELL STOP (Breakout Play) Asset: XAUUSD (Gold - D1 Daily Chart) Trigger / Entry Zone: Breakdown below 3950.00 – 3965.00 Stop Loss (SL): 4050.00 (Above the recent daily lower-high resistance trendline) Take Profit 1 (TP1): 3883.00 (Minor daily support & sell-side liquidity pool) Take Profit 2 (TP2 / Main Target): 3650.00 (Major bullish order block / structural demand zone) Key Technical Reasons Crucial Daily Support Test: Price is pressing against a critical horizontal support zone near 3950–3965. A clean daily closure below this level confirms a macro structure continuation to the downside. TP1 Liquidity Sweep: The first target near 3883.00 sits right at a minor support level where rest stop losses and sell-side liquidity reside, making it a high-probability
XAGUSD (Silver) Bearish Rejection Setup: Trendline & Resistance Confluence XAGUSD Short Silver vs US Dollar

XAGUSD (Silver) Bearish Rejection Setup: Trendline & Resistance Confluence

Trade Signal: SHORT (SELL) Asset: XAGUSD (Silver - H1) Entry Zone: 58.600 – 58.700 Stop Loss (SL): 59.100 (Above the descending trendline & recent high) Take Profit 1 (TP1): 56.800 (Lower trendline / local support area) Take Profit 2 (TP2): 55.300 (Major Support Zone) Key Technical Reasons Bearish Trendline Resistance: Price is forming lower highs, respecting a prominent descending trendline that continues to limit upside momentum. Horizontal Supply Zone: The 58.600–58.700 area has consistently acted as strong horizontal resistance, triggering repeated price drops whenever retested. High-Probability Confluence: The overlapping descending trendline and horizontal supply level create a strong rejection zone for high-reward short opportunities. Targeting Liquidity: The setup targets the
GBPCAD ANALYSIS TO SHORT GBPCAD Short Pound Sterling vs Canadian Dollar

GBPCAD ANALYSIS TO SHORT

🔴 GBP/CAD Sell Signal Entry Zone: 1.8890 – 1.8904 Stop Loss: 1.8940 Take Profit 1: 1.8860 Take Profit 2: 1.8807 📉 GBP/CAD is approaching a key resistance zone, presenting a potential selling opportunity. The first target is set at 1.8860, with an extended target of 1.8807. If bearish momentum continues to strengthen, the pair could extend its decline beyond the second target. Consider securing partial profits at TP1 and allowing the remaining position to run toward TP2 while adjusting your stop loss according to your risk management plan. Risk Disclaimer: Forex trading involves substantial risk. Always use proper risk management and never risk more than you can afford to lose.
GBPNZD Analysis idea GBPNZD Short Pound Sterling vs New Zealand Dollar

GBPNZD Analysis idea

🔴 GBP/NZD Sell Signal Entry Zone: 2.2932 – 2.2945 Stop Loss: 2.2991 Take Profit 1: 2.2890 Take Profit 2: 2.2844 📉 GBP/NZD is approaching a key resistance zone, presenting a potential selling opportunity. The first target is set at 2.2890, with an extended target of 2.2844. If bearish momentum continues to build, the pair could extend its decline beyond the second target. Consider securing partial profits at TP1 and allowing the remaining position to run toward TP2 while adjusting your stop loss according to your risk management plan. Risk Disclaimer: Forex trading involves substantial risk. Always use proper risk management and never risk more than you can afford to lose.
BTCUSD H4 ANALYSIS BTCUSD Bitcoin vs US Dollar

BTCUSD H4 ANALYSIS

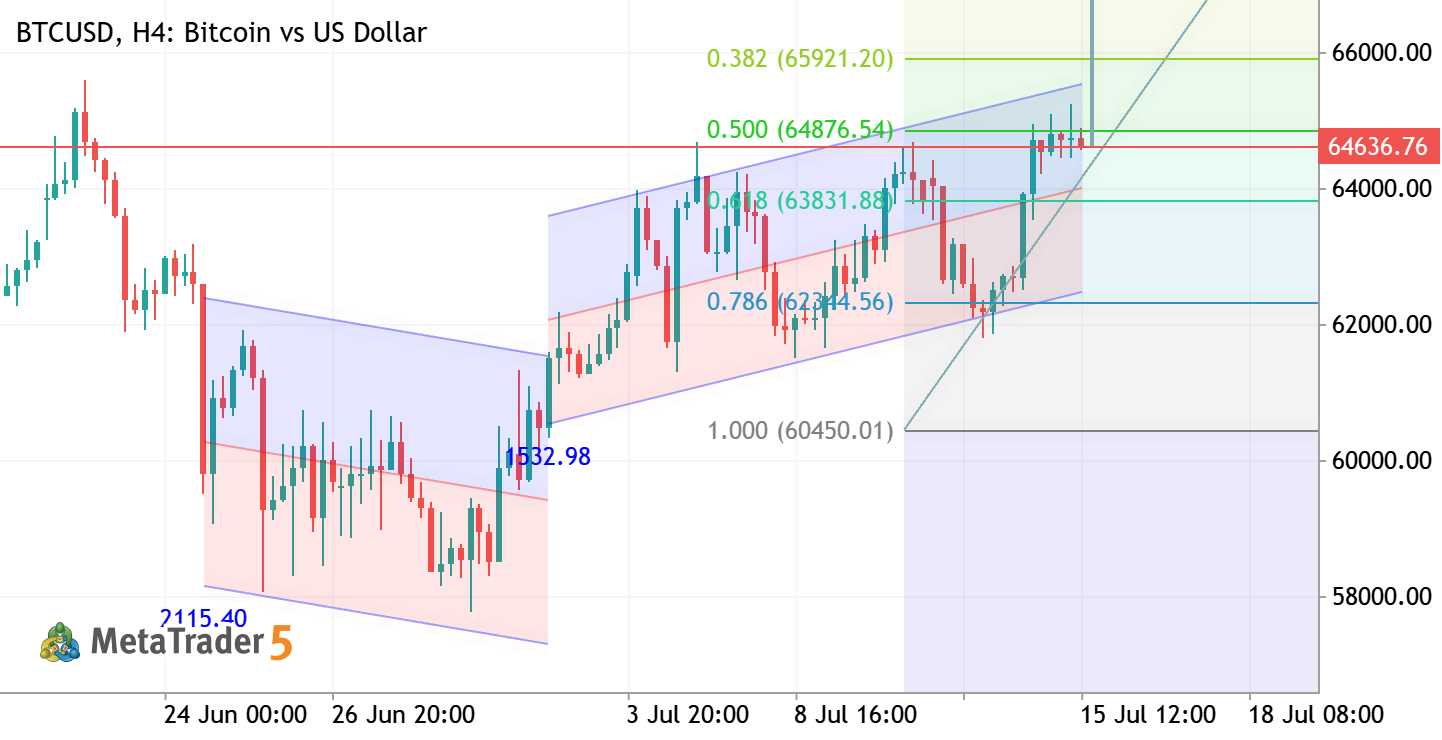
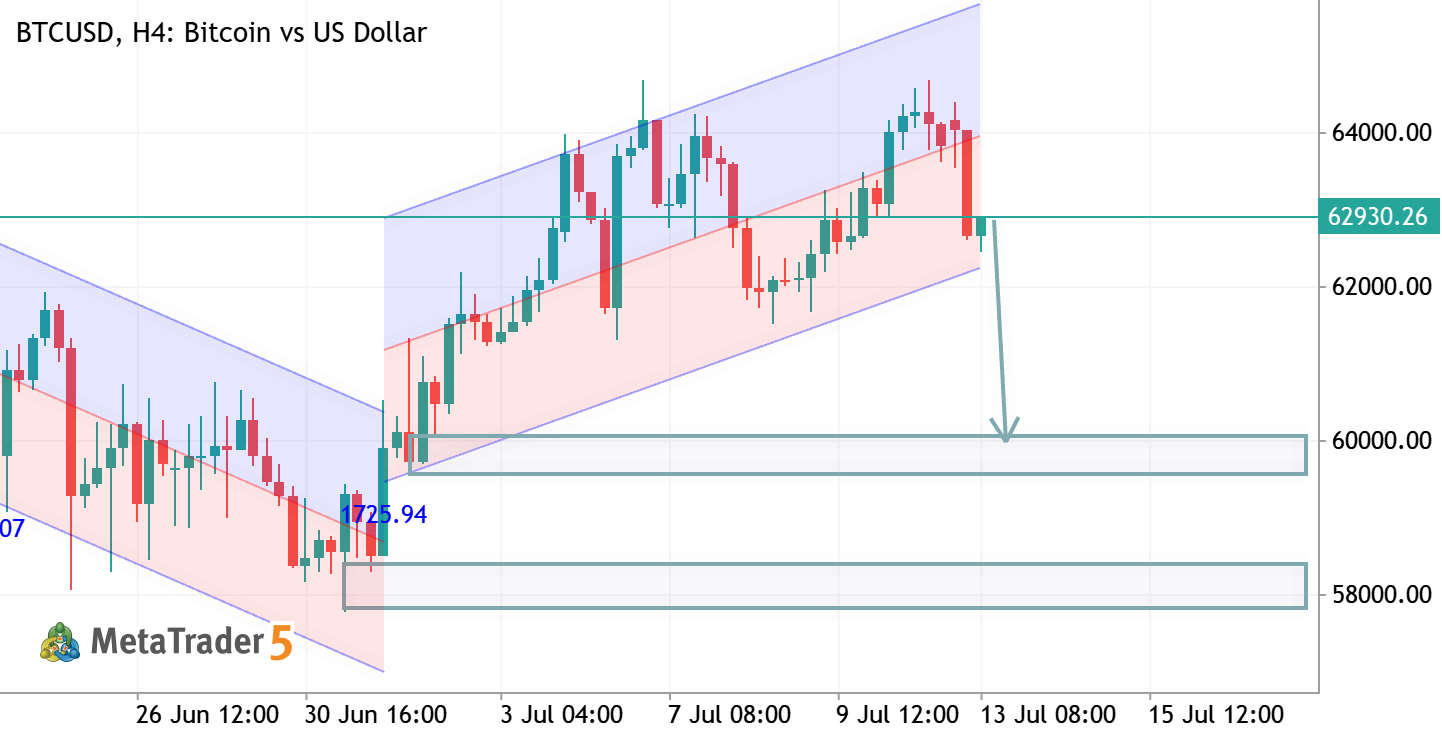
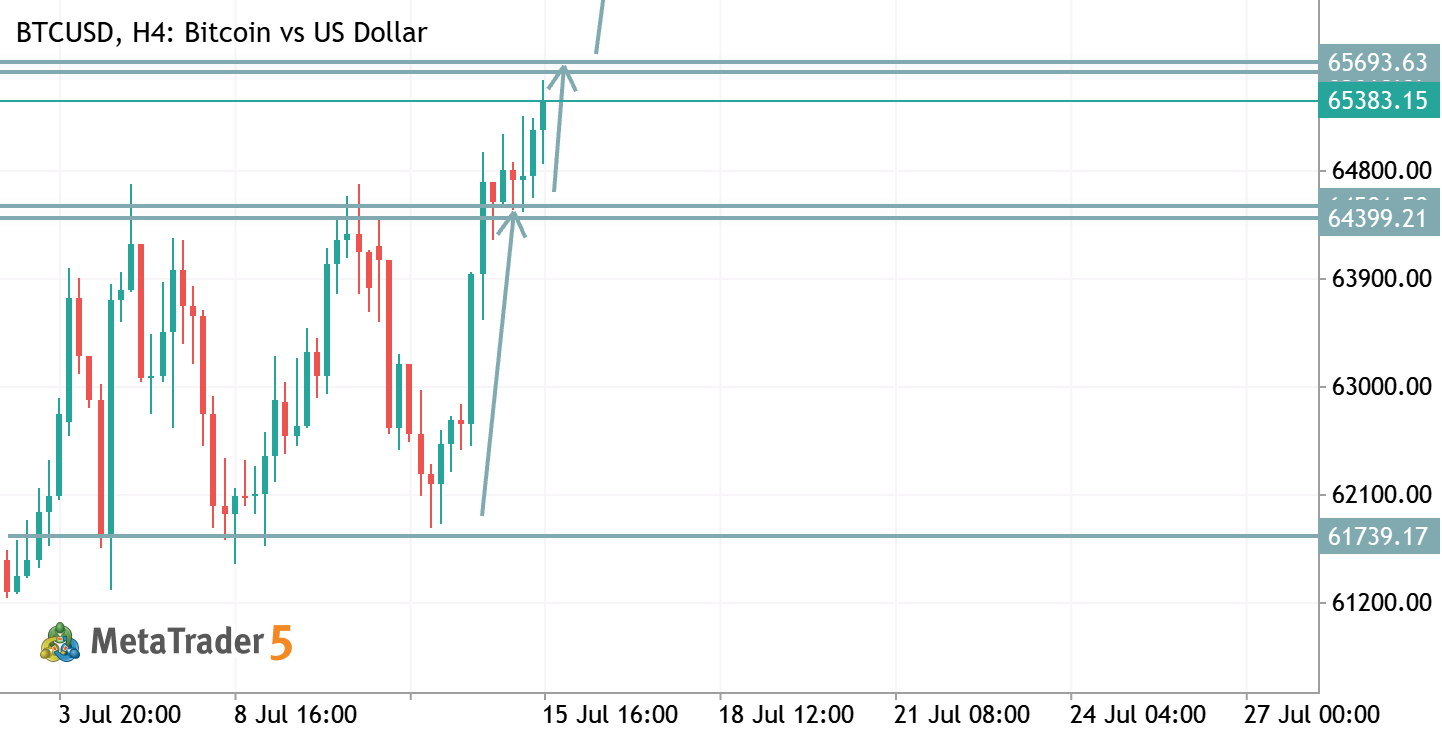
BTCUSD H4 Analysis Bitcoin is reacting from a major demand zone after testing deep Fibonacci support. Buyers are attempting to regain control, and a sustained move above the 64,500–65,000 resistance area could confirm a bullish reversal toward higher liquidity. 📈 Bias: Bullish Recovery 🎯 Targets: 65,800 → 67,000 ⚠️ Key Support: 62,900–62,300 Wait for a confirmed breakout above resistance or a clean retest of support before entering. Always use proper risk management.
XAUUSD H4 ANALYSIS XAUUSD Gold vs US Dollar

XAUUSD H4 ANALYSIS

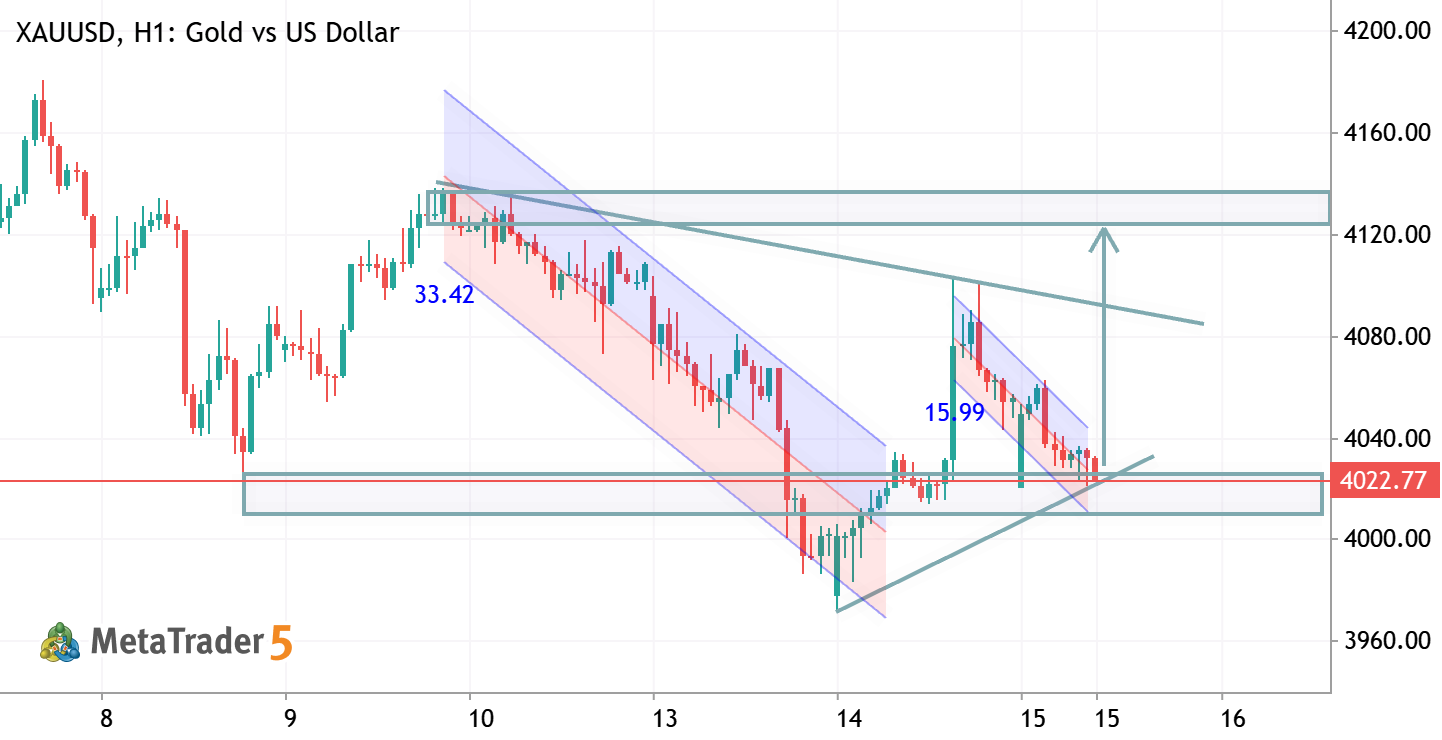
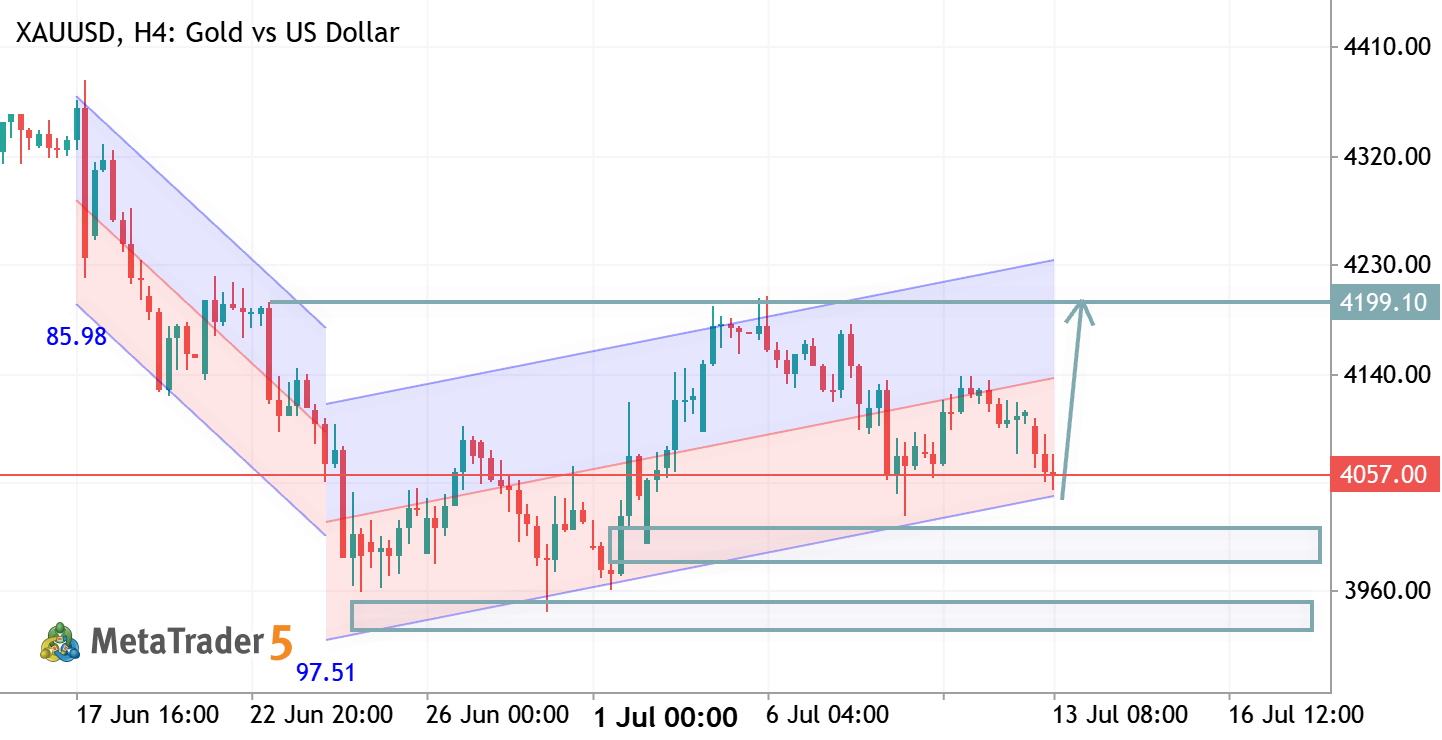
XAUUSD H4 Analysis Gold is recovering from a key demand zone and holding above the 0.786 Fibonacci level, signaling improving bullish momentum. A sustained move above 4100 could open the way toward the next resistance, while holding above support keeps the bullish structure intact. 📈 Bias: Bullish 🎯 Targets: 4165 → 4250 ⚠️ Key Support: 4020–4050 Bllish momentum is building, but wait for a confirmed breakout above resistance before targeting higher levels. Always manage your risk.
BTC/USD: Bearish Breakdown & Fibonacci Golden Zone Retest BTCUSD Short Bitcoin vs US Dollar

BTC/USD: Bearish Breakdown & Fibonacci Golden Zone Retest

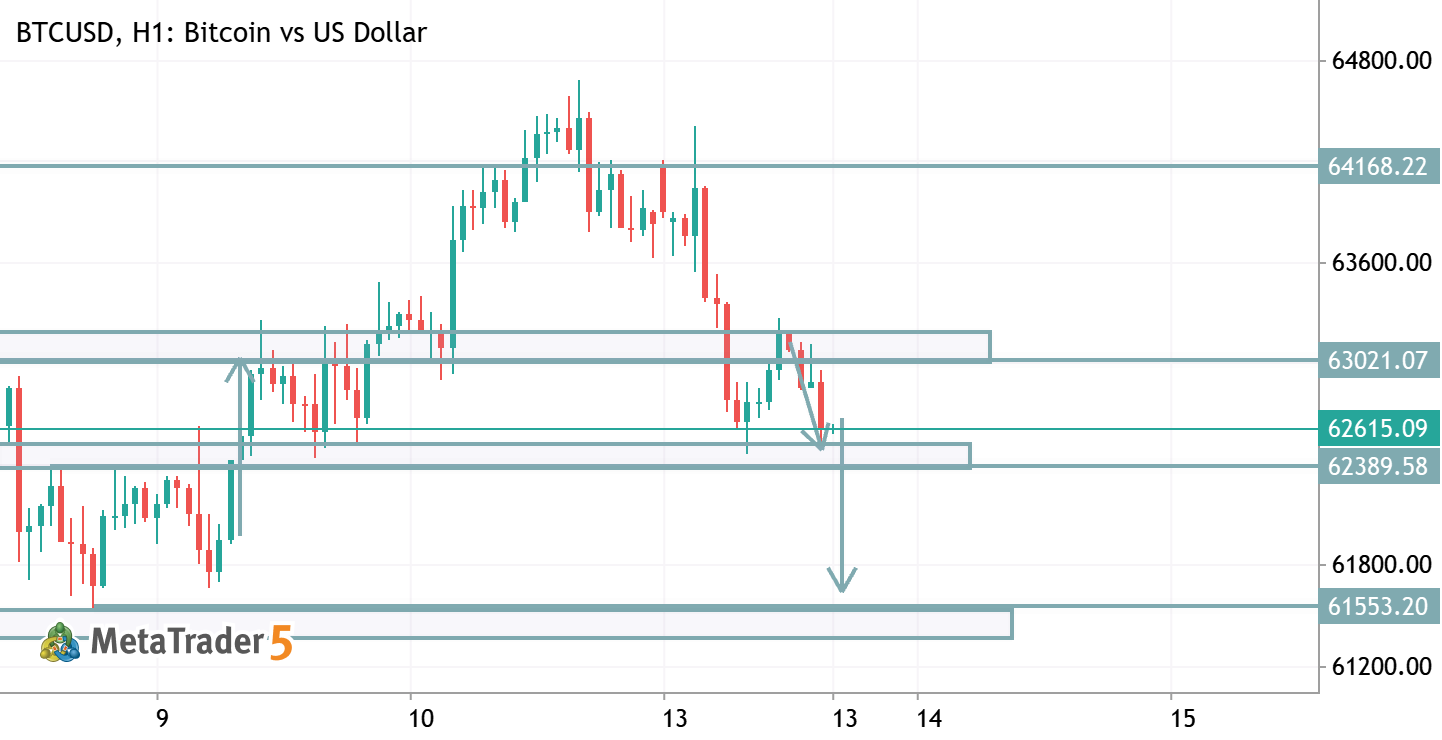
Direction: Short / Sell Asset: BTCUSD Timeframe: M15 📍 Key Trade Levels Entry Zone: $62,900 – $63,120 (Current market price retesting broken support) Stop Loss (SL): $63,550 (Above the 0.786 Fibonacci level / high of the recent pull-back) Take Profit 1 (TP1): $62,440 (Recent local swing low) Take Profit 2 (TP2): $62,000 (Extended target as projected by the trend arrow) 📊 Setup Rationale Support Breakout: Price aggressively broke down below the previous key horizontal support zone ($63,120 – $63,280). Fibonacci Golden Zone Confluence: The retracement move tapped directly into the 0.50 ($63,127) and 0.618 ($63,288) Fibonacci retracement level, which now acts as strong resistance. Bearish Market Structure: Lower lows and lower highs are clearly established on the short timeframe following
XAUUSD TRADE IDEA XAUUSD Short Gold vs US Dollar

XAUUSD TRADE IDEA

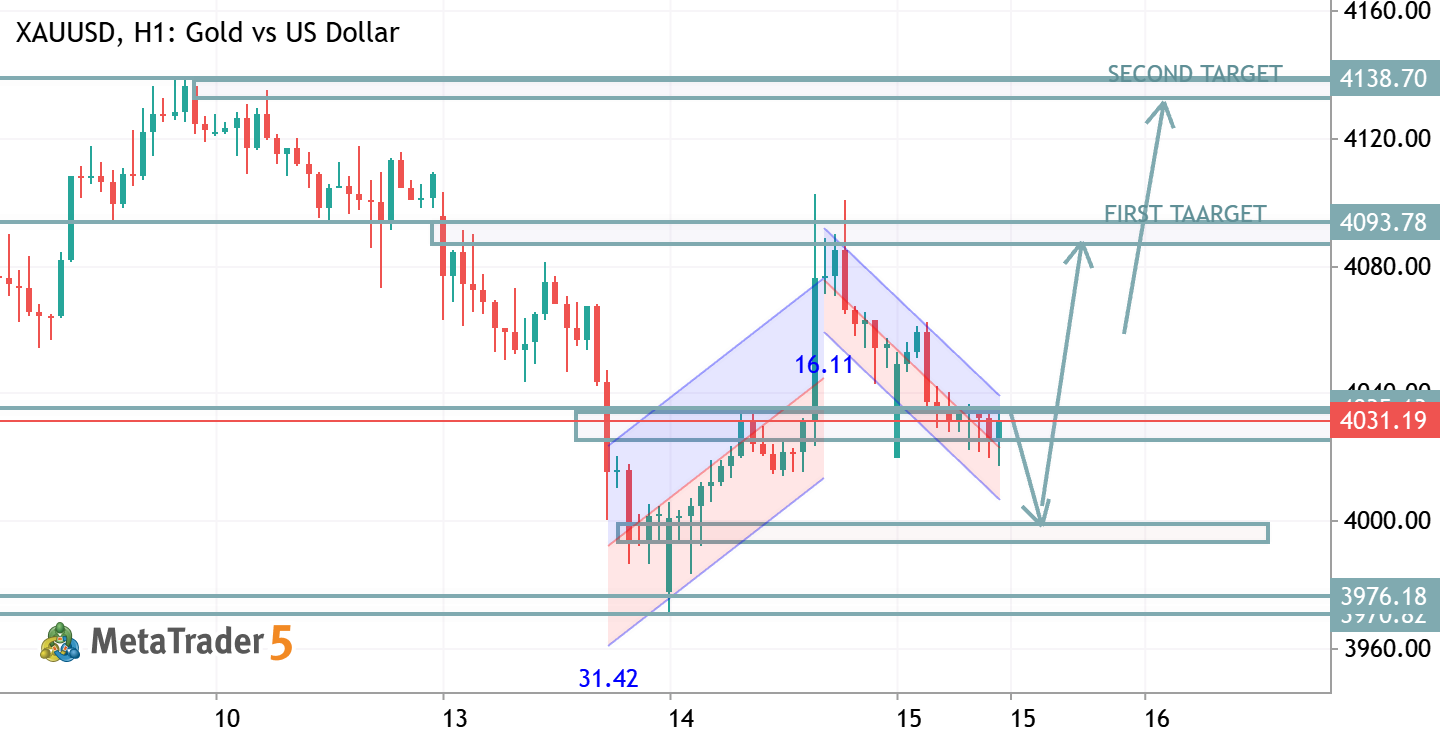
XAUUSD H1 Bias: Sell Price is trading below the 4066 resistance , showing weakening bullish momentum. A move toward the 4048 support is likely. If this level breaks, sellers could extend the decline. Sell Entry: 4060–4068 (or on a rejection from resistance) Stop Loss: Above 4085 Take Profit 1: 4048 Take Profit 2: 4020 Take Profit 3: 4000 Invalidation: A strong hourly close above 4066–4070 would weaken the bearish outlook and could lead to a retest of higher resistance.
XOM - Daily Trading Forecast XOM Long ExxonMobil Holdings Corporation Common Stock

XOM - Daily Trading Forecast

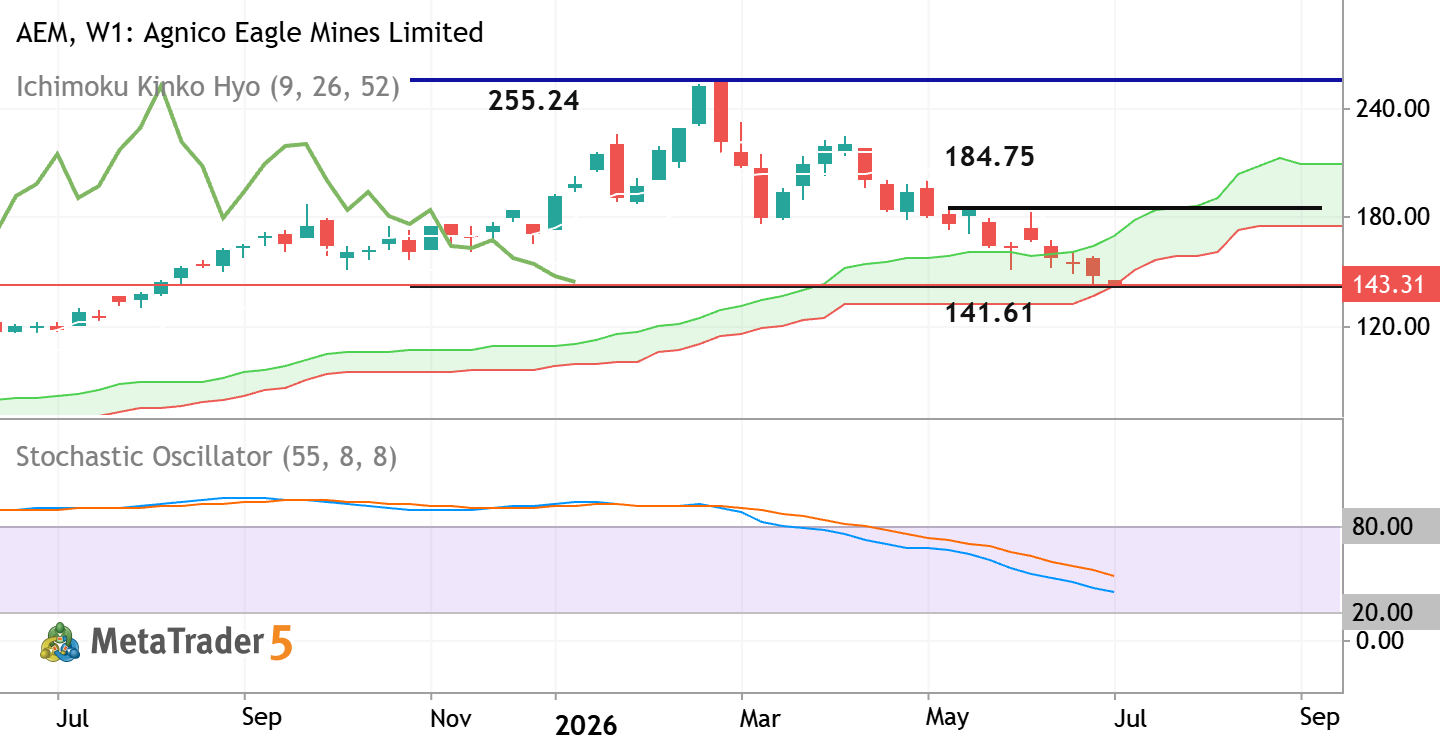
The daily price is located near and above Ichimoku cloud in the bullish area of the chart: Chinkou Span line of Ichimoku indicator already broke the historical price to above for the good breakout to be started, and the price crosses the Ichimoku cloud to above as well for the daily primary bullush reversal. If the price breaks resistance level at 158.71 so the strong bullish trend may be continuing. If the price crosses support level at 146.23 to 134.95 as the nearest possible target so primary bearish trend will be resumed. Alternatively, the price will be on secondary ranging to be near and inside Ichimoku cloud and within s/r channel waiting for direction of the strong trend to be started. Trading Summary : breakout with the possible daily bullish reversal
XAUUSD Bearish Setup: 4H Symmetrical Triangle Breakdown Targets 3800 XAUUSD Short Gold vs US Dollar

XAUUSD Bearish Setup: 4H Symmetrical Triangle Breakdown Targets 3800

XAUUSD (Gold) – Bearish Continuation Setup Gold has broken below the symmetrical triangle formation, signalling a potential shift in momentum toward the downside. After the breakout, price is now trading within a regression channel, suggesting that sellers may continue to control the short-term structure. Key levels: Resistance: 4025–4045 area (breakdown/retest zone) Bearish confirmation: Continued rejection below the broken triangle support Downside target: 3800 region Scenario: If gold remains below the broken triangle support and the regression channel continues to hold, price may extend lower toward the 3800 area. Invalidation: A strong recovery back above the broken structure would weaken the bearish setup.