
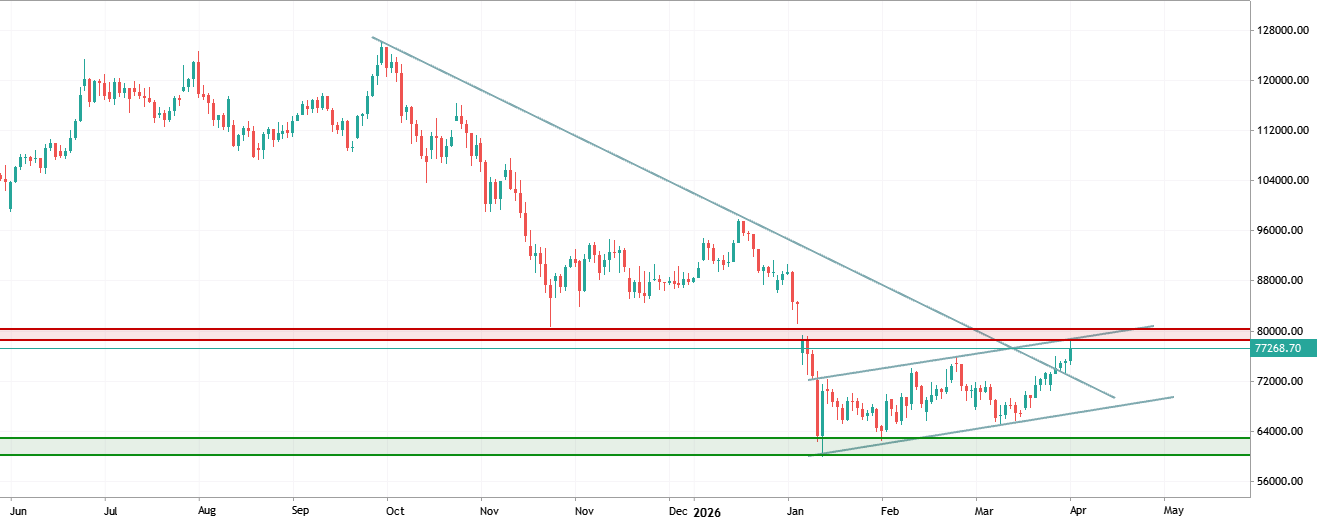
Bitcoin (BTC/USDT) is currently navigating a critical iuncture on the daily timeframe. After a steady recovery within a rising structure, the price has reached a high-confluence zone that will likelv dictate the market's direction for the coming weeks.
Kev Chart Observations.
Since the February lows, BTC has been respecting a well-defined Ascending channel. The price is currently testing the upper boundary of this channel, which often acts as a short-term exhaustion point
A long-term bearish trendline stemming from the previous peak is now intersecting perfectly with the current price action. This is the primary hurdle for the bulls Critical Zones:
4G+ 425
Supply Zone: Located between $78,000 - $80,000. This area is reinforced by the 0.5 Fibonacci retracement leve $79,157). A daily close above this level is mandatory for a trend reversal.
Demand Zone: A solid support base sits between $60,000 - $63,000. which served as the launchpad for the recent move.
Potential Scenarios
1. The Bullish Breakout
If BTC manages to print a strong daily candle above the $80,000 psychologica barrier and the red trendline. it would signal a massive structural shift
Targets: $88,000 -
$92,000 -
$96,000.
2. Reiection & Consolidation
Given the confluence of the channel's resistance. the lona-term trendline, and Support Levels: If rejected, keep an eve on the channel's midline near $72,000. A deeper correction could lead the price back to the channel's floor or the $68,000 support area.
Trading Strategy*
For Buvers: Wait for a confirmed preakout and retest of the $80,000 zone before looking for long entries. Buying at the current ceiling carries a high risk-to-reward ratio.
For Sellers: Watch for bearish price action signals on the 4H or Daily charts near the red box for potential short plavs toward the channel midline
What's your take? Will the bulls have enough momentum to break the "Red Wall,' or are we headed for a pullback?
Please don't foraet to like and share your thoughts in the comments
Nouveau commentaire