
Related tickers
| # | Nom | Prix | 24h % | 7 jours % | 1M % | 1 an % | 7 Derniers Jours | |
|---|---|---|---|---|---|---|---|---|
| 1 | LTCUSD Litecoin vs US Dollar | 58.62 USD | +0.24% | -2.96% | -3.14% | -35.82% | ||
| 2 | ETHUSD Ethereum vs US Dollar | 2391.55 USD | +0.14% | -1.66% | -10.43% | -37.32% | ||
| 3 | MBTUSD milliBitcoin vs US Dollar | 81.219 USD | -0.09% | -0.90% | -3.50% | -25.86% | ||
| 4 | ETCUSD Ethereum Classic vs US Dollar | 7.741 USD | +0.97% | -2.52% | -10.31% | -50.56% |
Nouvelles
Bitcoin : Pour Michael Saylor, mieux vaut le conserver que l’utiliser pour payer ses achats
Bitcoin : Le marché replonge malgré 1 milliard $ injecté dans les ETF
Le 21 est-il une date noire pour Bitcoin ? Sa dernière percée haussière vient d’échouer
Bitcoin : Strive gagne 13 % et Strategy 7 % après le rebond du BTC
Le Bitcoin retombe à 82.000$ sous la pression de l’IA et du pétrole
Bitcoin : Les ETF attirent 550 M$ en seulement deux jours
Bitcoin : Glassnode identifie une résistance à 87 700 $ et un support à 80 000 $
Bitcoin : Musk confirme les discussions entre Tesla et SpaceX
Bitcoin résiste mieux que le Nasdaq et les altcoins, selon Wintermute
Bitcoin : 500 BTC jugés inaccessibles transférés après dix ans
Bitcoin : Les paris haussiers persistent alors que les acheteurs se font rares
Graphique & Idées
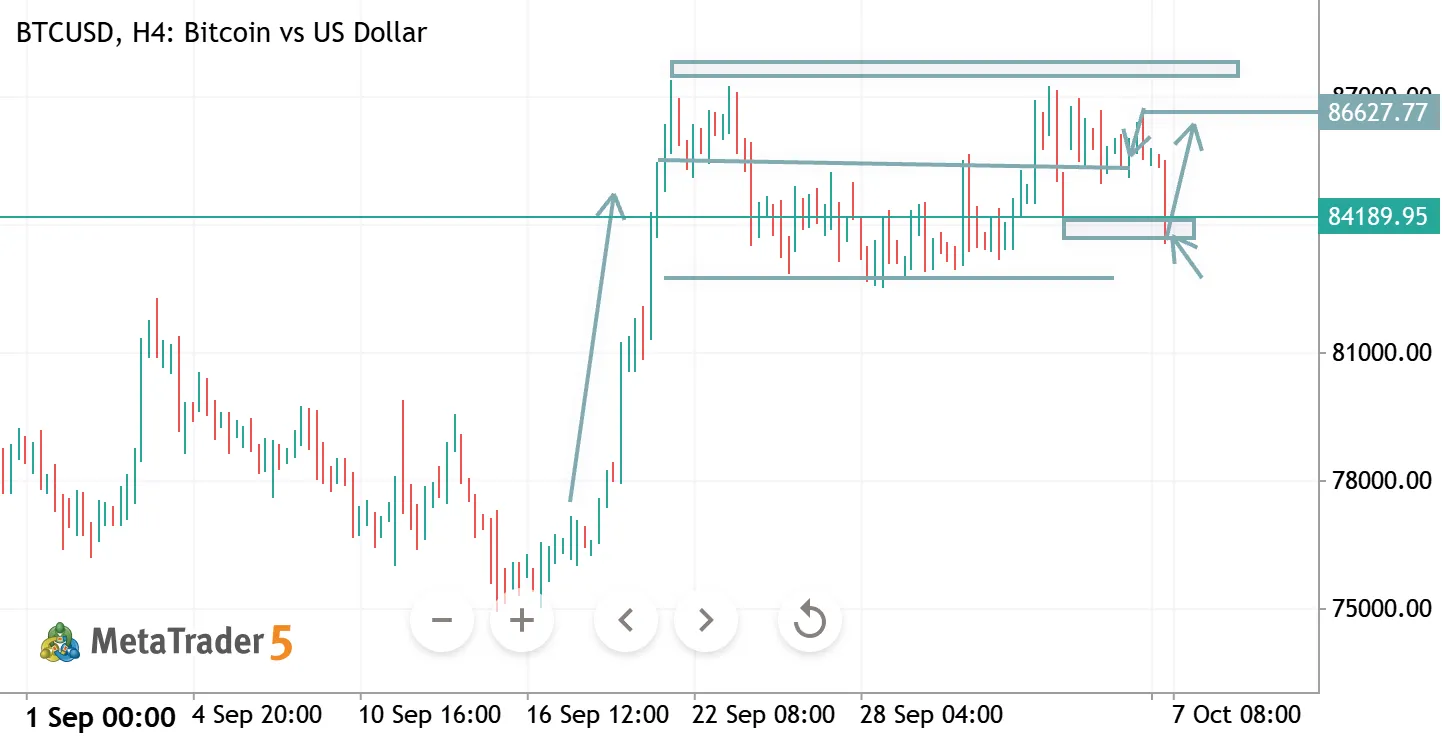
BTCUSD H4 ANALYSIS
BTCUSD H4 Analysis
BTC is consolidating near 84,100 after a strong recovery. The 84,000–84,500 zone is key support; holding above it could push price back toward 86,700–88,000.
🔹 Support: 84,000–84,500 🔹 Resistance: 86,700–88,000 🔹 Bias: Bullish above 84,000 🔹 Key Trigger: Break above 86,700 → upside continuation.

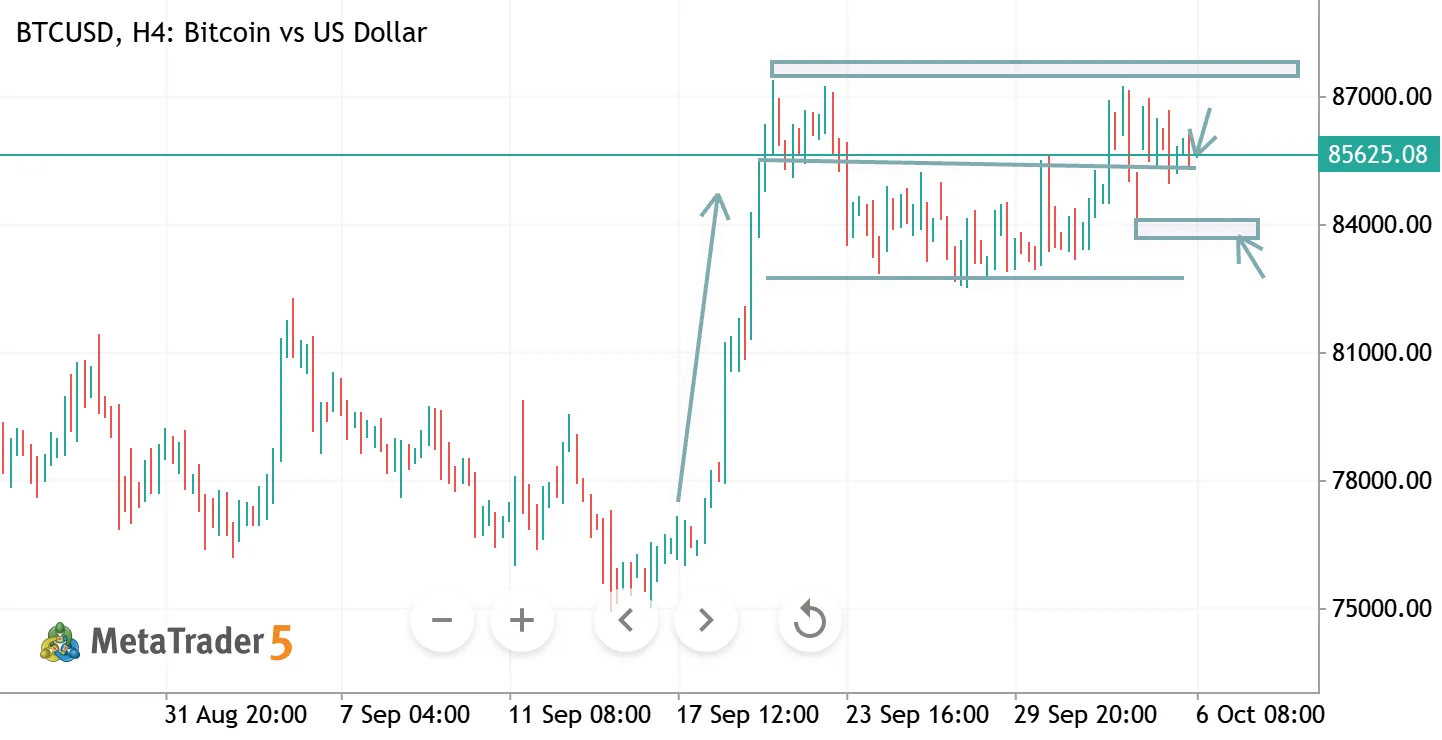
BTCUSD H4 ANALYSIS
BTCUSD H4 Analysis
BTC is consolidating below the 86,000–87,000 resistance zone after a strong recovery. A breakout above this area could resume the bullish move toward 88,000, while rejection may pull price back toward 84,000–82,500.
🔹 Resistance: 86,000–87,000 🔹 Support: 84,000–82,500 🔹 Bias: Bullish above 84,000 🔹 Key Trigger: H4 close above 87,000 → upside continuation.
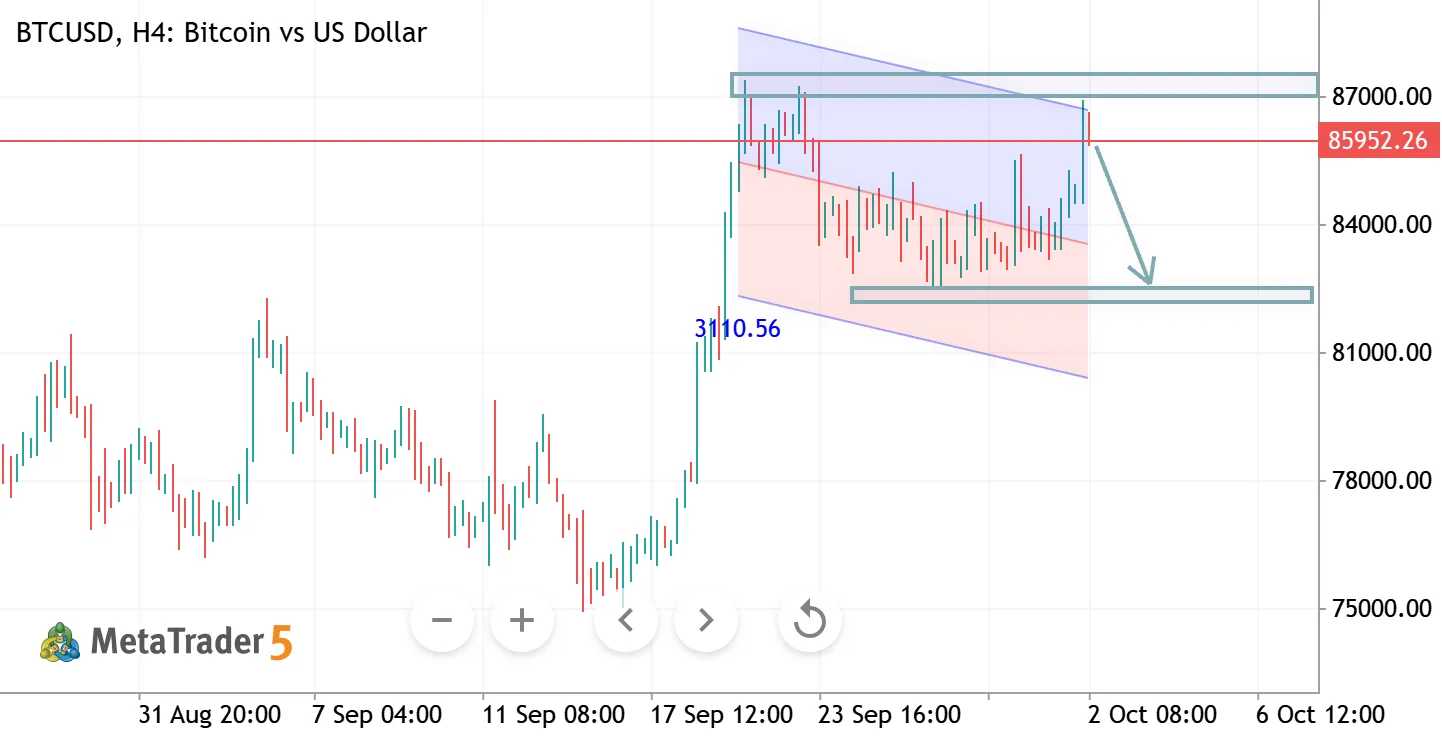
BTCUSD H4 ANALYSIS
BTCUSD H4 Analysis Bitcoin is testing a major resistance zone around 85,800–86,500 after a strong recovery. Rejection here could trigger a pullback toward the 82,000 support zone. 🔹 Resistance: 85,800–86,500 🔹 Support: 82,000–82,500 🔹 Bias: Bearish below 86,500 🔹 Key Trigger: Break above 86,500 → bullish continuation; rejection → downside toward 82,000.
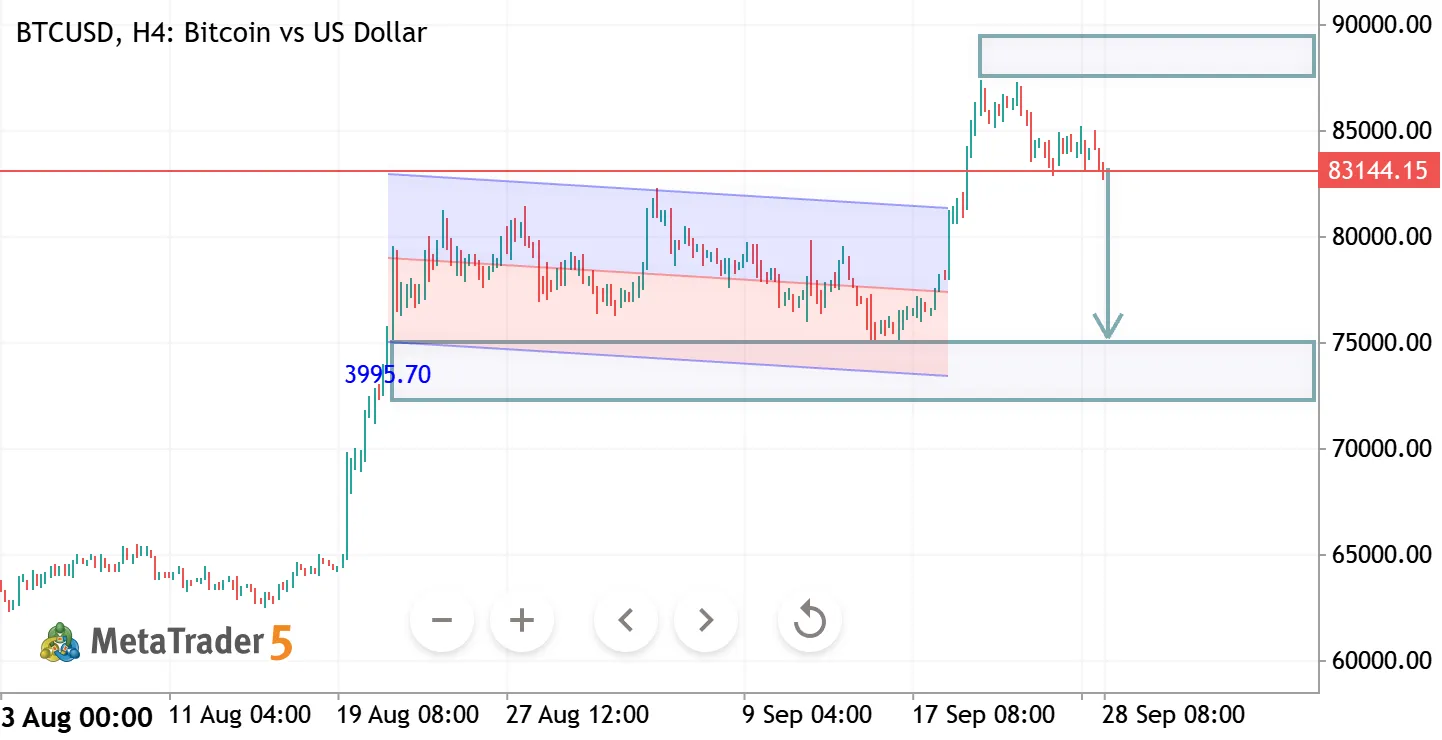
BTCUSD H4 ANALYSIS
GBPUSD – Technical Analysis 📊
GBPUSD is showing signs of a potential bullish reversal after moving within a descending channel. Price is holding around 1.3230, with the chart indicating a possible move toward the 1.3380–1.3400 resistance zone.
🔹 Support: 1.3200–1.3230 🔹 Target Zone: 1.3380–1.3400 🔹 Key Level: Sustained strength above 1.3260 would support the bullish setup.
Disclaimer: Technical analysis is based on chart structure and is not financial advice.
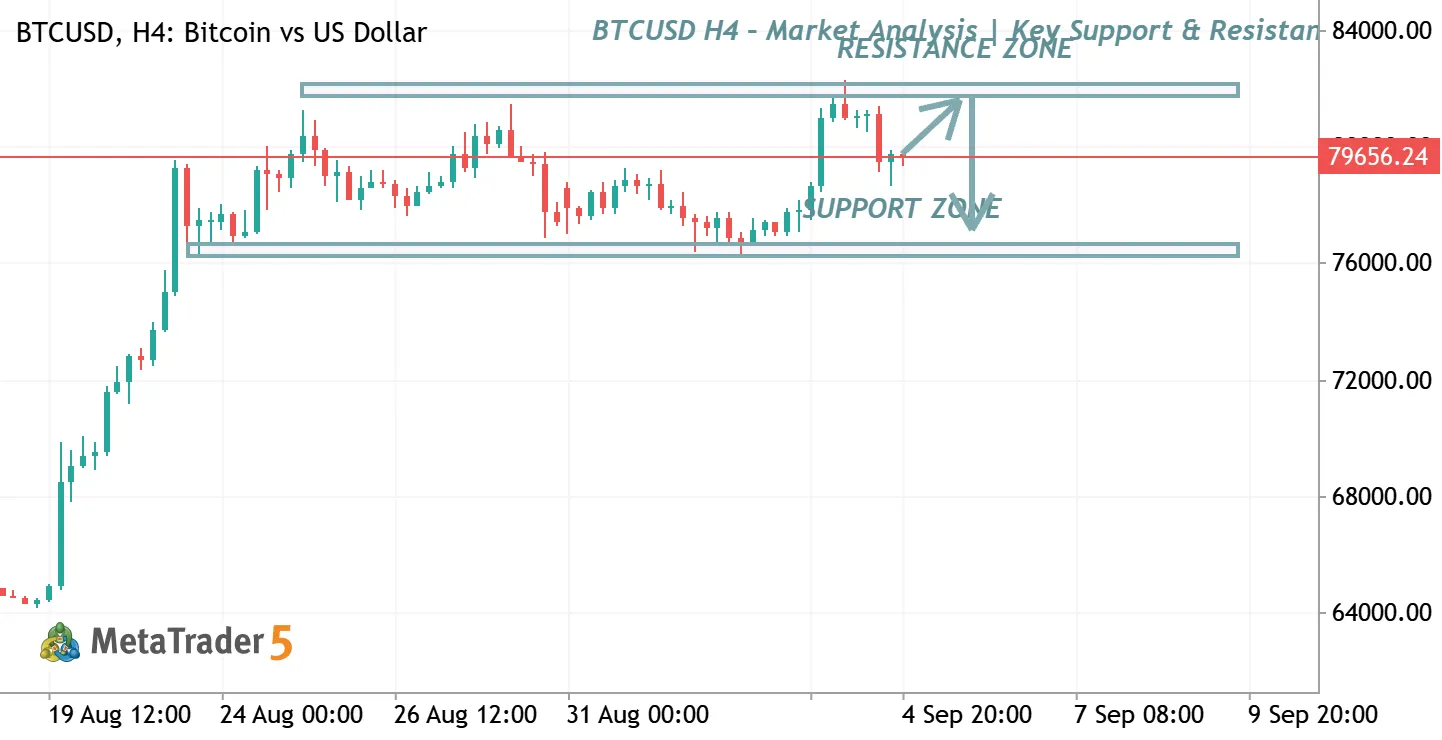
BTCUSD H4 – Market Analysis | Key Support & Resistance
BTCUSD is currently trading between important support and resistance zones on the H4 timeframe. Price is approaching a critical area where traders should watch for confirmation of either a bullish breakout toward the resistance zone or a bearish rejection toward support . 📈 Bullish Scenario: Break and hold above resistance may open the way for further upside.
📉 Bearish Scenario: Rejection from resistance could lead price back toward the major support zone. ⚠️ Trade with proper risk management and wait for confirmation before entering

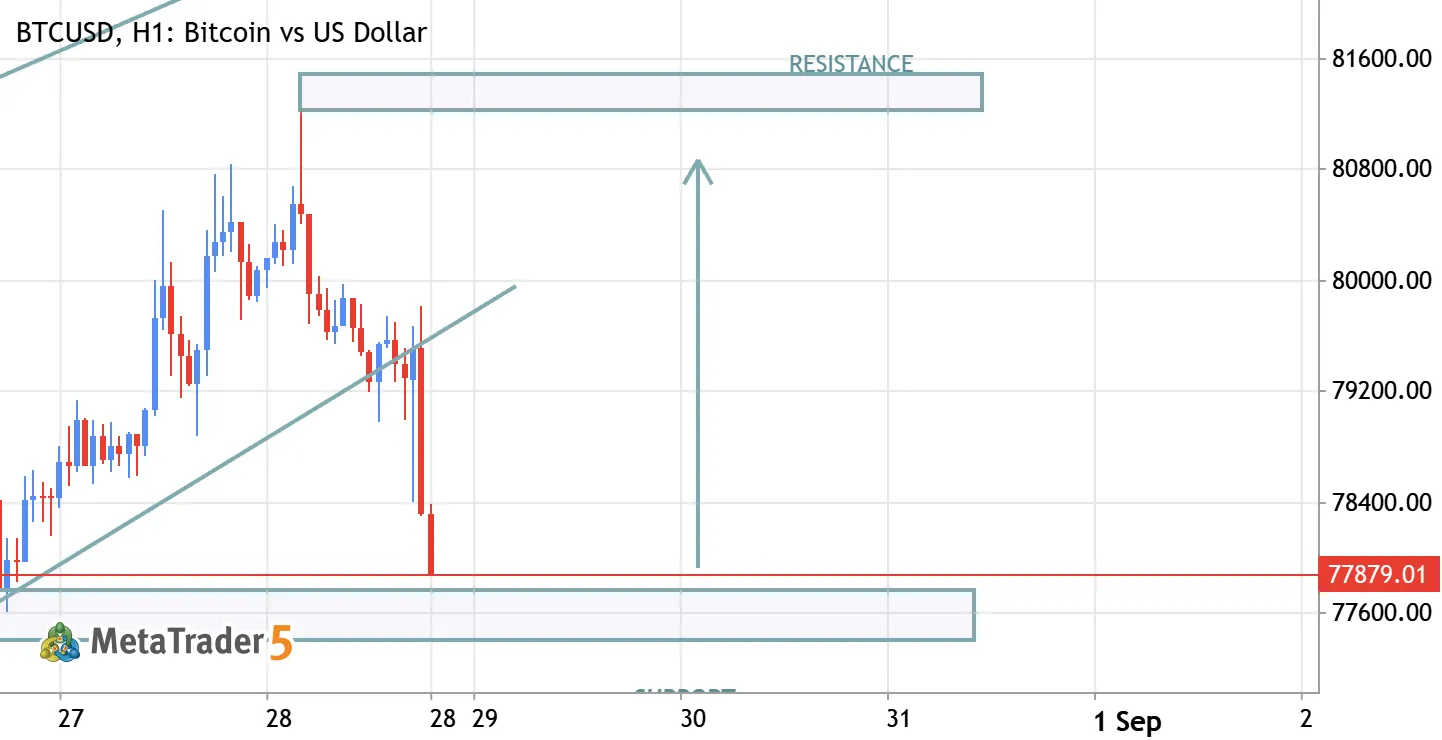
BTCUSD BULLISH TREND AFTER SUPPORT
BTCUSD BULLISH FROM SUPPORT TARGETS 81600


The BTCUSD doesn’t have other trading ideas at this time
Browse ready-made trading ideas or select a symbol and create your own
Go to Charts and Trading Ideas