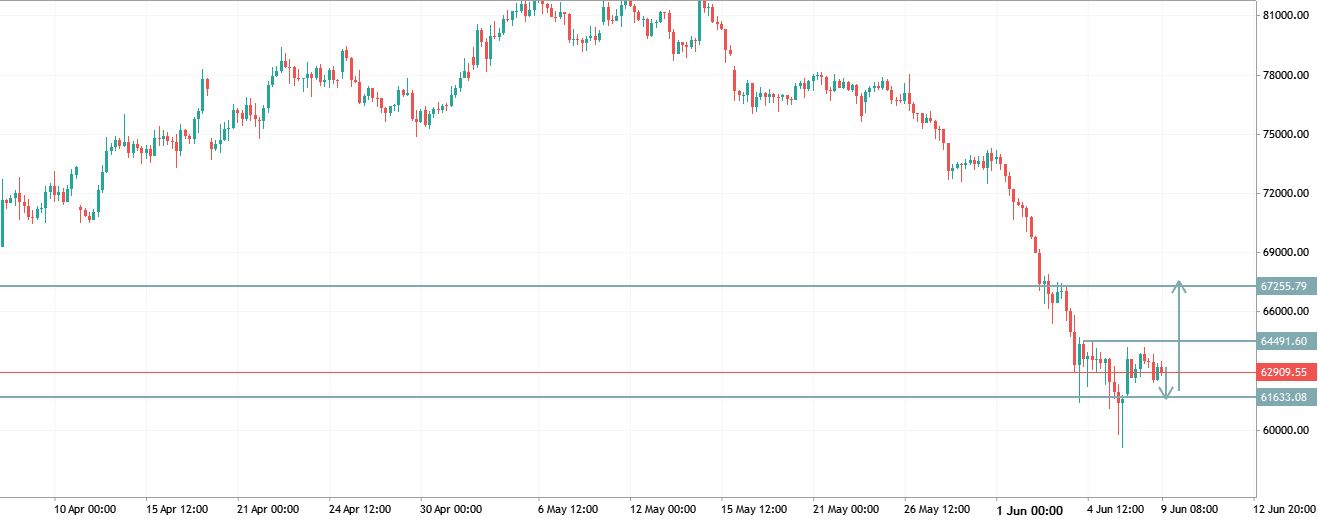
Market Structure: Bearish
- The chart shows a strong downtrend with consecutive lower highs and lower lows.
- Heavy selling pressure pushed price from the 81,000 area down toward 61,000–63,000.
- Recent price action is moving sideways after the sharp drop, indicating consolidation rather than a confirmed reversal.
Key Levels
- Resistance 1: 64,491
- Resistance 2: 67,256
- Support 1: 61,633
- Current Pivot: 62,845
Bullish Scenario
- A H4 candle close above 64,491 could trigger a recovery move.
- Target zones:
- 67,256
- Higher resistance if momentum continues.
Bearish Scenario
- Failure to break 64,491 and a close below 61,633 would favor trend continuation.
- Sellers could target fresh lows below the recent swing low.
Trading Idea
- Buy Setup: Above 64,491 after a confirmed breakout.
- TP1: 67,256
- SL: Below 61,633
- Sell Setup: Rejection from 64,491 or breakdown below 61,633.
- TP: New lows below 60,000
- SL: Above the rejection high.
Conclusion
The dominant trend remains bearish, but price is currently ranging between 61,633 and 64,491. Wait for a breakout of this range before taking a directional trade. A break above 64,491 favors a short-term buy, while a break below 61,633 favors continuation selling.

Nouveau commentaire