Alligator - traditional general approach AUDUSD Australian Dollar vs US Dollar
Alligator - traditional general approach

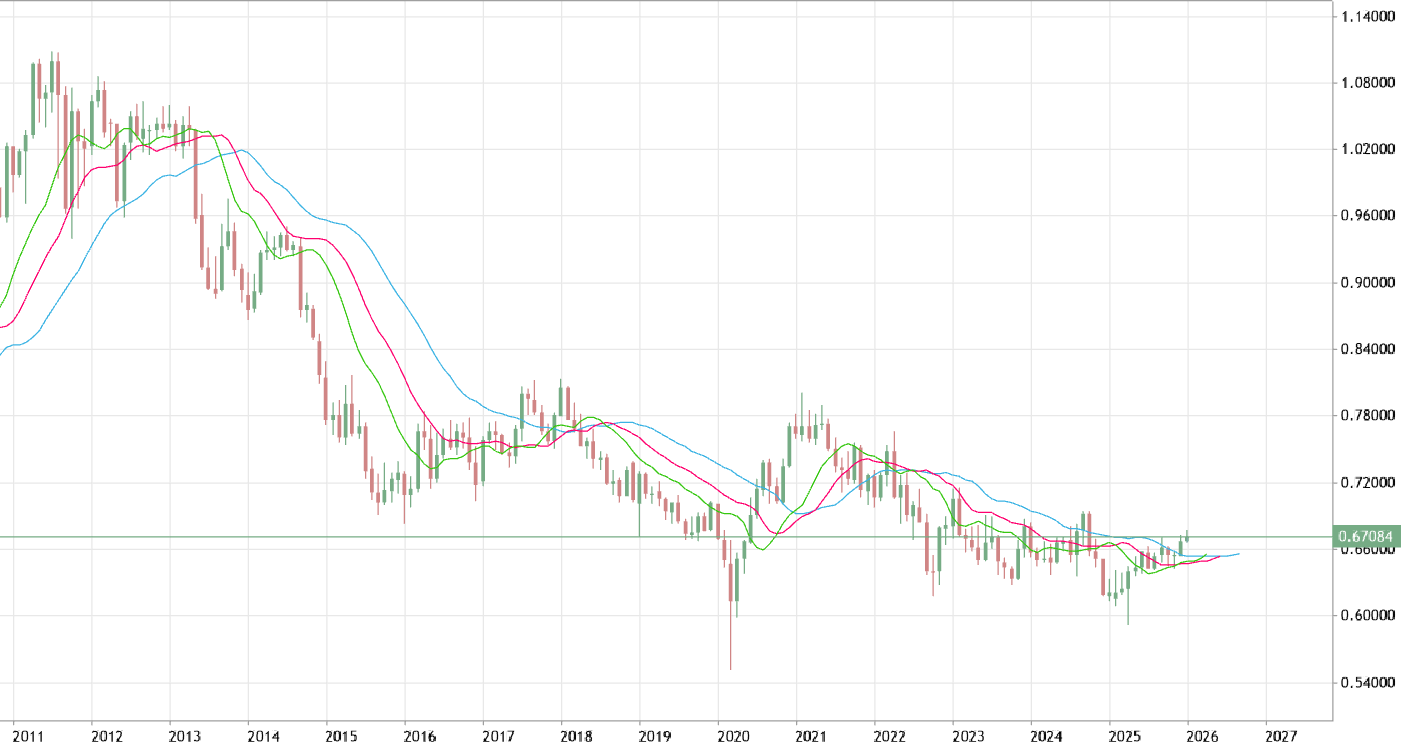
The alligator was first described by Bill Williams in his book New Trading Dimensions. There are three smoothed moving averages using 13, eight, and five periods and shift them by eight, five, and three bars into the future. The longest period line is blue (the alligator's jaw), the middle one is red (the alligator's teeth), and the shortest one is green (the alligator's lips). According to Williams, when these three moving averages are twisted together, it means the alligator indicator rests, and so we also rest. But the longer the alligator sleeps, the hungrier it is. So when the alligator awakes after a good, long rest it is very hungry to hunt for food. And its food is price. For example: when all three lines are aligned, going up one after another with the green being greater than red being greater than blue, prices are in an uptrend. You need to look into the possibility of buying (opposite to sell).

Moving Averages - traditional general approach EURUSD Euro vs US Dollar
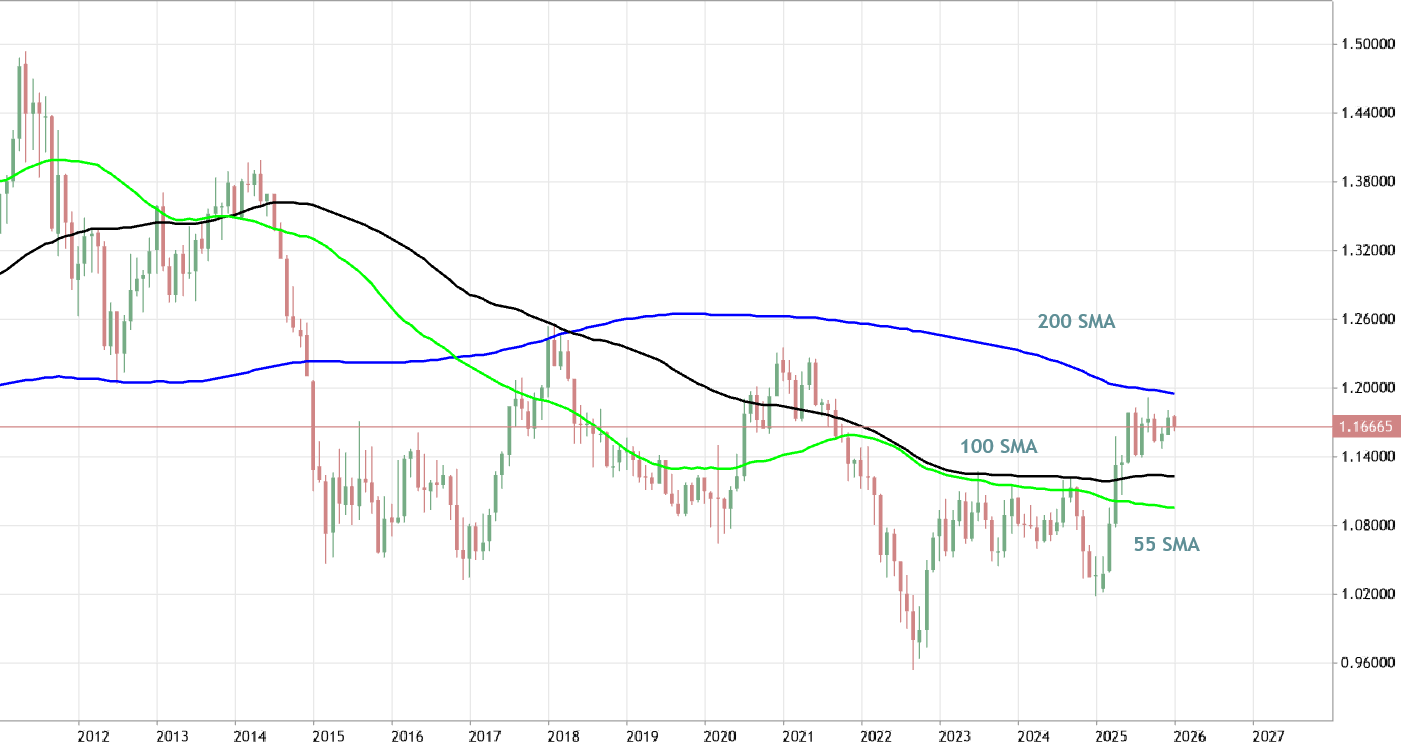
Moving Averages - traditional general approach
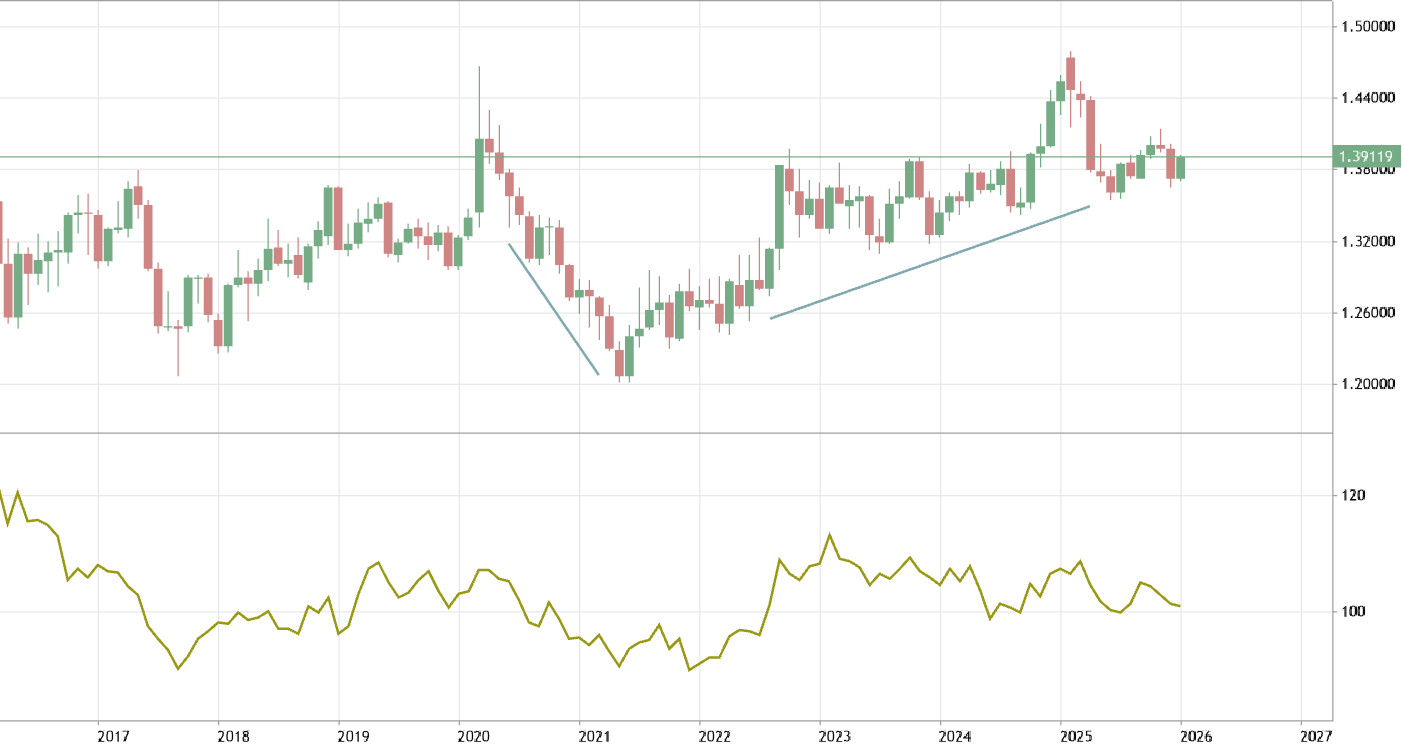
Moving Average (MA for short) is a technical tool that averages a currency pair’s price over a period of time. The smoothing effect this has on the chart helps give a clearer indication on what direction the pair is moving either up, down, or sideways. There are a variety of moving averages to choose from. Simple Moving Averages and Exponential Moving Averages are by far the most popular. The traders are usually using SMA indicators with the period of 100 and 200 to estimate the market condition, and with the periods of 55 and 11 for intra-day trading for example.
Stochastics - traditional general approach USDJPY US Dollar vs Yen
Stochastics - traditional general approach
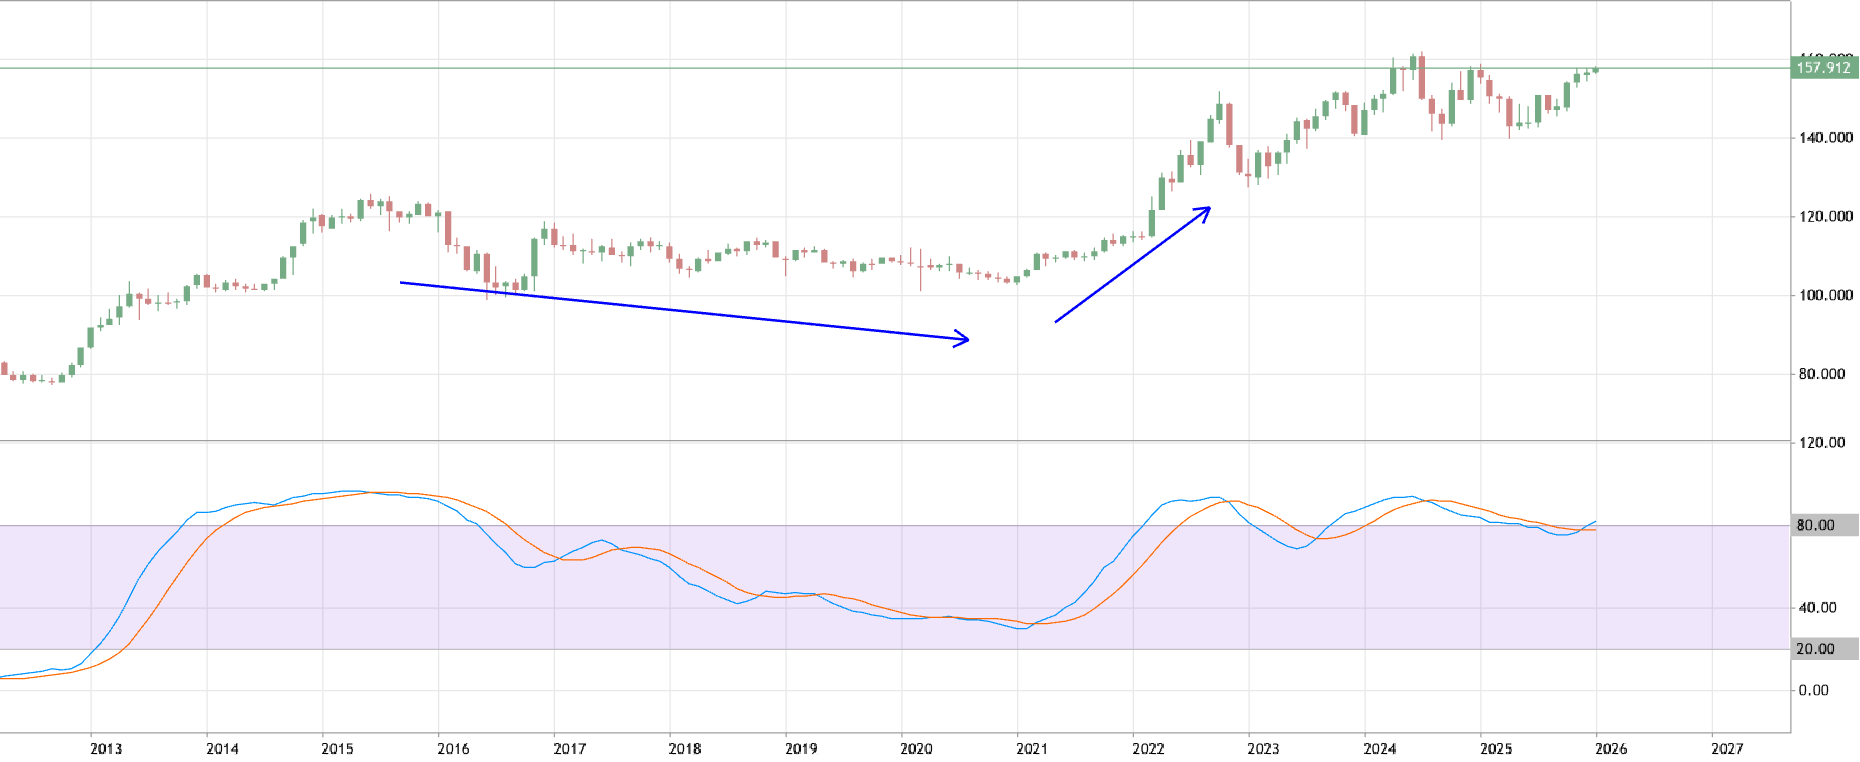
Stochastics offer traders a different approach to calculate price oscillations by tracking how far the current price is from the lowest low of the last X number of periods. This distance is then divided by the difference between the high and low price during the same number of periods. The line created, %K, is then used to create a moving average, %D, that is placed directly on top of the %K. The result is two lines moving between 0-100 with overbought and oversold levels at 80 and 20. Traders can wait for the two lines to crosses while in overbought or oversold territories or they can look for divergence between the stochastic and the actual price before placing a trade.
Scalping: Multiple Time Frame confirmation with 55-SMA on higher timeframe EURCHF Euro vs Swiss Franc
Scalping: Multiple Time Frame confirmation with 55-SMA on higher timeframe
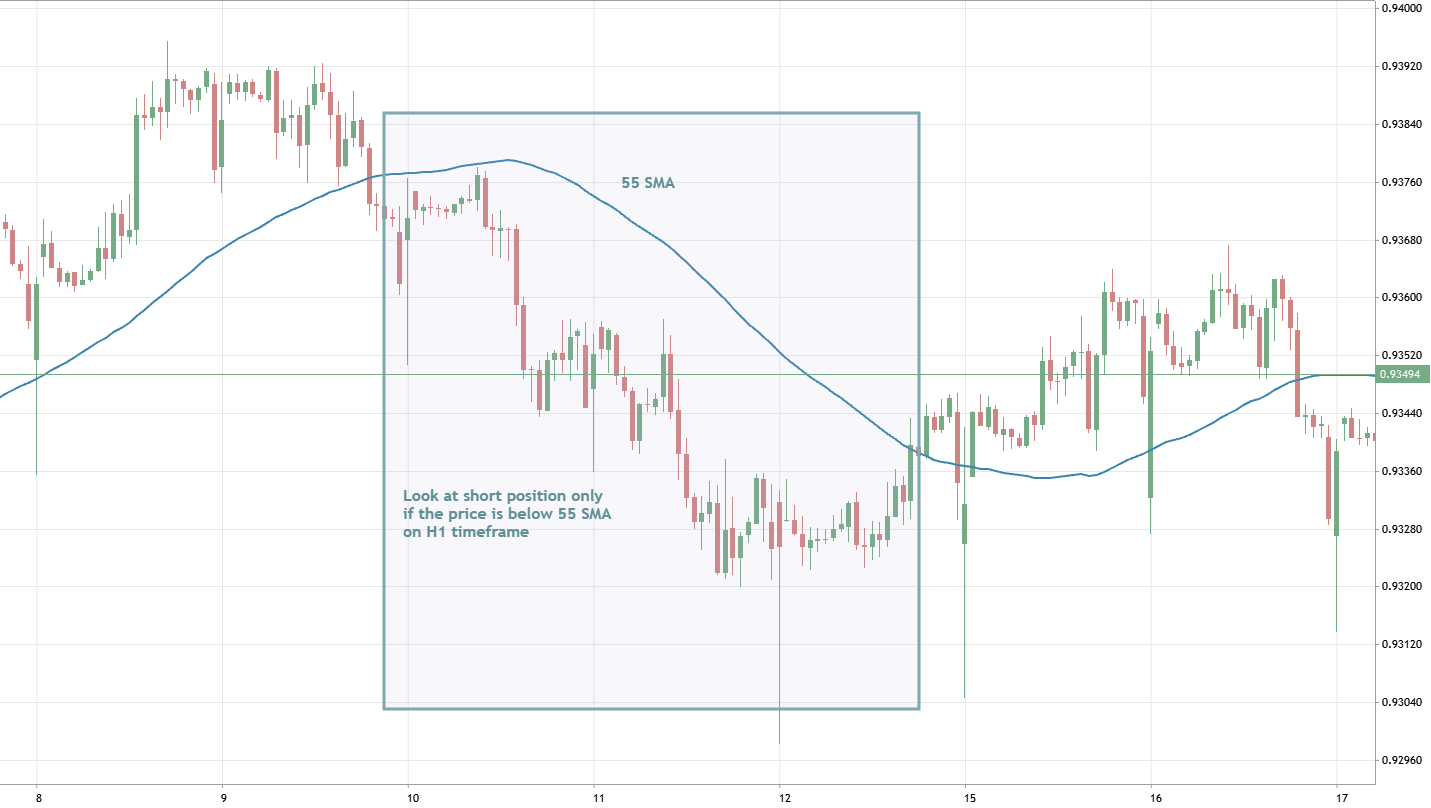
Scalping is the very complicated but very profitable technique in trading. Multiple Time Frame analysis can be helpful in case of long or short position to ne confirmed. The most populat confirmation method is 55-SMA on H1 timeframe: when the price is below this SMA so the short position only should be considered (on M1 timeframe for example), and if H1 price is above 55-SMA - the long position should be taken into consideration. And it will help to reduce the number of fase signals/trades on M1 timeframe for example.