


With Bitcoin trading near $64,047, according to the supplied TradingView data, the market is approaching a potentially important technical test at $64,850.
The level has gained attention because it aligns with the 50-day exponential moving average (EMA) and the daily volume-weighted average price (D-VWAP). Bitcoin has already failed twice to reclaim this area, leaving the short-term trend vulnerable to another rejection.
The timing adds another layer of uncertainty. The Federal Reserve is due to release its policy decision on July 29, followed by a press conference at 2:30 p.m. ET. The Fed left its policy rate unchanged at its June meeting, while recent market commentary has highlighted renewed inflation concerns and uncertainty around the path of interest rates.
For the Bitcoin price prediction , the immediate question is whether BTC can regain $64,850 before the policy event or whether traders remain cautious ahead of the decision.
Bitcoin Price Today Faces Resistance at $64,850
An X post by @stoegii highlighted the repeated failure of Bitcoin to expand higher after two unsuccessful attempts to reclaim $64,854. The analysis identifies the zone as a confluence of the 50-day EMA and D-VWAP, making it a significant short-term technical barrier.
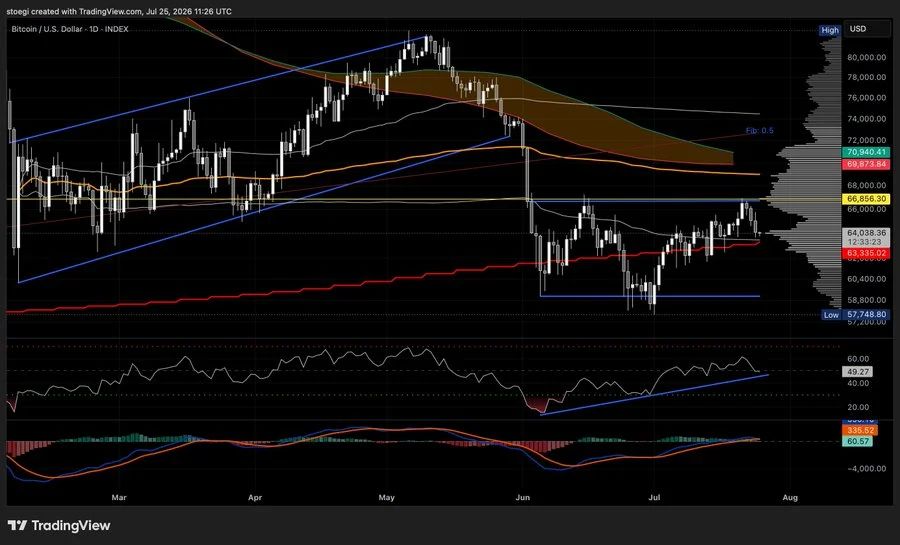
Bitcoin remains below the $64,854 resistance, with two failed reclaim attempts signaling weak bullish momentum. Source: @stoegii via X
The post described the market as being in a compressed reset range between $63,750 and $64,854. Bitcoin's RSI was reported at 49.27, placing the indicator almost exactly at the midpoint and near a June trendline that previously acted as a bounce area. Meanwhile, the MACD histogram was reportedly fading, suggesting that upside momentum had lost some strength.
"Failed expansion" has therefore become a key theme in the short-term Bitcoin price forecast. Without a sustained break above $64,850, the market may continue moving sideways rather than establishing a fresh directional trend.
The same analysis identifies $63,335 as an important support level near the 200-week simple moving average (SMA). A decisive loss of that area could expose Bitcoin to lower levels around $62,500 and potentially $61,250.
BTC/USD Bullish Reversal: Channel Support Bounce
A separate technical analysis from ProfitPro669 presents a more constructive interpretation of the BTC chart.
According to the analysis, Bitcoin recently responded positively from a broad support area between $63,100 and $63,700. This region combines several technical factors, including an ascending channel boundary, a bullish order block near $63,130, and a previously identified fair value gap between $62,471 and $63,715.
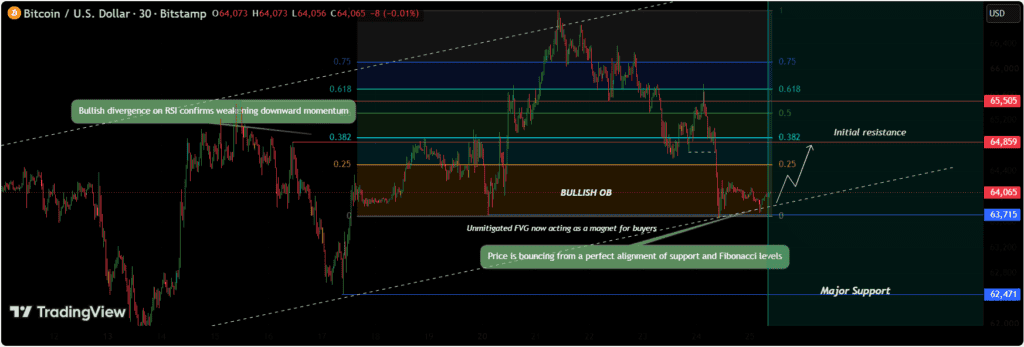
Bitcoin is showing a strong bullish response from the $63,100–$63,700 support zone, with technical indicators pointing to potential continued upside. Source: ProfitPro669 on TradingView
The analysis also points to the 0.618 Fibonacci retracement, commonly known as the "Golden Pocket," as another area of confluence.
Lower-timeframe momentum indicators provide additional support for the bullish case. The analysis identifies bullish divergence on the RSI, suggesting that selling pressure may be weakening. It also highlights a bullish MACD crossover below the zero line, accompanied by expanding positive histogram bars.
However, the setup has a clearly defined technical invalidation level. A clean break below $62,471 would undermine the bullish structure described in the analysis.
This leaves Bitcoin at a crossroads. Holding above the $63,100-$63,700 region could keep a recovery attempt alive, while a break below $62,471 would weaken the short-term bullish argument.
BTC | Bearish Rejection from Resistance | 4H Technical Analysis
The broader four-hour chart remains more cautious. According to Ethan-Blake's analysis , Bitcoin is trading below a resistance zone between $66,000 and $67,200, where sellers have previously defended the market. While that region is above the immediate $64,850 hurdle, it represents a larger barrier that bulls would eventually need to overcome to establish a stronger recovery.
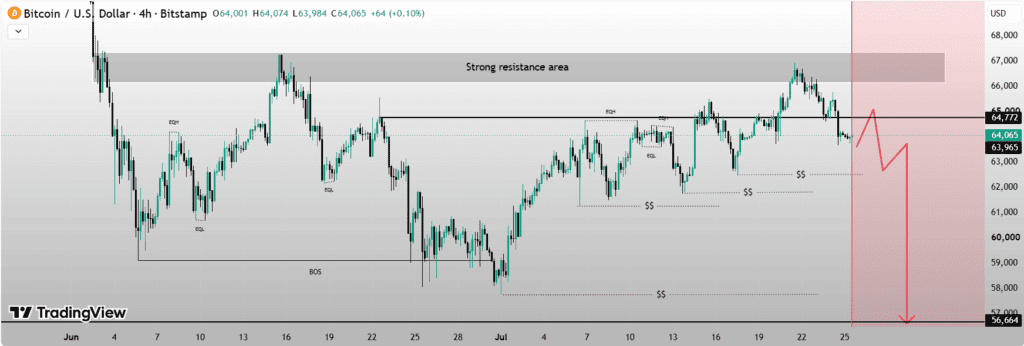
Bitcoin is facing repeated rejection at a key 4H resistance zone, signaling weakening bullish momentum and raising the risk of further downside. Source: Ethan-Blake on TradingView
The current support area is identified between $63,800 and $64,000. If that zone fails, the analysis highlights potential downside levels at $62,000, followed by $58,000 and $56,600.
The resulting bias remains bearish while Bitcoin trades below $66,000-$67,200. However, this does not necessarily imply an immediate decline. The $63,800-$64,000 area remains an important near-term test, particularly because other technical studies identify nearby support around $63,100-$63,700.
Bitcoin (BTCUSD) Technical Analysis Report
The supplied TradingView technical data shows Bitcoin near $64,047, with the overall technical summary rated Neutral. The breakdown includes 12 Sell signals, 10 Neutral signals and four Buy signals.
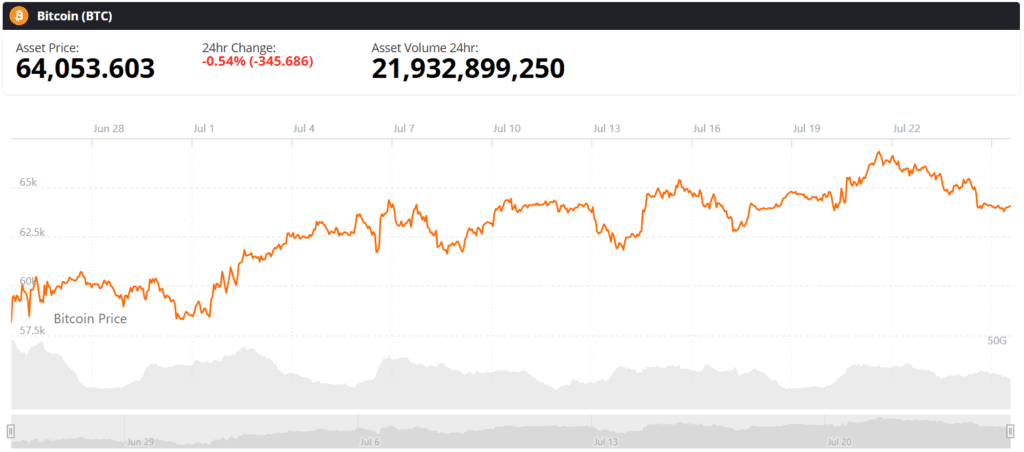
Bitcoin (BTC) price chart. Source: Brave New Coin
The oscillator group is also Neutral, with zero Sell, nine Neutral and two Buy readings. RSI 14 stands at 49, while Stochastic %K is 51 and CCI is -16. The ADX reading of 18 points to relatively weak trend strength, consistent with a market that is consolidating rather than trending decisively.
Other readings are similarly mixed. Momentum at -667 is marked Buy, while the MACD level of 398 also carries a Buy signal. The Stochastic RSI Fast is 33, Williams %R is -56, and the Ultimate Oscillator is 53.
Moving averages provide a less constructive picture. The 10-period EMA at $64,650 and SMA at $64,816 both indicate Sell signals, while the 20-period EMA and SMA sit around $64,248 and $64,224, respectively.
The 50-period EMA is higher at $65,007, while the 100-period EMA is around $67,808 and the 200-period SMA is approximately $72,261. These levels show that Bitcoin remains below several important trend-following averages.
At the same time, the 30-period SMA near $63,108 and 50-period SMA near $63,167 are marked Buy, illustrating the mixed nature of the current structure.
Bitcoin Price Prediction: Can BTC Reclaim $64,850?
The immediate Bitcoin price prediction depends heavily on whether BTC can convert $64,850 from resistance into support.
A sustained move above the 50-day EMA and D-VWAP could improve the short-term technical picture and open the way toward higher resistance. However, Bitcoin would still face the $66,000-$67,200 region identified on the four-hour chart.
On the downside, $63,800-$64,000 is the first area to monitor, followed by $63,335 and the broader $63,100-$63,700 support zone. A deeper breakdown below $62,471 would invalidate the bullish setup outlined by ProfitPro669 and could bring $62,000 into focus.
The FOMC meeting could become the next major catalyst. The Federal Reserve is scheduled to meet on July 28-29, with its policy announcement and press conference on July 29. Recent Reuters reporting has highlighted a more uncertain rate outlook, with persistent inflation and higher oil prices complicating the policy debate.
For now, the technical evidence does not point to a clear directional breakout. RSI near 49 suggests balanced momentum, while the weak ADX reading indicates limited trend strength. Bitcoin's ability to reclaim $64,850 before the FOMC meeting may therefore determine whether the market enters the event with improving momentum or remains trapped in a narrow range.
The key levels are clear: $64,850 on the upside, $63,335 as a major support reference and $62,471 as a critical invalidation point for the current bullish setup. Until one of these areas breaks decisively, the Bitcoin price forecast remains mixed, with macroeconomic risk likely to influence the next significant move .