

AMZN
#5
Amazon.com, Inc. - Common Stock
256.9 7 USD
-0.01%
Market Price
Secteur: Consommateur Cyclique
Base: USD
Devise de Profit: USD
Range quotidien
Range Annuel
Changement quotidien
-0.60%
Changement Mensuel
-6.28%
Evolution sur 6 mois
+20.01%
Changement Annuel
+8.19%
Clôture Précédente
258.5 1
Open
256.9 5
Low
256.9 5
High
256.9 7
Volume
826
Financials
Valeur Q1, 25Q2, 25Q3, 25Q4, 25Q1, 26Q2, 26 TTM
Nouvelles
Amazon recrute des banques pour sa première émission d’obligations en livres sterling
Gary Black met en garde Tesla contre le risque de gaspiller son avance en matière d'autonomie, tout comme il l'a fait avec les véhicules électriques, et appelle à un budget de marketing de 100 millions de dollars pour le Cybercab - "L'objectif de la...
Évaluation de la performance d'Amazon.com par rapport à ses concurrents dans l'industrie de la vente au détail général | Benzinga France
Les États-Unis et l’Iran s’échangent des frappes ; Huang de Nvidia sur l’AGI
Un avion cargo d’Amazon s’écrase près de l’aéroport de Miami
Gary Black déclare que Tesla a résolu l'autonomie non supervisée, mais la concurrence est la plus grande menace | Benzinga France
Citi identifie les meilleures actions Gen AI à détenir d’ici 2027
Comprendre la position d'Amazon.com dans l'industrie de la vente au détail par rapport à ses concurrents | Benzinga France
La Corée du Sud obtient 2 milliards de dollars de 4 entreprises américaines alors que Trump intensifie la pression sur les fabricants de puces étrangers : GLW, APD, ACLS parmi les actions à surveiller | Benzinga France
Le ministère de la Justice américain demande des données sur les prix du bœuf à Amazon et Walmart
L'ARK Invest de Cathie Wood affirme qu'Amazon possède un potentiel de 1 billion de dollars dans le domaine de l'IA, caché à la vue de tous | Benzinga France
Graphique & Idées
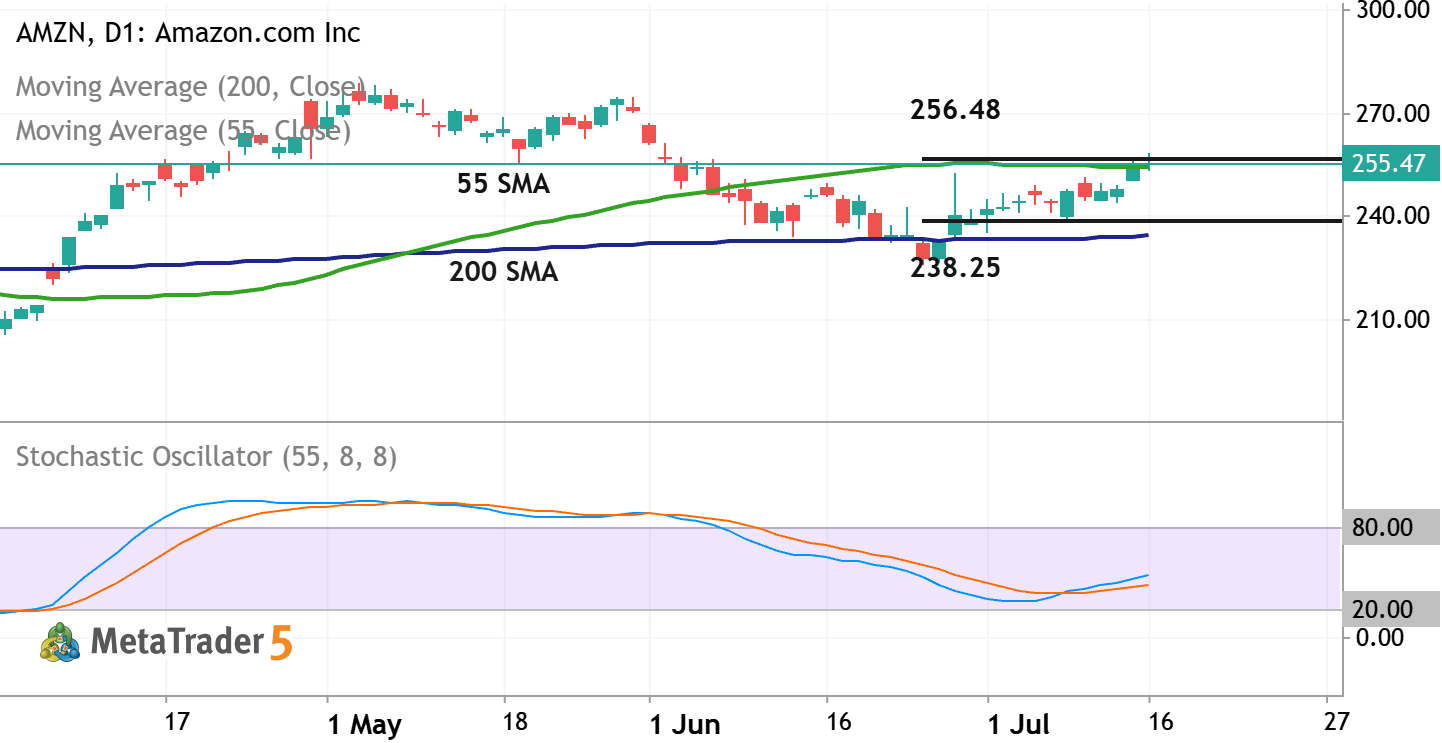
AMZN - Daily Trading Forecast
Daily price is located above 200 SMA in the bullish area of the chart. The Stochastic oscillator is showing the uptrend to be started by crossing the 50 level to above, and the price is trying to break the resistance level at 256.48 together with 55 SMA to above for the strong bullish trend to be continuing. If the price breaks resistance at 256.48 together with 55 SMA to above so the primary bullish market condition will be continuing for daily price. If the price crosses support level at 238.25 together with 200 SMA to below so the primary bearish reversal will be started. Alternatively, the price will be on secondary ranging above 200 SMA to be inside s/r levels waiting for direction of the strong trend tioo be started. Trading Summary : bullish ranging for direction.


The AMZN doesn’t have other trading ideas at this time
Browse ready-made trading ideas or select a symbol and create your own
Go to Charts and Trading Ideas