

NVDA
#1
NVIDIA Corporation - Common Stock
229.2 8 USD
-0.01%
Market Price
Secteur: Technologie
Base: USD
Devise de Profit: USD
Range quotidien
Range Annuel
Changement quotidien
-0.52%
Changement Mensuel
+8.62%
Evolution sur 6 mois
+23.26%
Changement Annuel
+21.98%
Clôture Précédente
230.4 8
Open
233.8 8
Low
229.1 1
High
233.8 9
Financials
2019
Current report, Q2 FY2019
NVIDIA CORP current report, Q2 FY2019
8-K
Current report, Q2 FY2019
NVIDIA CORP current report, Q2 FY2019
8-K
Quarterly report, Q1 FY2020
NVIDIA CORP quarterly report, Q1 FY2020
10-Q
Current report, Q1 FY2019
NVIDIA CORP current report, Q1 FY2019
8-K
Current report, Q1 FY2019
NVIDIA CORP current report, Q1 FY2019
8-K
Current report, Q1 FY2019
NVIDIA CORP current report, Q1 FY2019
8-K
Current report, Q1 FY2019
NVIDIA CORP current report, Q1 FY2019
8-K
Current report, Q1 FY2019
NVIDIA CORP current report, Q1 FY2019
8-K
Annual report, FY2019
NVIDIA CORP annual report, FY2019
10-K
2018
Current report, Q4 FY2018
NVIDIA CORP current report, Q4 FY2018
8-K
Nouvelles
Nvidia en discussions pour acquérir Reflection AI ou augmenter sa participation
UBS maintient son objectif de cours à 300$ pour Nvidia grâce aux données de Taïwan
Les contrats à terme du TSX progressent avant les données sur l’emploi et le recul du pétrole
Pourquoi l’action Lumentum s’envole-t-elle aujourd’hui ?
Dow Jones : l’indice résiste à la chute de la tech après le choc OpenAI
Les contrats à terme américains stables après la chute du NASDAQ liée à OpenAI
Nvidia prévoit d’investir dans d-Matrix, un concurrent dans les puces IA
Firmus Grid, soutenue par Nvidia, reporte son introduction en bourse en Australie
70 millions d’enfants viennent d’obtenir des comptes Trump. Le plus grand gagnant pourrait être State Street
Nvidia s’engage à investir 1 milliard $ dans la recherche scientifique américaine
Trump révèle une participation de 25 millions $ dans Meta et un investissement dans SpaceX
Graphique & Idées
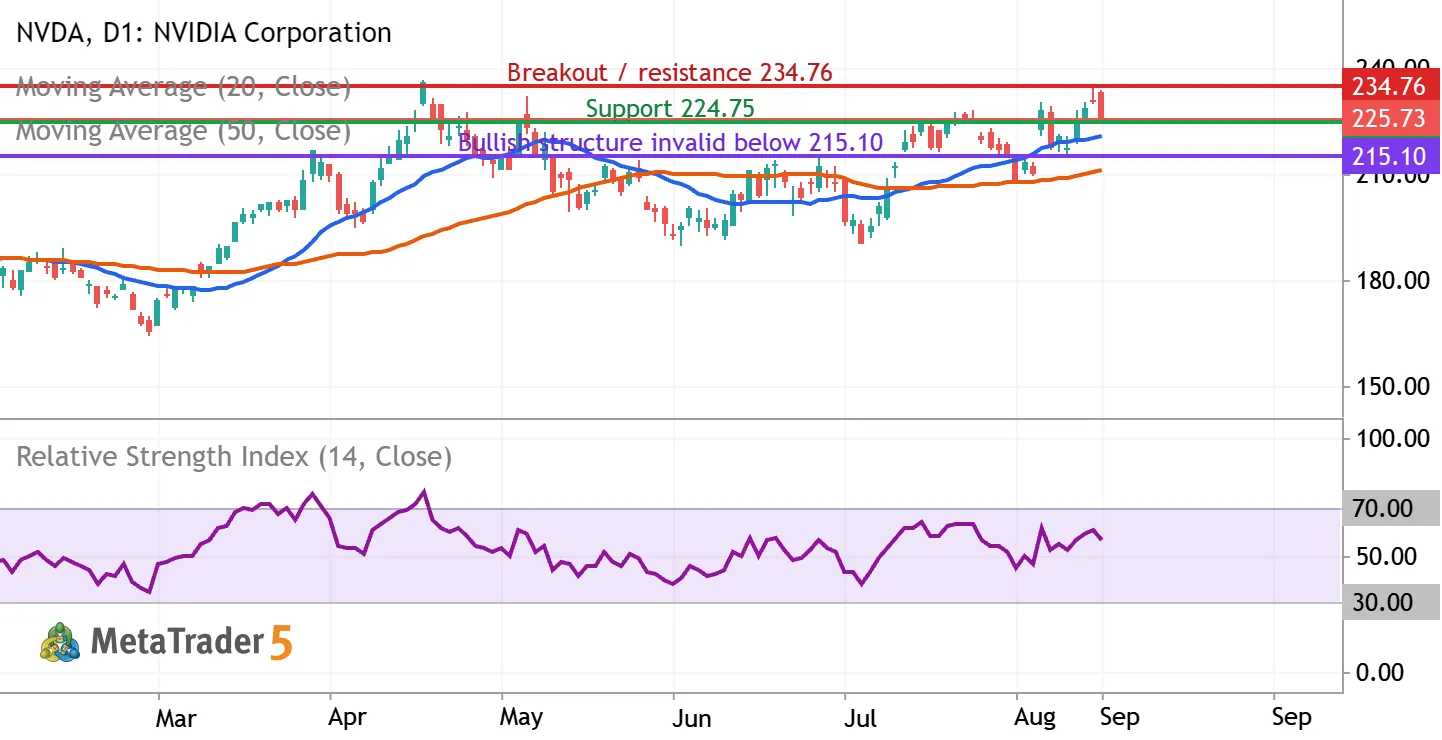
NVDA: testing $225 support as the uptrend meets $234.76 resistance
NVIDIA (NASDAQ: NVDA) | Daily chart | September 9, 2026 Bias: conditionally bullish over the next 2–6 weeks. Entry confirmation is still required. The latest completed regular session, September 8, closed at $225.73, down 2.01%, after reaching $233.71 intraday. The close near the session low signals selling pressure despite the broader recovery. What the indicators show The chart includes a blue 20-day simple moving average, an orange 50-day simple moving average, and purple RSI(14), all calculated from closing prices. At the latest completed candle, MetaTrader showed the averages near $220.48 and $211.22, with RSI near 56.19. Price remains above both rising averages, and the 20-day average is above the 50-day average. RSI above 50 supports positive momentum, but its reading below 70 is


The NVDA doesn’t have other trading ideas at this time
Browse ready-made trading ideas or select a symbol and create your own
Go to Charts and Trading Ideas