

NVDA
#1
NVIDIA Corporation - Common Stock
229.2 8 USD
-0.01%
Market Price
Setor: Tecnologia
Base: USD
Moeda do lucro: USD
Faixa diária
Faixa anual
Mudança diária
-0.52%
Mudança mensal
+8.62%
Mudança em 6 meses
+23.26%
Mudança anual
+21.98%
Fechamento anterior
230.4 8
Open
233.8 8
Mínimo
229.1 1
Máximo
233.8 9
Financials
2026
Current report, 02 Sep 2026
NVIDIA CORP current report, 02 September 2026
8-K
Current report, 26 Aug 2026
NVIDIA CORP current report, 26 August 2026
8-K
Current report, 17 Aug 2026
NVIDIA CORP current report, 17 August 2026
8-K
Quarterly report, Q2 FY2027
NVIDIA CORP quarterly report, Q2 FY2027
10-Q
Institutional holdings, Q2 FY2026
NVIDIA CORP institutional holdings, Q2 FY2026
13F-HR
INFORMATION TABLE, Q2 FY2026
NVIDIA CORP INFORMATION TABLE, Q2 FY2026
INFORMATION TABLE
Current report, Q2 FY2026
NVIDIA CORP current report, Q2 FY2026
8-K
Current report, Q2 FY2026
NVIDIA CORP current report, Q2 FY2026
8-K
Current report, Q2 FY2026
NVIDIA CORP current report, Q2 FY2026
8-K
Current report, Q2 FY2026
NVIDIA CORP current report, Q2 FY2026
8-K
Notícias
Startup de chips Nuvacore busca avaliação de US$ 2,5 bilhões em rodada de captação
Wall Street fecha em alta com medida sobre diesel e tech
Wall Street segue em alta; acordo da SpaceX pesa sobre setor de telecomunicações
UBS mantém preço-alvo de US$ 300 para Nvidia com base em dados de Taiwan
Wall Street sobe com recuperação tech e petróleo
Futuros do TSX sobem levemente antes de dados de emprego e queda do petróleo
Citi vê avanço dos modelos de IA superando infraestrutura de data centers
Ações da Lumentum disparam com demanda por componentes de IA
Futuros das bolsas americanas estáveis após queda do NASDAQ por preocupações com receita da OpenAI
Nvidia planeja investir na d-Matrix, rival no mercado de chips de IA
E.U.A. - Ações fecharam o pregão inalteradas e o Índice Dow Jones Industrial Average avançou 0,10%
Gráficos e ideias
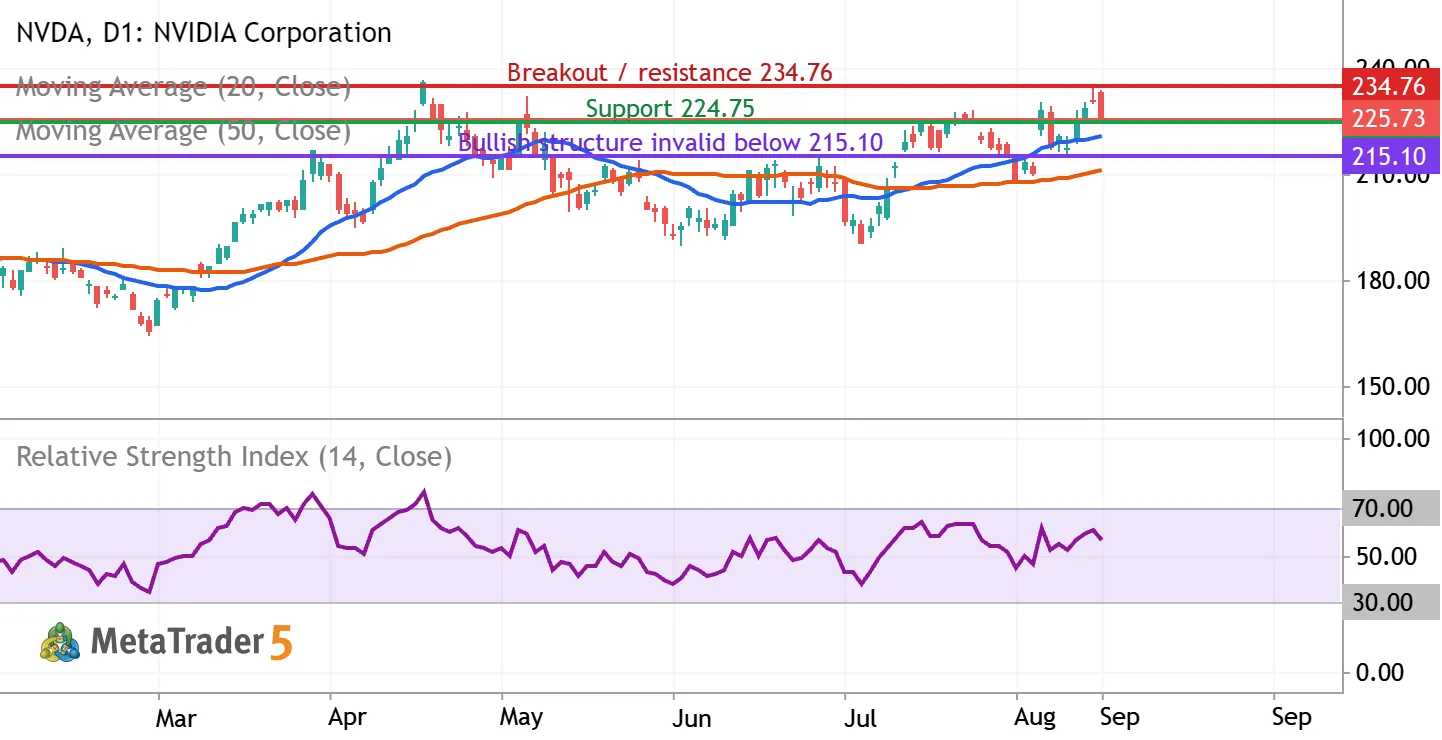
NVDA: testing $225 support as the uptrend meets $234.76 resistance
NVIDIA (NASDAQ: NVDA) | Daily chart | September 9, 2026 Bias: conditionally bullish over the next 2–6 weeks. Entry confirmation is still required. The latest completed regular session, September 8, closed at $225.73, down 2.01%, after reaching $233.71 intraday. The close near the session low signals selling pressure despite the broader recovery. What the indicators show The chart includes a blue 20-day simple moving average, an orange 50-day simple moving average, and purple RSI(14), all calculated from closing prices. At the latest completed candle, MetaTrader showed the averages near $220.48 and $211.22, with RSI near 56.19. Price remains above both rising averages, and the 20-day average is above the 50-day average. RSI above 50 supports positive momentum, but its reading below 70 is


The NVDA doesn’t have other trading ideas at this time
Browse ready-made trading ideas or select a symbol and create your own
Go to Charts and Trading Ideas