Mr_Analysis_Pro

Mr Sagar Kalwar

Pakistan

Graphiques et Idées

XAUUSD (Gold) – M15 Chart Analysis Summary XAUUSD Gold vs US Dollar
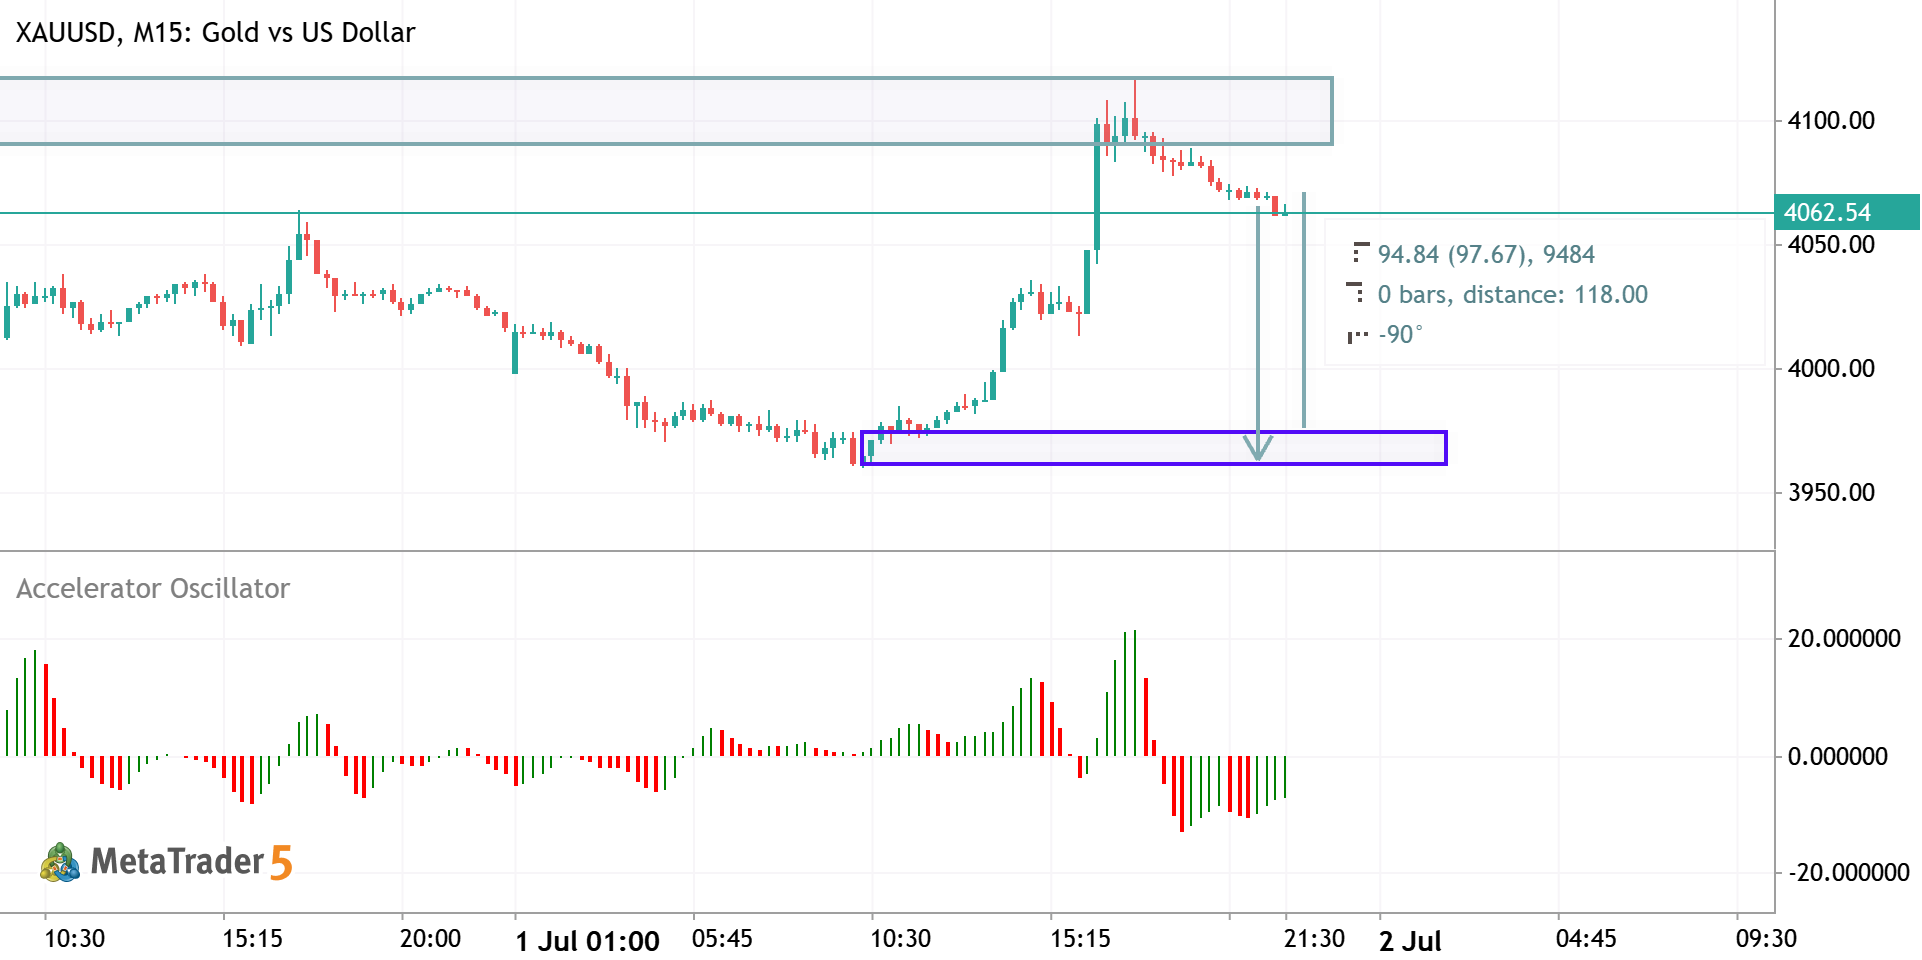
XAUUSD (Gold) – M15 Chart Analysis Summary
From the chart, the market structure is still bullish overall , but the short-term momentum is weakening after a strong impulsive rally. Market Structure Gold made a strong bullish breakout , pushing price from around 3965 to above 4090 , confirming aggressive buying. After reaching the highs near 4105–4110 , price has entered a pullback/consolidation phase. The current candles show lower highs, indicating that buyers are taking profits and sellers are gaining some short-term control. Key Levels Resistance: 4088–4110 (highlighted supply zone) This is where sellers stepped in after the breakout. Current Price: Around 4065 Major Support: 3960–3970 (blue demand zone) This is the last strong accumulation area before the rally. It is also the area where buyers are most likely to defend the
2026.07.01 18:42 0
XAUUSD M15 Analysis. XAUUSD Gold vs US Dollar
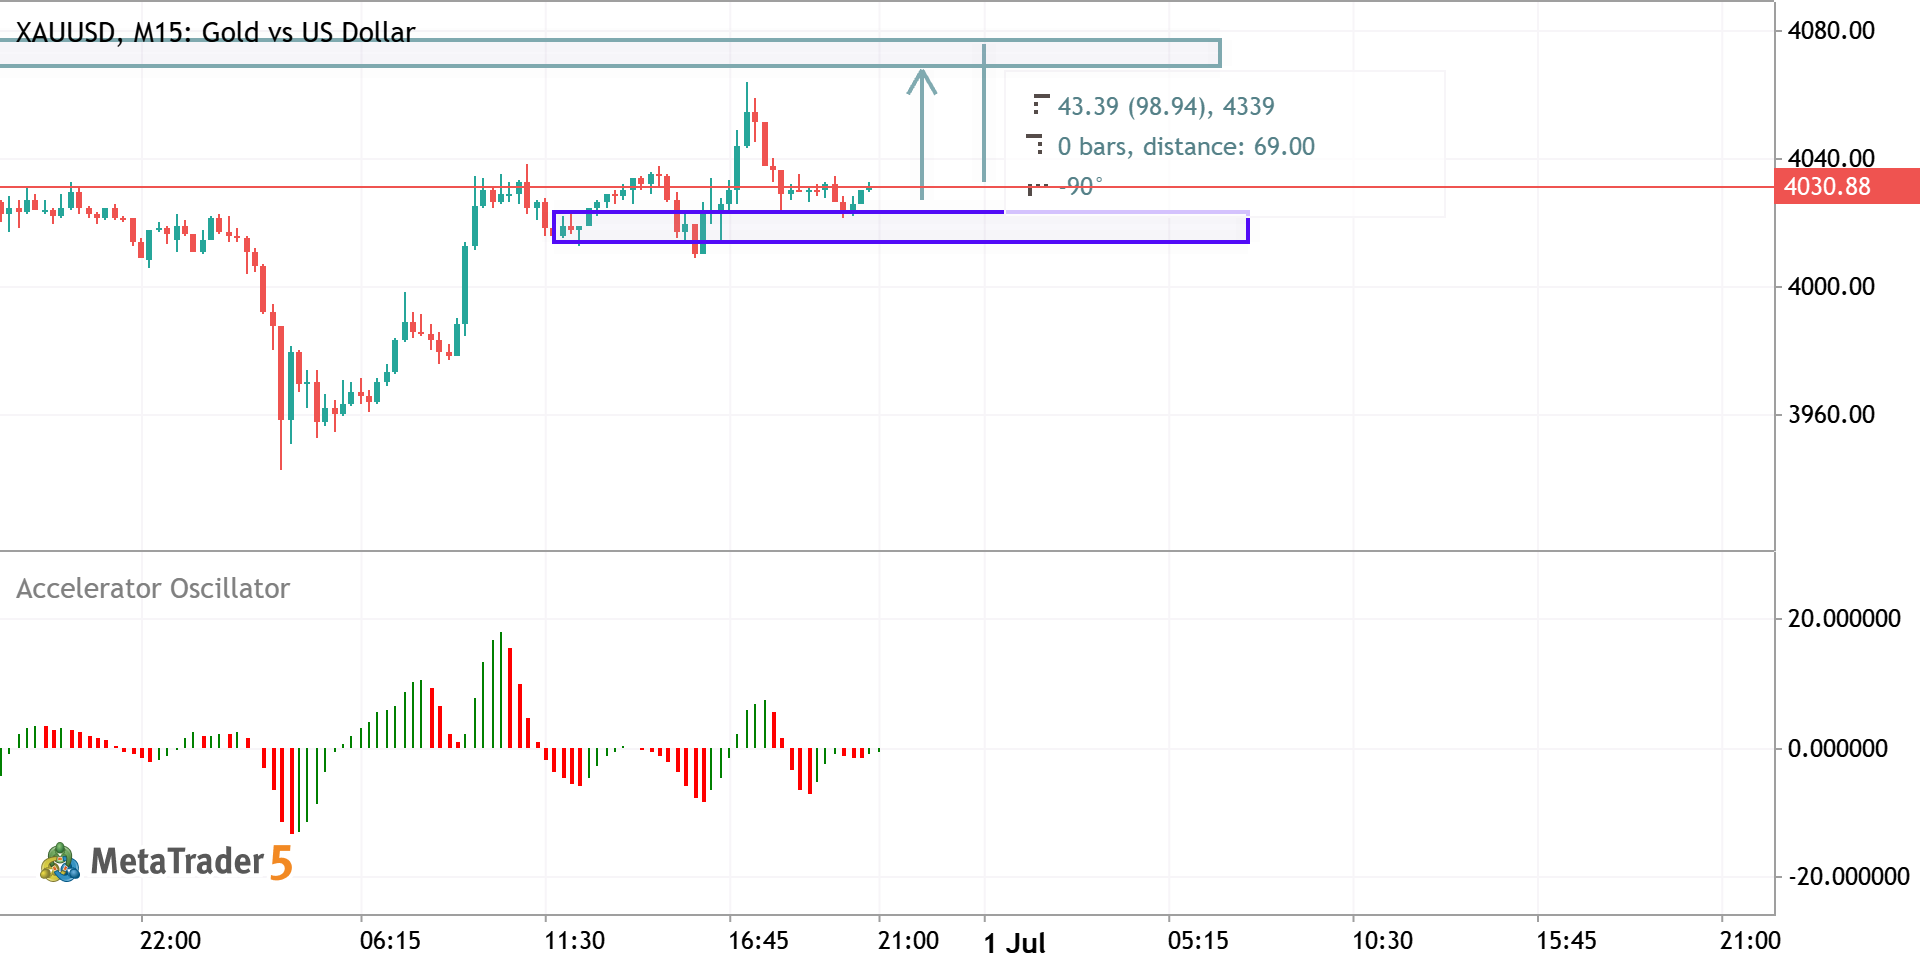
XAUUSD M15 Analysis.
Gold is currently holding above a key demand zone around 4015–4023 , where buyers have repeatedly defended price. The recent rejection from this area suggests bullish momentum remains intact as long as support continues to hold. Price is now consolidating just below the 4030 resistance. A successful breakout and close above this level could trigger the next leg higher toward 4065 , with an extended target near 4075–4078 , matching the previous swing high. Bullish Scenario Entry: Buy on a pullback into 4018–4023 or after a confirmed breakout above 4030 . Targets: TP1: 4048–4055 TP2: 4065 TP3: 4075–4078 Invalidation: A 15-minute candle closing below 4015 would weaken the bullish outlook and increase the risk of a move toward 4005 or lower. Key Levels Support: 4015–4023 (Demand Zone)
2026.06.30 18:01 0