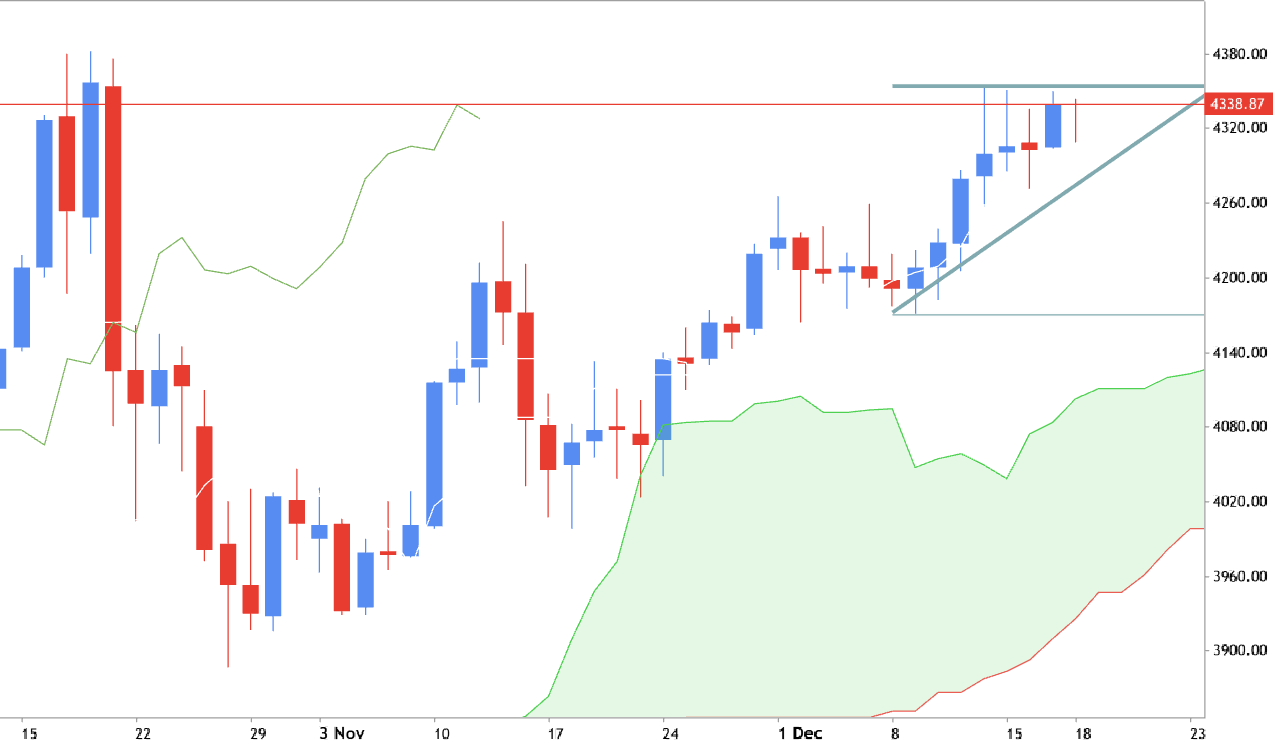
Daily price is located far above Ichimoku cloud in the bullish area of the chart. Chinkou Span line of Ichimoku indicator crossed the historical data to above for the good strong daily breakout. For now - the price is testing the bullish triangle pattern to above with the resistance level at 4353.6 for the trend to be continuing. Alternatively, if the price breaks support at 4169.7 to below so the secondary correction within the primary bullish trend will be started. Otherwise, the price will be inside s/r channel waiting for direction. Recommendation: watch the price to be crossed the resistance level for possible buy trade.
As we see from the chart - the Chinkou Span line broke historical price to above for good breakout (and the price crossed the resistance level at 4353.6). Daily breakout. Next target is 4552.3

Nuovo commento
As we see - the resistance level was broken on the close bar so the bullish trend will be continuing
As we see from the chart - the Chinkou Span line broke historical price to above for good breakout (and the price crossed the resistance level at 4353.6). Daily breakout. Next target is 4552.3