
While technical indicators remain mixed overall, Zcash has formed strong support zones alongside bullish moving-average signals and a developing breakout setup, placing the privacy-focused cryptocurrency back on traders’ watchlists.
The latest market data shows ZEC trading in the mid-$400 range, significantly above key support levels that helped fuel its recent rebound. As investors assess whether the recovery can continue, attention is increasingly shifting toward resistance levels that may determine the next major move.
Zcash Price Holds Key Support Following Rounded Bottom Formation
Market analyst Karman highlighted a notable development on the ZEC chart, arguing that the cryptocurrency has completed a rounded bottom pattern after months of consolidation and recovery.
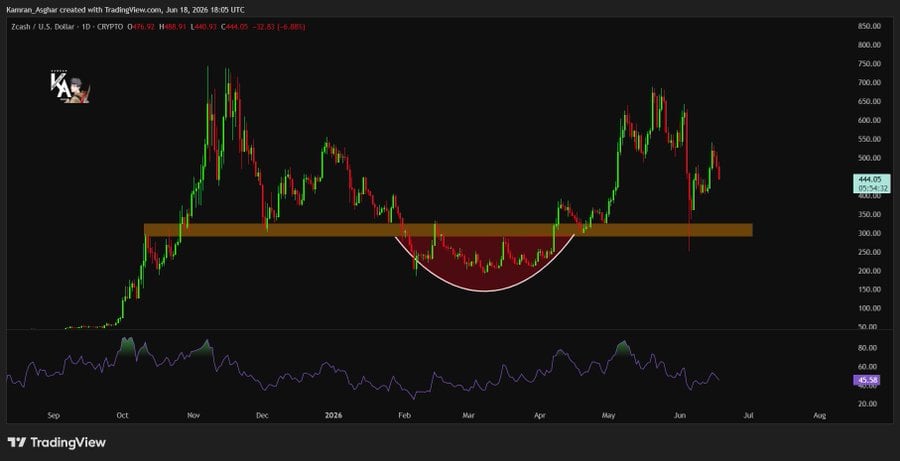
Zcash (ZEC) has completed a rounded bottom pattern and remains above the critical $350 support level, signaling the potential for further upside if buyers maintain control. Source: 𝐊𝐚𝐦𝐫𝐚𝐧 𝐀𝐬𝐠𝐡𝐚𝐫 via X
According to the analysis, ZEC formed a U-shaped structure during the first half of 2026 before climbing back toward the $440 region. The pattern emerged after a prolonged decline from highs near $800 reached in 2025, suggesting that selling pressure may have gradually weakened over time.
A crucial aspect of the setup is the support zone around $350. The analyst noted that maintaining this level could preserve the bullish structure and potentially provide a foundation for additional gains.
The chart shared on June 18 showed ZEC trading near $444, with volume and momentum indicators reflecting improving market conditions. While the pattern has attracted bullish attention, some traders have emphasized that stronger volume participation would be needed to confirm a sustained breakout.
The discussion comes as ZEC continues to trade within a broad 2026 forecast range cited by market participants, with estimates spanning approximately $280 to $850 depending on broader market conditions and trend confirmation.
ZEC Faces Major Resistance as Breakout Traders Watch Closely
Another technical perspective shared by CryptoYoda focuses on a long-term descending trendline that has capped price advances since previous highs.
The analyst observed that ZEC recently rebounded from a significant horizontal demand zone between $290 and $310 before climbing back into the $460-$470 area. The recovery has brought the asset directly beneath a descending resistance line that has acted as a barrier throughout much of the broader correction.
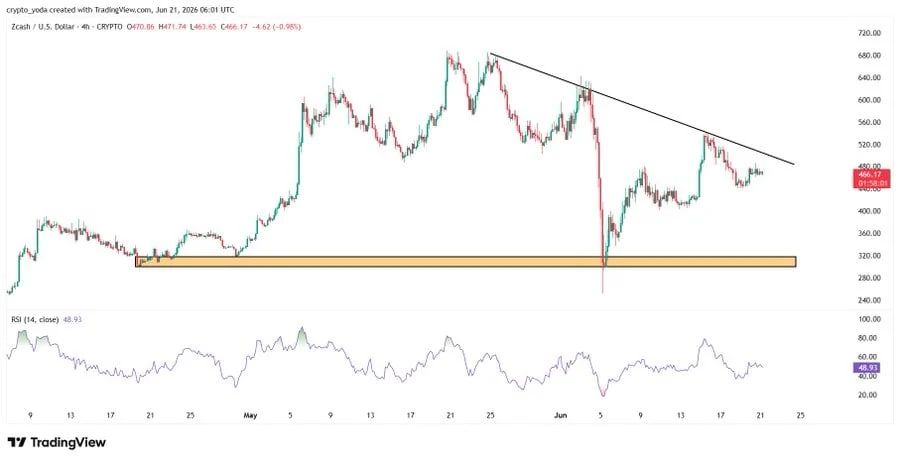
$ZEC is testing a long-term descending resistance while holding firm above the key $290–$310 demand zone, with a breakout potentially paving the way for further gains. Source: @_CryptoYoda via X
On the four-hour chart, the setup appears balanced. The Relative Strength Index (RSI) was reported near 49, reflecting neutral momentum conditions rather than an overbought or oversold market.
From a technical standpoint, a decisive move above the descending trendline could strengthen the bullish case and open the door for further upside. However, traders remain cautious as resistance levels established during the previous downtrend continue to influence market behavior.
The analyst suggested that maintaining support above the lower demand zone remains essential for preserving the current recovery structure.
Moving Averages Continue to Support the Bullish Outlook
Additional analysis from CryptDollar highlighted the importance of short-term trend indicators as ZEC consolidates near recent highs.
The trader noted that price action has been testing trendlines and a key Fibonacci "golden pocket" retracement area while finding support near the 8-period and 20-period moving averages around the $470 region.
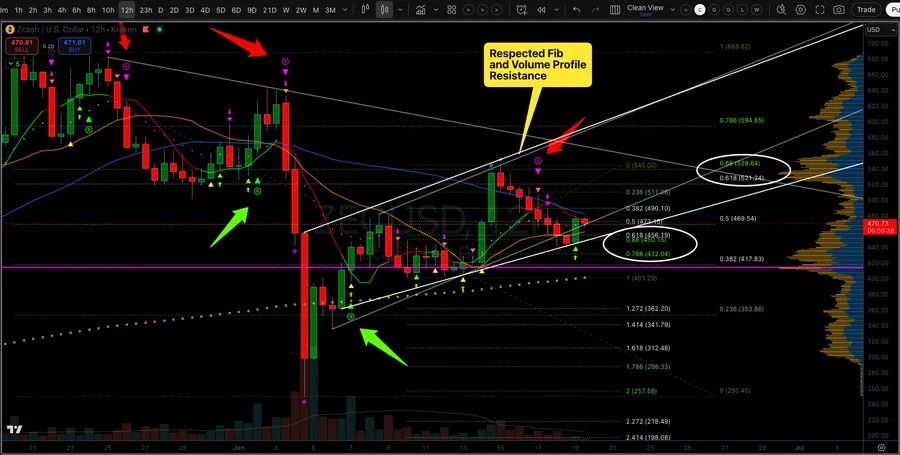
A 12-hour Zcash chart shows price testing key trendlines and the Fibonacci golden pocket while finding support at the 8-period and 20-period moving averages, signaling resilience in the current uptrend. Source: @CryptDollar via X
According to the analysis, the bullish scenario remains intact as long as ZEC continues to hold above the 50-period moving average and respects underlying trend support. The chart also references volume-profile resistance and Fibonacci retracement levels that have historically influenced price action.
At the same time, the analyst warned that a breakdown from the current structure could create a bear-flag scenario, potentially exposing ZEC to a pullback toward the $400-$420 range.
Such a move would not necessarily invalidate the broader recovery trend but could delay any attempt to challenge higher resistance levels .
TradingView Indicators Show Neutral but Improving Momentum
Broader technical data from TradingView presents a more balanced picture of the market.
The overall technical summary for the ZEC/USDT trading pair currently carries a neutral rating, reflecting a lack of strong consensus among major indicators. Oscillators, including momentum-based tools such as RSI, Stochastic indicators, CCI, MACD, and Williams %R, remain largely neutral.
This suggests that ZEC is neither significantly overbought nor oversold at current levels.
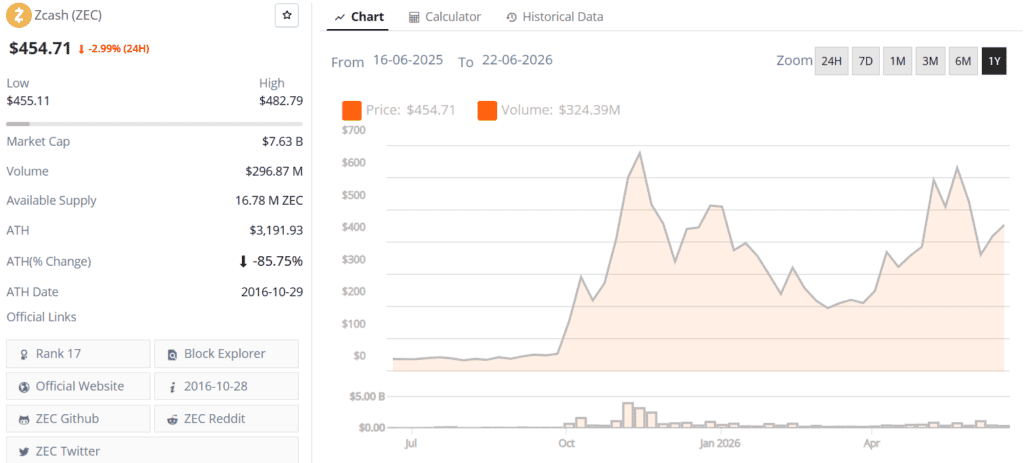
Zcash (ZEC) price chart. Source: Brave New Coin
However, moving averages continue to lean bullish. Short-term and medium-term technical summaries, including one-week and one-month outlooks, maintain buy signals, indicating that the broader trend still favors buyers despite recent consolidation.
Technical analysts often view this combination of neutral oscillators and bullish moving averages as a transitional phase. Markets frequently enter consolidation periods before establishing a clearer directional trend, particularly after strong recoveries from major support zones.
What Could Drive the Next Zcash Price Move?
The next phase for Zcash price prediction models may depend on whether bulls can convert current resistance into support.
A successful breakout above the descending trendline identified by analysts would likely strengthen confidence in the recovery and potentially shift attention toward higher resistance areas that have remained untouched since the 2025 decline.
Conversely, failure to break resistance could lead to additional consolidation or retests of lower support levels, particularly around the $400 region and, more importantly, the broader $350 support zone that underpins the rounded bottom structure.
For now, technical indicators suggest that ZEC remains in a recovery phase with cautiously bullish characteristics. While the path toward previous highs near $800 would require multiple resistance levels to be cleared, analysts agree that maintaining k ey support levels remains the most important factor for preserving the cryptocurrency's improving market structure.