
Related tickers
| # | Nome | Prezzo | 24h % | 7d % | 1M % | 1Y % | Ultimi 7 Giorni | |
|---|---|---|---|---|---|---|---|---|
| 1 | LTCUSD Litecoin vs US Dollar | 59.10 USD | -3.10% | -8.06% | +1.32% | -36.16% | ||
| 2 | ETHUSD Ethereum vs US Dollar | 2414.75 USD | -1.08% | -4.81% | -8.31% | -39.54% | ||
| 3 | MBTUSD milliBitcoin vs US Dollar | 81.604 USD | -0.61% | -2.33% | +0.80% | -24.93% | ||
| 4 | ETCUSD Ethereum Classic vs US Dollar | 7.856 USD | -1.39% | -7.13% | -7.12% | -50.57% |
Notizie
Il rating “junk” di Anthropic accende un dibattito ancora più ampio su Bitcoin
Strategy verso l’uscita dagli indici Msci: in gioco miliardi di investimenti passivi
I wallet delle balene Bitcoin raggiungono un record mentre aumentano le posizioni short, cosa succederà ora?
Bitcoin recupera a $82.000 ma si avvia verso la seconda settimana in rosso
Google affronta un ostacolo chiave nel settore quantistico, ecco cosa significa per Bitcoin
Binance.US punta a raccogliere 100 milioni di dollari con una valutazione di 1 miliardo
Arthur Hayes scommette su cosa arriverà dopo il crollo dell’IA
Bitcoin scende verso 80.000 dollari dopo un CPI superiore alle attese, le balene manterranno quanto accumulato?
Bitcoin scende sotto $81k: dati CPI caldi alimentano scommesse sui rialzi
Le liquidazioni crypto sfiorano 1 miliardo di dollari, con le posizioni long che subiscono la maggior parte delle perdite
XRP sta perdendo la Corea? Approfondimenti dai dati di Chainalysis e Upbit
Grafici & Idee
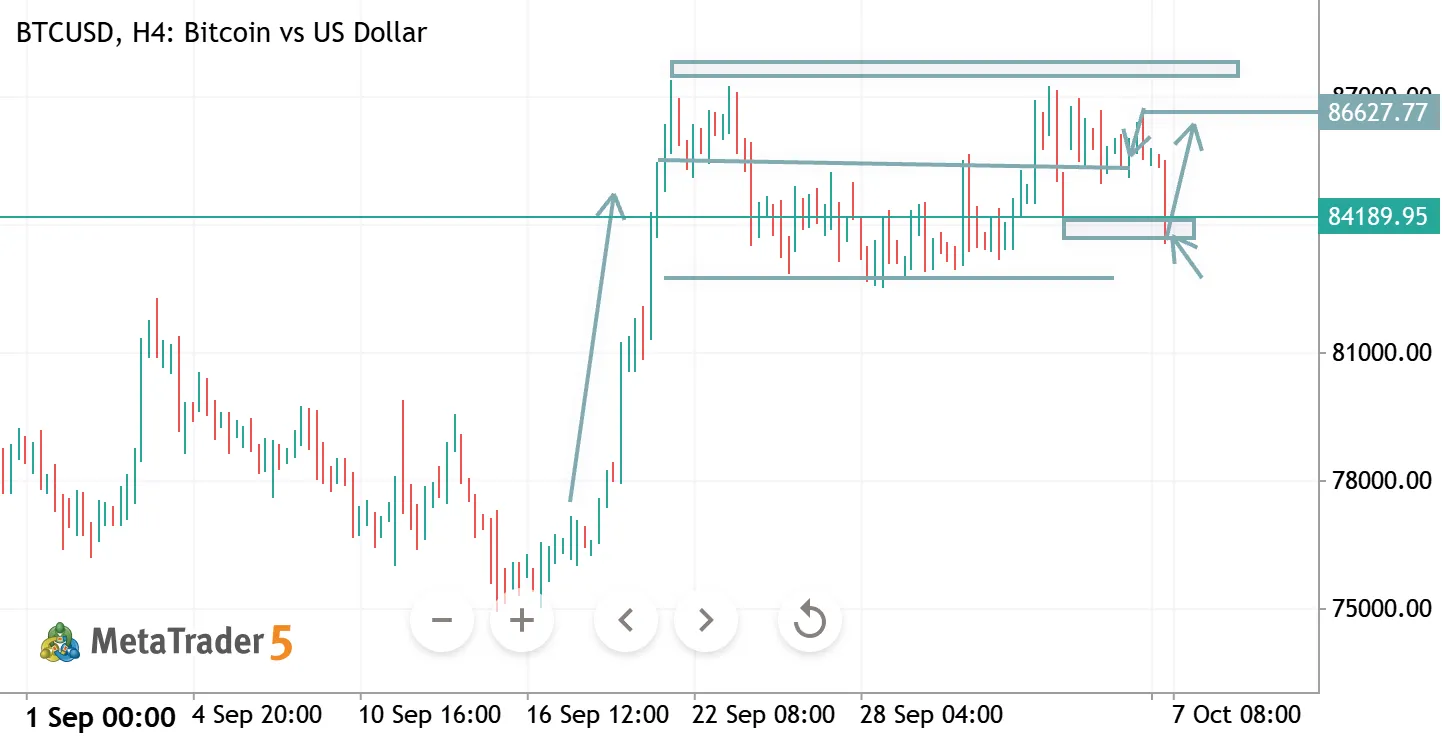
BTCUSD H4 ANALYSIS
BTCUSD H4 Analysis
BTC is consolidating near 84,100 after a strong recovery. The 84,000–84,500 zone is key support; holding above it could push price back toward 86,700–88,000.
🔹 Support: 84,000–84,500 🔹 Resistance: 86,700–88,000 🔹 Bias: Bullish above 84,000 🔹 Key Trigger: Break above 86,700 → upside continuation.

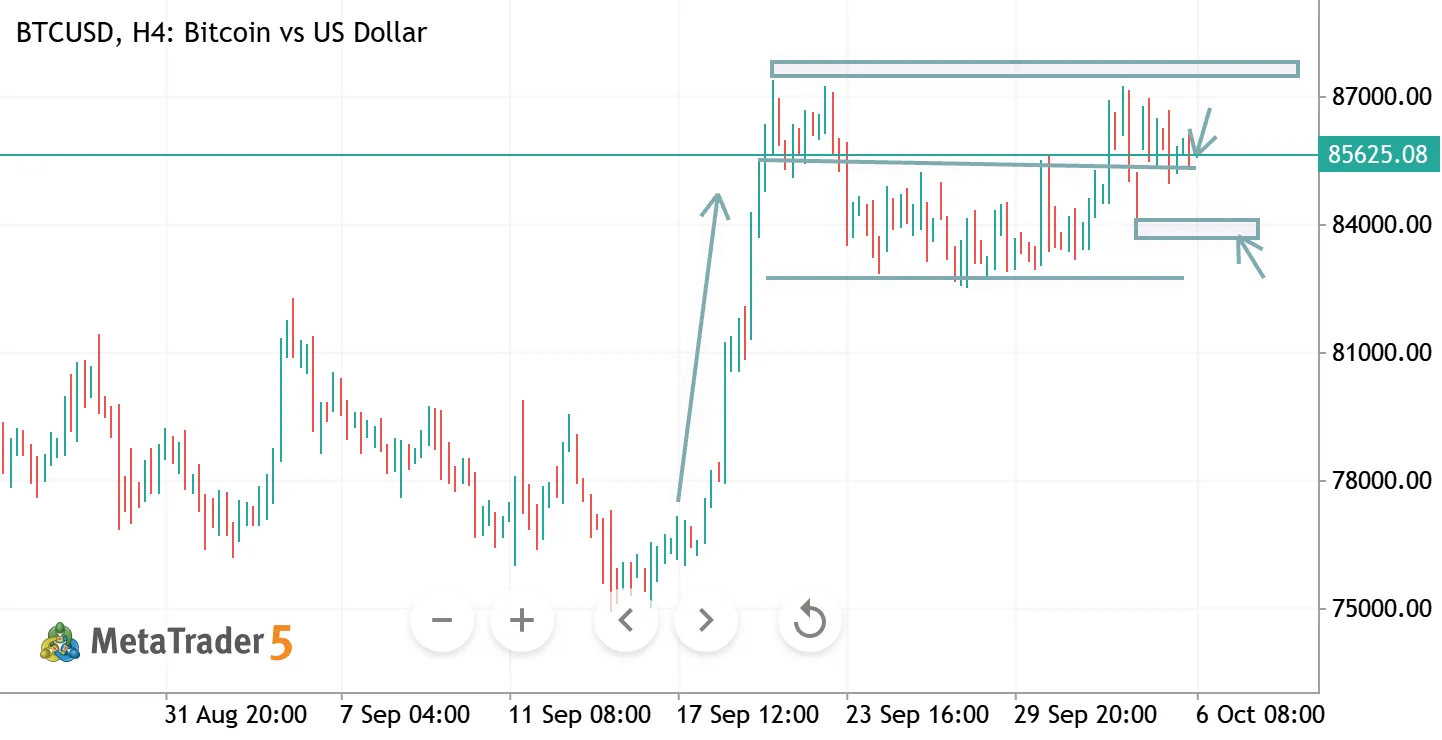
BTCUSD H4 ANALYSIS
BTCUSD H4 Analysis
BTC is consolidating below the 86,000–87,000 resistance zone after a strong recovery. A breakout above this area could resume the bullish move toward 88,000, while rejection may pull price back toward 84,000–82,500.
🔹 Resistance: 86,000–87,000 🔹 Support: 84,000–82,500 🔹 Bias: Bullish above 84,000 🔹 Key Trigger: H4 close above 87,000 → upside continuation.
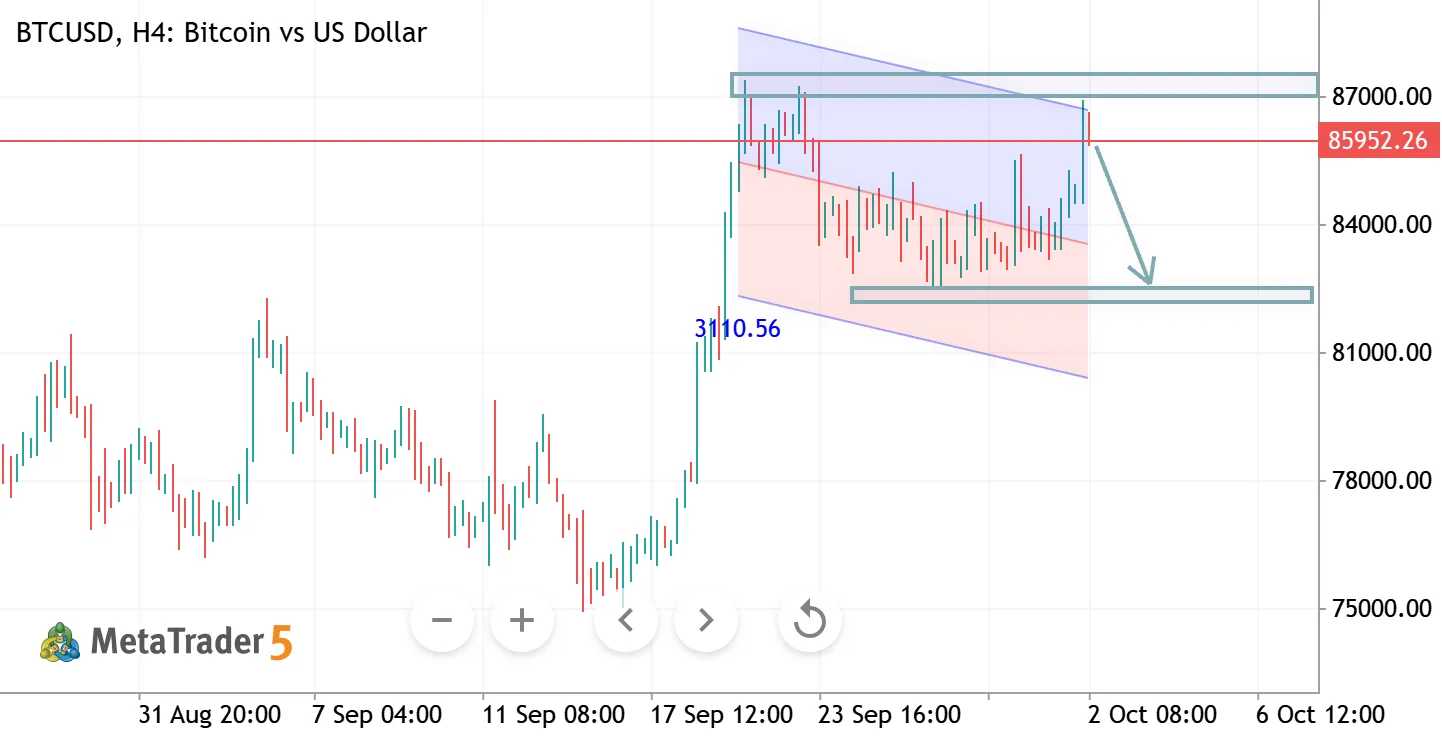
BTCUSD H4 ANALYSIS
BTCUSD H4 Analysis Bitcoin is testing a major resistance zone around 85,800–86,500 after a strong recovery. Rejection here could trigger a pullback toward the 82,000 support zone. 🔹 Resistance: 85,800–86,500 🔹 Support: 82,000–82,500 🔹 Bias: Bearish below 86,500 🔹 Key Trigger: Break above 86,500 → bullish continuation; rejection → downside toward 82,000.
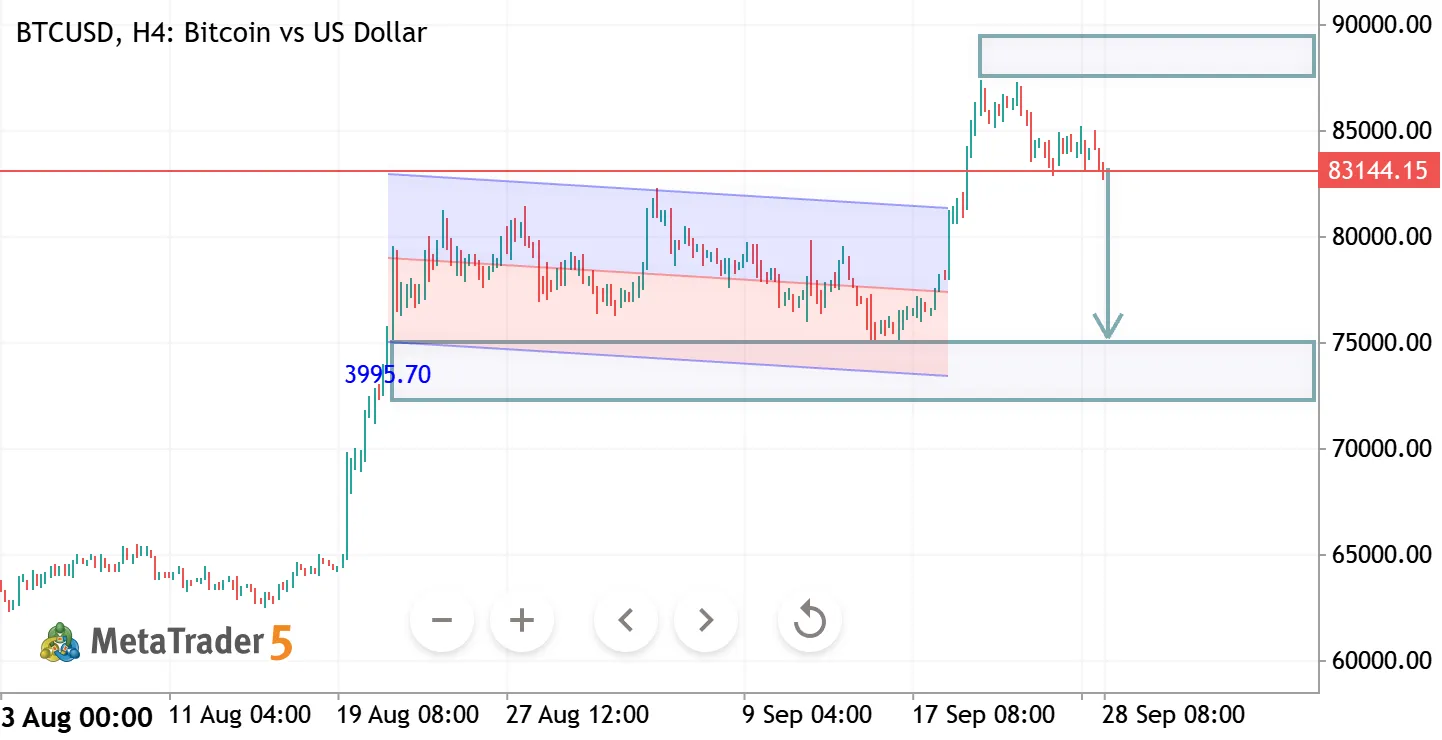
BTCUSD H4 ANALYSIS
GBPUSD – Technical Analysis 📊
GBPUSD is showing signs of a potential bullish reversal after moving within a descending channel. Price is holding around 1.3230, with the chart indicating a possible move toward the 1.3380–1.3400 resistance zone.
🔹 Support: 1.3200–1.3230 🔹 Target Zone: 1.3380–1.3400 🔹 Key Level: Sustained strength above 1.3260 would support the bullish setup.
Disclaimer: Technical analysis is based on chart structure and is not financial advice.
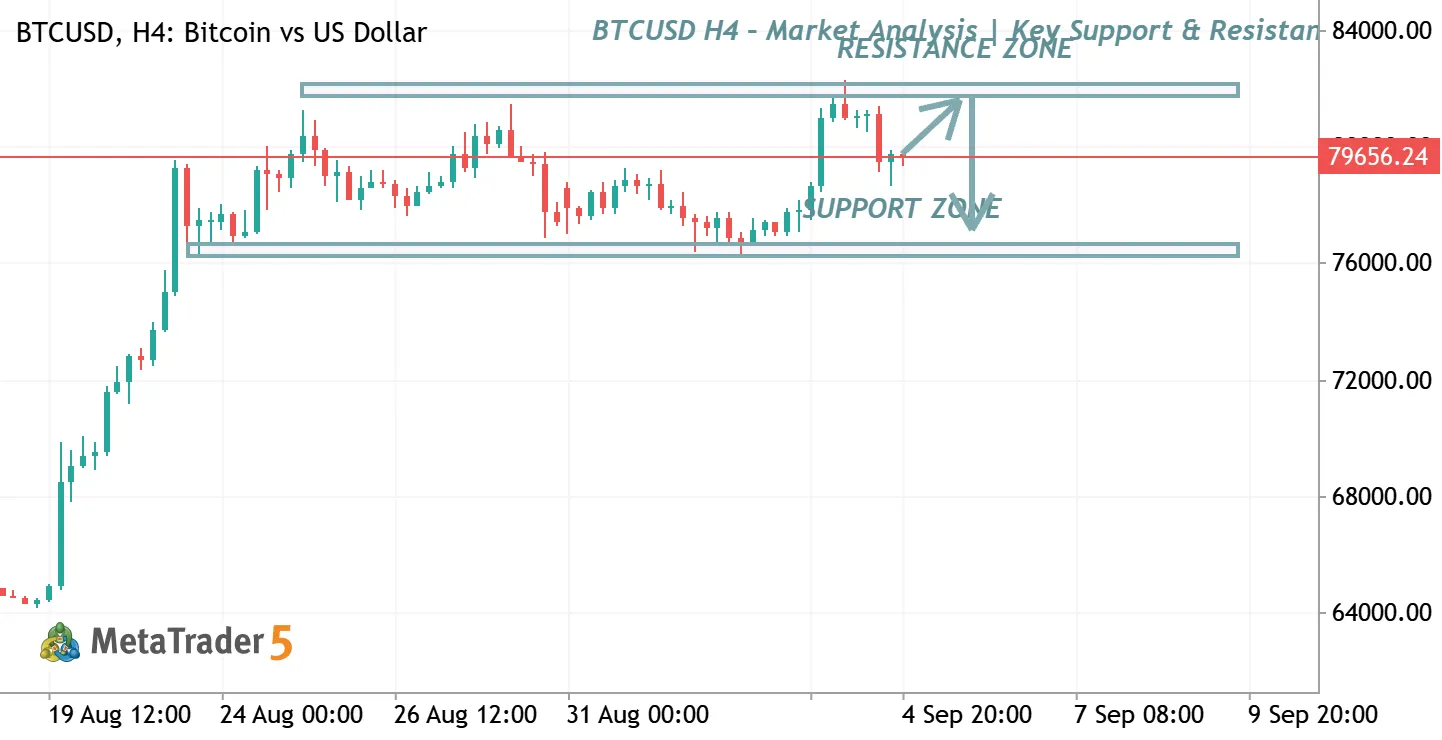
BTCUSD H4 – Market Analysis | Key Support & Resistance
BTCUSD is currently trading between important support and resistance zones on the H4 timeframe. Price is approaching a critical area where traders should watch for confirmation of either a bullish breakout toward the resistance zone or a bearish rejection toward support . 📈 Bullish Scenario: Break and hold above resistance may open the way for further upside.
📉 Bearish Scenario: Rejection from resistance could lead price back toward the major support zone. ⚠️ Trade with proper risk management and wait for confirmation before entering

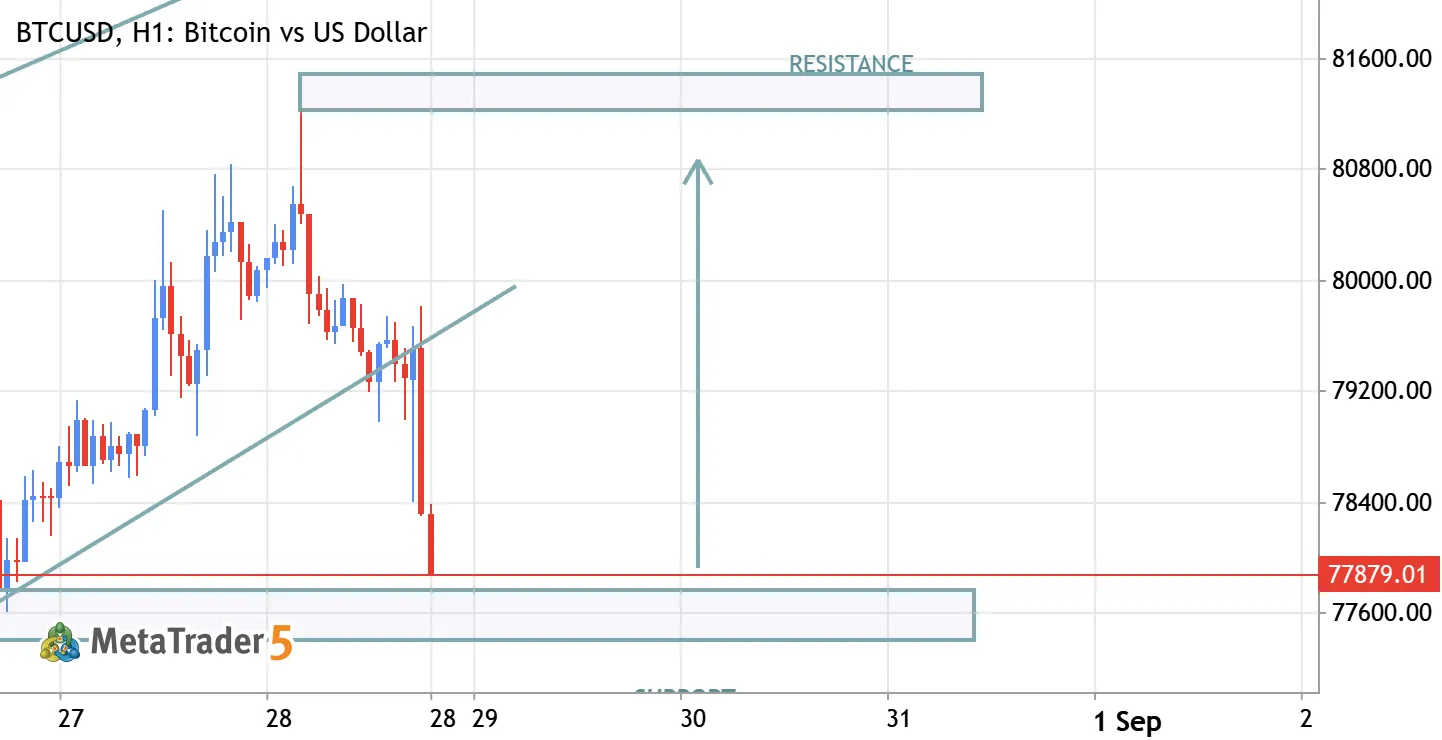
BTCUSD BULLISH TREND AFTER SUPPORT
BTCUSD BULLISH FROM SUPPORT TARGETS 81600


The BTCUSD doesn’t have other trading ideas at this time
Browse ready-made trading ideas or select a symbol and create your own
Go to Charts and Trading Ideas