
The Bitcoin price today sits around $64,000, a zone that has become increasingly important for short-term market direction. At the same time, MicroStrategy Executive Chairman Michael Saylor is highlighting the remarkable transformation of the company's Bitcoin strategy—from financial stress during the 2022 bear market to a multibillion-dollar BTC treasury that ranks among the largest in the world.
Michael Saylor Reflects on MicroStrategy’s Bitcoin Turnaround
Saylor recently revisited a keynote speech from 2022, when Bitcoin traded near $20,000, and MicroStrategy was facing approximately $300 million in negative equity. At the time, many critics questioned the company's aggressive commitment to Bitcoin BTC as a treasury reserve asset.

Michael Saylor highlighted MicroStrategy’s transformation from a $300 million negative equity position in 2022 to holding over 846,000 BTC with reserves exceeding debt. Source: Michael Saylor via X
Fast forward to 2026, and the picture looks dramatically different.
According to data shared by Saylor, MicroStrategy now holds 846,842 BTC acquired through 112 separate purchase events. The firm's Bitcoin reserve is valued at roughly $54.32 billion, while its holdings exceed the company's outstanding debt.
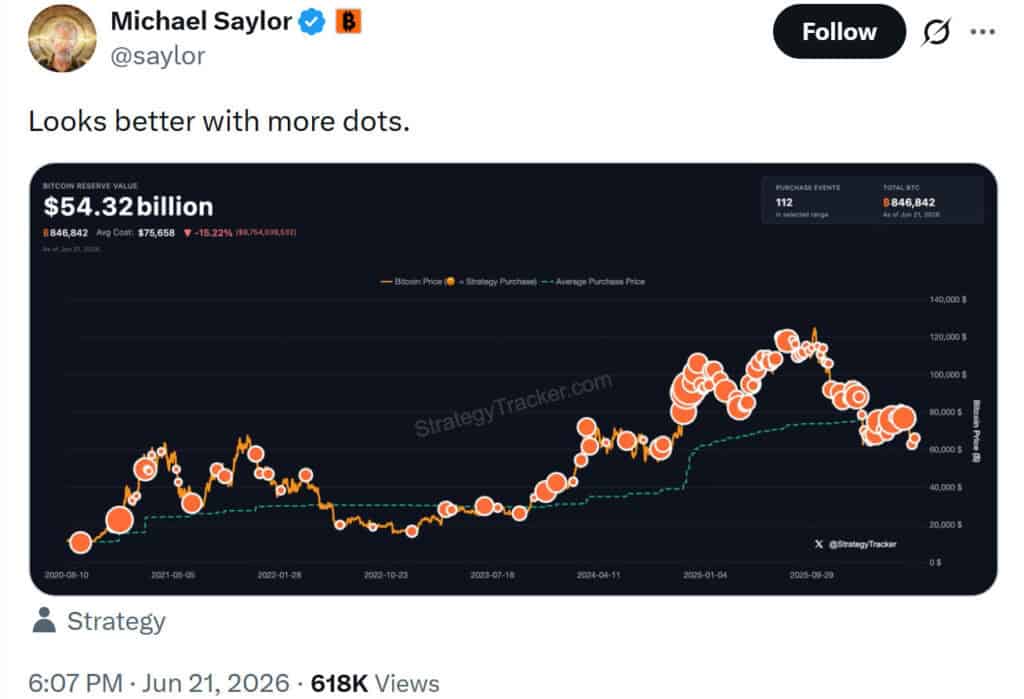
Michael Saylor revealed that MicroStrategy now holds 846,842 BTC worth approximately $54.32 billion, highlighting continued accumulation through 112 purchase events. Source: Michael Saylor via X
The update reinforces Saylor's long-standing belief that Bitcoin represents a superior long-term store of value. His latest post, accompanied by the phrase “more dots,” showcased additional purchases on the firm's long-term accumulation chart, highlighting continued buying despite market volatility.
The company’s average acquisition cost currently stands at approximately $75,658 per Bitcoin, placing a large portion of its holdings above the current market price. Nevertheless, Saylor has repeatedly argued that his strategy is designed around long-term adoption rather than short-term price fluctuations.
Bitcoin Price Today Approaches a Critical Technical Level
While Saylor focuses on long-term accumulation, traders are watching a much more immediate battle unfolding on the charts.
The BTC price recently faced strong rejection near the $67,200 resistance zone before entering a short-term downtrend characterized by lower highs and lower lows. A descending trendline has emerged as the primary technical obstacle for bulls.
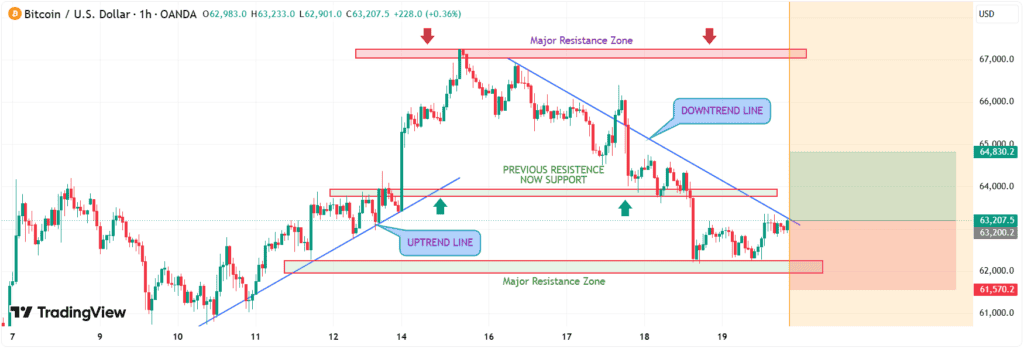
Bitcoin is approaching a critical decision point, with a break above the descending trendline potentially signaling a bullish recovery, while continued rejection below $64,000 could keep bearish pressure intact. Source: Goldex_Signals1 on TradingView
One of the most important levels remains the $63,700-$64,000 area. This zone previously acted as resistance before flipping into support. However, repeated testing eventually led to a breakdown below the range, reinforcing near-term bearish sentiment.
Despite that weakness, buyers have defended the $62,000 support level aggressively. Recent price action shows demand returning around this area, preventing a deeper decline and keeping hopes of a recovery alive.
For a bullish shift in market structure, Bitcoin would need to reclaim $64,000 and establish support above the descending trendline. Such a move could expose higher resistance levels at $64,800, $65,500, and potentially $66,400.
Conversely, failure to hold support could bring another test of $62,000. An hourly close below that level would likely strengthen bearish momentum and increase the probability of a move toward lower liquidity zones.
Bitcoin Technical Indicators Show Mixed Signals
Current technical indicators present a balanced but cautious outlook for the B itcoin price prediction narrative.
TradingView's aggregated indicator summary remains neutral overall, though several underlying metrics reveal lingering weakness.
The Relative Strength Index (RSI 14) is currently near 40, suggesting that Bitcoin is neither oversold nor overbought but remains closer to bearish territory than bullish conditions.
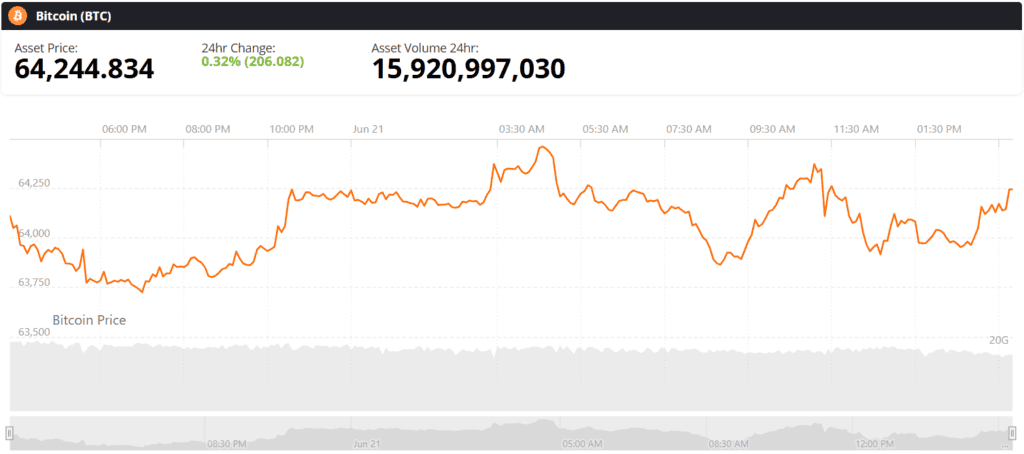
Bitcoin (BTC) was trading at around $64,244, up 0.32% in the last 24 hours at press time. Source: Bitcoin price via Brave New Coin
Other oscillators also indicate limited conviction. Stochastic %K sits around 53, Williams %R is near -48, and the Commodity Channel Index (CCI 20) reads approximately 19. The Average Directional Index (ADX 14) stands at 37, signaling moderate trend strength without an extreme directional bias.
One bright spot for bulls comes from the MACD indicator, which continues to generate a buy signal despite recent market weakness.
Moving averages tell a different story. Short-term indicators, including the EMA(10) at roughly $64,258 and the SMA(10) near $64,476, remain above the current market price, generating sell signals. Medium-term averages such as EMA(20) around $65,516 and EMA(30) near $67,085 also suggest overhead resistance.
The longer-term trend remains challenging, with the EMA(50), EMA(100), and EMA(200) positioned significantly above spot price at approximately $69,277, $72,257, and $77,833, respectively.
This combination leaves the market in a neutral-to-bearish position until stronger buying pressure emerges.
Whale Activity Adds Another Layer of Market Pressure
On-chain data suggests that recent whale behavior could continue influencing short-term price action.
Bitcoin is currently trading below the $72,100 average acquisition cost of newer whales—investors who have held BTC for fewer than 155 days. As a result, many recent large buyers remain underwater on their positions.
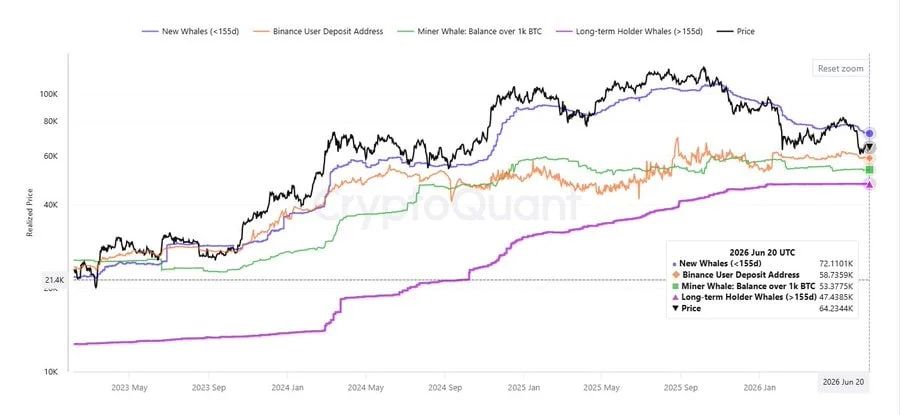
On-chain data shows several key support clusters below the current Bitcoin price, including Binance deposit addresses near $58,700, miner whales around $53,400, and long-term holder whales at approximately $47,300. Source: Onchain Insights via X
Analysts note that this group may create additional selling pressure whenever the price approaches break-even levels.
Below current market prices, several major support clusters remain visible. Binance deposit addresses are concentrated near $58,700, miner-controlled wallets holding more than 1,000 BTC show activity around $53,400, and long-term holder whales maintain an average cost basis near $47,300.
These levels may become increasingly important if Bitcoin experiences another significant correction.
BTC Price Prediction: Will Bitcoin Hold $64K?
The current BTC price prediction largely depends on whether buyers can reclaim momentum above the $64,000 threshold.
A successful breakout above the descending trendline would improve the short-term outlook and potentially trigger a recovery toward the mid-$60,000 range. However, the broader technical structure remains fragile while Bitcoin trades beneath several major moving averages.
At the same time, Saylor's continued accumulation strategy serves as a reminder of the growing divide between long-term institutional conviction and short-term market uncertainty.
As Bitcoin's latest price hovers near a critical support zone, traders and investors alike are watching closely to see whether Bitcoin can stabilize above $64,000 or whether renewed selling pressure will push the market toward lower support levels in the sessions ahead.