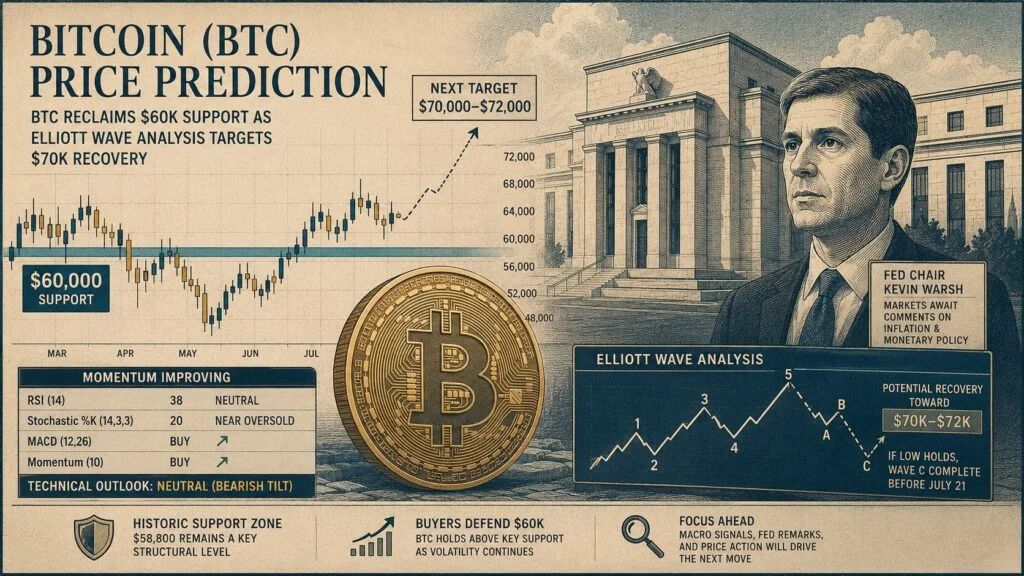
While the broader technical picture for BTC still reflects caution, improving momentum indicators and a historically significant support zone have prompted some analysts to project a recovery toward the $70,000–$72,000 range if current conditions remain intact.
The latest Bitcoin price shows buyers defending key support as traders also await fresh macroeconomic signals from Federal Reserve Chair Kevin Warsh, whose comments on inflation and monetary policy could influence risk assets, including cryptocurrencies.
BTC price regains momentum, but technical indicators remain mixed
The BTC price was trading around $60,079 on Bitstamp at the time of analysis, marking an intraday gain of approximately 3%. Although the recovery has improved short-term sentiment, TradingView's overall technical summary continues to lean bearish.
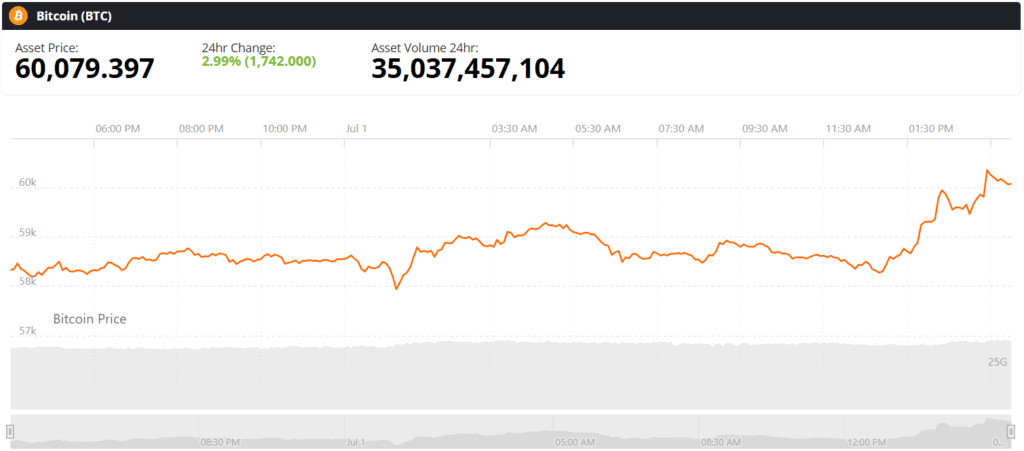
Bitcoin (BTC) was trading at around $60,079, up 2.99% in the last 24 hours at press time. Source: Bitcoin price via Brave New Coin
The platform's composite rating shows 13 Sell signals, 10 Neutral, and 3 Buy, resulting in an overall Neutral outlook with a noticeable bearish bias. The reading suggests that while Bitcoin BTC has stabilized after recent weakness, the broader trend has yet to fully reverse.
Momentum indicators, however, present a more balanced picture. The oscillator summary registers 0 Sell, 9 Neutral, and 2 Buy signals, indicating that the market is no longer in an aggressively bearish condition.
Several key indicators reflect this improving momentum:
Relative Strength Index (RSI 14): 38 – Neutral, remaining above the oversold threshold of 30. Stochastic %K (14,3,3): 20 – Near oversold territory, suggesting selling pressure may be fading. Commodity Channel Index (CCI 20): -95 – Neutral and below the mean, but not at an extreme level. MACD (12,26): Buy Momentum (10): BuyMeanwhile, indicators including the Awesome Oscillator, Williams %R, Ultimate Oscillator, and Bull Bear Power remain neutral, highlighting the absence of a decisive trend despite the latest rebound.
Historic 50MA support strengthens bullish case
Beyond the daily indicators, several market analysts are focusing on $58,800, a price level viewed as one of Bitcoin's most significant long-term structural supports.
The zone first acted as major resistance during Bitcoin's twin market-cycle peaks in April and November 2021. When Bitcoin reclaimed the level in early 2024, it flipped into a strong demand area after producing consecutive monthly closes above it.
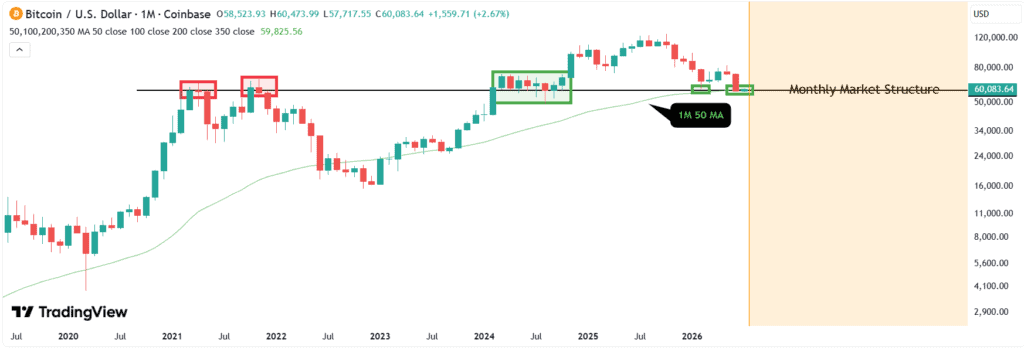
Bitcoin has tested the key $58,800 monthly support twice in 2026, with both February and June reinforcing the level alongside the monthly 50 MA. Source: VIAQUANT on TradingView
The same level later helped stabilize the market during the German government's large-scale Bitcoin sales and the unwinding of the Japanese yen carry trade before the rally toward a new BTC ATH.
In 2026, Bitcoin had once again respected this level. February produced a temporary wick into the zone, while June's monthly candle closed almost directly on $58,800, aligning closely with the monthly 50-period moving average.
With the market now trading back above $60,000, many analysts view this area as confirmation that long-term buyers continue defending one of Bitcoin's most important historical support levels.
Elliott Wave analysis points to $70K–$72K target
Adding to the constructive outlook, an independent TradingView analyst believes Bitcoin may have completed a liquidity sweep below last month's low before reaching the minimum 0.382 Fibonacci retracement associated with a fifth Elliott Wave structure.
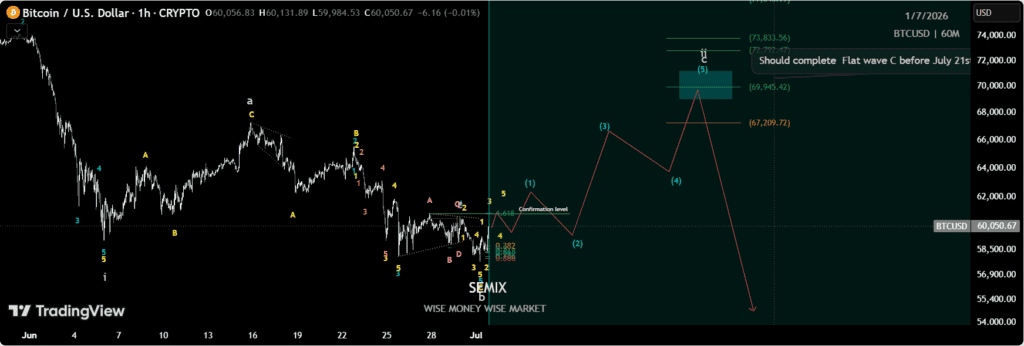
An Elliott Wave analysis suggests Bitcoin could rally toward the $70K–$72K range after sweeping last month's low, provided the current support holds and the flat correction completes by July 21. Source: SEMIX_OFFICIAL on TradingView
According to the analysis, if the recent low proves durable, the market could begin a short-term advance toward the $70,000–$72,000 range.
The analyst also noted that the current decline may represent the completion of a Wave C within a flat correction. Under Elliott Wave theory, finishing this corrective structure could pave the way for a fresh upward impulse, provided support continues to hold through July.
While this represents one possible technical scenario rather than a certainty, the analysis aligns with the improving momentum signals seen across several oscillators.
Moving averages continue to cap Bitcoin price recovery
Although short-term momentum has improved, moving averages continue to present the primary obstacle for the Bitcoin price prediction .
TradingView's moving average summary shows 13 Sell signals, 1 Neutral, and only 1 Buy, reinforcing that the broader trend remains corrective.
Short-term EMA and SMA (10) are positioned around $60,550–$60,570, placing immediate resistance just above the current market price.
Higher moving averages present even stronger barriers:
EMA/SMA 20–50: Approximately $62,000–$68,000 EMA/SMA 100–200: Roughly $70,000–$76,000One notable exception is the Hull Moving Average (9) near $59,207, which continues to generate a Buy signal, while the Ichimoku Base Line remains neutral.
From a support and resistance perspective, the classic pivot sits near $63,515, with upside resistance levels around:
R1: $68,995 R2: $79,465 R3: $95,414On the downside, important support remains at:
S1: $53,046 S2: $47,566 S3: $31,617These levels suggest that reclaiming the $60,000–$62,000 zone is only the first step before bulls can challenge stronger resistance overhead.
Fed comments could shape Bitcoin's next move
Despite the recent recovery, macroeconomic developments remain an important variable for the Bitcoin price forecast.
Market participants are closely watching remarks from newly appointed Federal Reserve Chair Kevin Warsh, particularly for any signals regarding inflation and future monetary policy.

Fed Chair Kevin Warsh expressed optimism about U.S. productivity and economic growth, citing stronger trends over the past four quarters. Source: @crypto_banter via X
Expectations that inflation pressures may be easing have already contributed to improving sentiment across risk assets.
For now, the latest Bitcoin price reflects a market attempting to recover from a corrective phase rather than one that has fully returned to a sustained uptrend.
As a result, the near-term BTC price prediction depends largely on whether buyers can maintain support above $60,000 while reclaiming the moving averages clustered between $62,000 and $68,000. A successful breakout above those levels would strengthen the case for a move toward the $70,000–$72,000 target outlined in Elliott Wave analysis, while failure to hold current support could leave Bitcoin vulnerable to renewed selling pressure.