


Recent technical analysis places BNB near $568, just below the lower end of that broader support region. The setup is mixed. Short-term momentum indicators are largely neutral, while moving averages continue to reflect a more defensive trend structure. For the BNB price prediction , the immediate question is whether the token can establish a sustained recovery above the $570–$577 resistance cluster before making another attempt at $600.
At the time of writing, market data showed BNB trading around $570, with a 24-hour range of roughly $563 to $574. The token remains well below its October 2025 all-time high near $1,370, underscoring the scale of the correction from its previous peak .
BNB Price Prediction: $570–$590 Support Remains in Focus
The latest price structure has kept the $570–$590 region at the center of the BNB technical analysis. The area has attracted buying interest, but repeated tests can also weaken support if buyers fail to generate a stronger rebound.
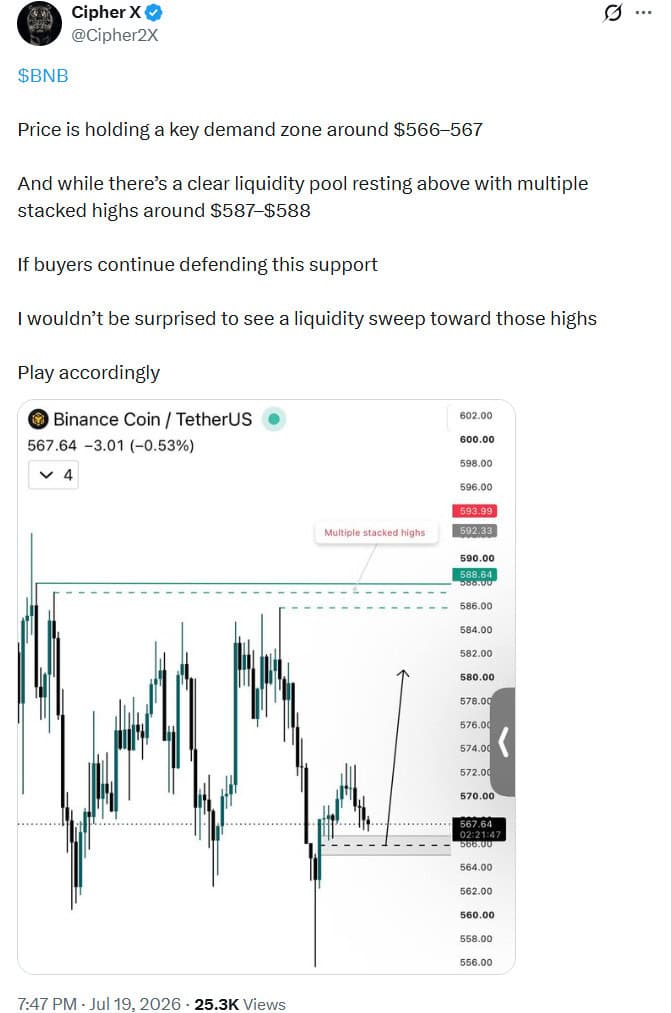
BNB is holding key support at $566–$567, with a potential liquidity sweep toward the $587–$588 highs if buyers defend the zone. Source: @Cipher2X via X
A recent analysis shared by @Cipher2X identified the $566–$567 area as a key demand zone. According to the setup, a successful defense of this region could leave room for BNB to move toward a liquidity pocket around $587–$588, where previous highs may attract further market activity.
BNB subsequently traded around the $570–$573 area, suggesting that the highlighted support has held in the short term. However, the recovery remains modest, and price has yet to demonstrate the momentum needed to challenge the more important $600 level.
The distinction between the two zones is important. The $566–$567 area represents a more immediate short-term support reference, while $570–$590 covers the broader weekly battleground identified in the longer-term analysis. A sustained break below the entire region would weaken the current stabilization thesis.
Technical Indicators Show a Mixed BNB Outlook
Recent TradingView data presents a cautious technical picture. BNB was quoted near $568.28, while the overall technical summary remained Neutral.
The oscillator readings offer little evidence of a strong directional trend. The 14-period RSI stood at 45.41, placing it below the midpoint but still well away from traditional oversold territory. Stochastic %K was 35.81, while Williams %R came in at -65.08.
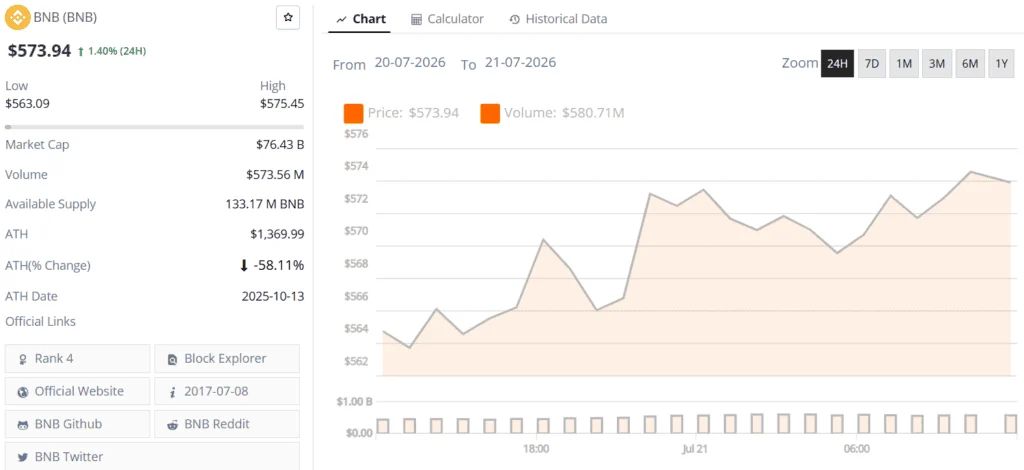
BNB price chart. Source: Brave New Coin
Other momentum indicators also pointed to limited trend strength. The Commodity Channel Index was -16.32, and the Average Directional Index stood at 17.18, a reading consistent with relatively weak directional momentum.
The Awesome Oscillator was -0.68, while Stochastic RSI Fast was 15.38. Bull Bear Power registered -5.56, and the Ultimate Oscillator was 48.81. Taken together, these readings suggest that BNB is not currently showing a broad-based momentum signal in either direction.
There were, however, some conflicting indications. The Momentum (10) indicator generated a Sell signal, while the MACD Level (12, 26) produced a Buy signal at -3.64. The oscillator group was therefore dominated by neutral readings, with one Sell and one Buy signal among the indicators highlighted in the analysis.
This combination points to a market waiting for confirmation rather than one already committed to a clear trend.
Moving Averages Keep the BNB Price Prediction Cautious
The moving-average structure is less supportive of an immediate bullish reversal.
Short-term averages remain close to the current price but mostly sit above it. The 10-period EMA was at 571.70, while the 10-period SMA stood at 572.93. The 20-period EMA was 573.33, and the 30-period EMA was 577.32.
These levels create an initial resistance band between roughly $570 and $577. BNB would need to reclaim this cluster and hold above it to improve the short-term technical picture.
The longer-term averages present a more significant challenge. The 50-period EMA and SMA were positioned at 587.16 and 586.70, respectively. The 100-period EMA stood at 611.84, while the 100-period SMA was 613.61.
Further above, the 200-period EMA and SMA were around $661.38 and $663.92. With these averages still above the current market price, the broader trend remains under pressure.
The exceptions include the Hull Moving Average (9), which generated a Buy signal at 568.18, while the Ichimoku Base Line was around 564.89 and remained Neutral.
Overall, the moving-average readings were heavily tilted toward Sell signals, with 12 Sell, one Neutral and one Buy. That imbalance suggests BNB needs more than a brief bounce to establish a convincing trend reversal.
Can BNB Reclaim $600?
The $600 level is becoming an important technical dividing line for the BNB price prediction .
A move above $600 would place BNB back above the broader weekly support area and could improve market sentiment. It would also represent a move above the short-term moving-average cluster and bring the market closer to the classic pivot point near $604.37.
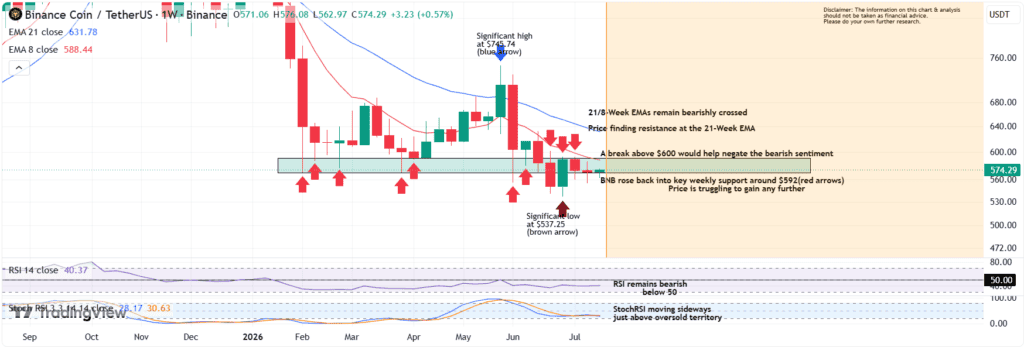
BNB remains near key weekly support, but bearish EMA signals, weak RSI, and repeated support tests keep the broader outlook bearish unless price reclaims $600. Source: DukesMarketAnalysis on TradingView
The weekly analysis from DukesMarketAnalysis similarly identifies $600 as a key level for the bulls. The assessment notes that "Bulls Need to Reclaim $600," arguing that a convincing recovery above the threshold would provide an early indication that sentiment is improving.
The same analysis warns that BNB's broader trend remains vulnerable. The 21-week and 8-week EMAs are described as bearishly crossed, while the RSI remains below 50. StochRSI, meanwhile, is close to oversold territory but does not yet provide definitive evidence that selling pressure has been exhausted.
That leaves $600 as a meaningful confirmation level rather than simply another round number. A move above it, particularly if supported by stronger trading volume, would offer a more constructive signal than a temporary intraday spike.
BNB Price Prediction: $588 Liquidity or $537 Retest?
The near-term price structure presents two contrasting scenarios.
On the upside, the $587–$588 area identified by @Cipher2X represents a potential liquidity target. A move through the $570–$577 resistance cluster could bring this zone into focus, followed by the broader $600 threshold.
The technical picture becomes more constructive if BNB can clear $588 and then establish support above $600. Such a sequence would show that buyers are not only defending the lower support zone but are also capable of absorbing selling pressure at successive resistance levels.
On the downside, failure to hold the $570–$590 region would increase the risk of a deeper correction. DukesMarketAnalysis highlighted the recent $537 low as a level that could return to focus if BNB fails to reclaim $600 and support eventually breaks.
The wider pivot calculations also show how sharply sentiment could change if support fails. The classic pivot is around $604.37, while the calculated S1 sits near $481.43. These broader pivot levels should be viewed as reference points rather than direct forecasts, particularly because they are derived from historical price ranges and may not align with the immediate market structure.
For now, the more relevant technical levels appear closer to the current price: approximately $566–$567 on the downside, $570–$577 as the first resistance band, $587–$588 as the next upside area and $600–$604 as the key confirmation zone.
BNB Price Prediction: Key Levels to Watch
BNB's immediate outlook remains balanced between a potential recovery and the risk of another support breakdown.
The first level to watch is $566–$567, where recent analysis identified demand and where buyers have so far prevented a deeper decline. Below that, the recent $537 low becomes an important downside reference.
On the upside, BNB must first overcome the $570–$577 moving-average cluster, followed by the $587–$588 liquidity area. A sustained move above $600 would provide a stronger technical signal, with the classic pivot near $604.37 adding another reference point around the same zone.
The indicator mix suggests that the market has not yet reached an extreme oversold condition. RSI at 45.41 remains neutral-to-soft, while the ADX reading of 17.18 indicates limited trend strength. At the same time, the concentration of longer-term moving averages above the current price shows that BNB still faces considerable overhead resistance.
For the BNB price prediction , the key question is therefore not simply whether the token can briefly trade above $600. The more meaningful test will be whether BNB can reclaim and hold that level after defending the $570–$590 support region .
If buyers achieve that, the technical structure would begin to improve and could open the way toward higher resistance levels. If support fails before that recovery develops, the recent $537 low could once again become relevant. Until one of these scenarios is confirmed, BNB remains caught between a fragile support base and a broader trend that has yet to turn decisively bullish.