


The move has improved the short-term technical picture, but the broader trend remains under pressure as XRP continues to trade below several key long-term moving averages.
According to the latest market data, XRP is trading around $1.14, with a market capitalization of roughly $71.4 billion and 24-hour trading volume of about $1.55 billion. The token remains well below its January 2018 all-time high of $3.84, highlighting the distance bulls still need to cover before a broader trend reversal can be established.
The immediate question for the XRP price prediction is whether buyers can turn the recent breakout into a sustained recovery. Technical analysts are watching $1.1866 as the first major hurdle, while the $1.25-$1.30 region represents a more significant test for the broader market structure.
XRP Price Breaks Above $1.13 Resistance
Crypto analyst Ali Martinez said the XRP breakout above $1.13 had been confirmed on the one-hour chart after the token moved through the upper boundary of a descending channel.
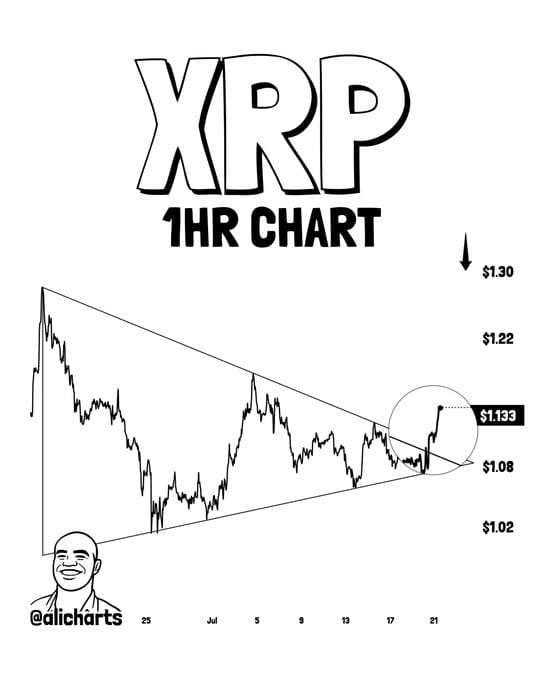
XRP has confirmed a breakout above $1.13 resistance, clearing its descending channel and setting the $1.30 level as the next major target. Source: Ali Martinez via X
The analyst had previously identified $1.13 as an important resistance level. The subsequent move above approximately $1.133 on July 21 marked a technical shift in the short-term structure and brought the $1.30 area back into focus as the next major target.
The breakout is significant because XRP had been trading within a declining structure before moving higher. However, a single move above resistance does not necessarily establish a lasting trend change. Follow-through, trading volume and higher-timeframe closes remain important for determining whether the breakout can hold.
Current XRP price data also shows the token trading above the $1.13 area, although intraday volatility remains elevated. TradingView's current market page shows XRP gaining in the latest session, while broader performance remains weaker over longer periods.
XRP Price Today: $1.1866 Resistance Comes Into Focus
The latest recovery has brought XRP toward $1.1866, identified by DukesMarketAnalysis as the first meaningful resistance level bulls need to overcome.
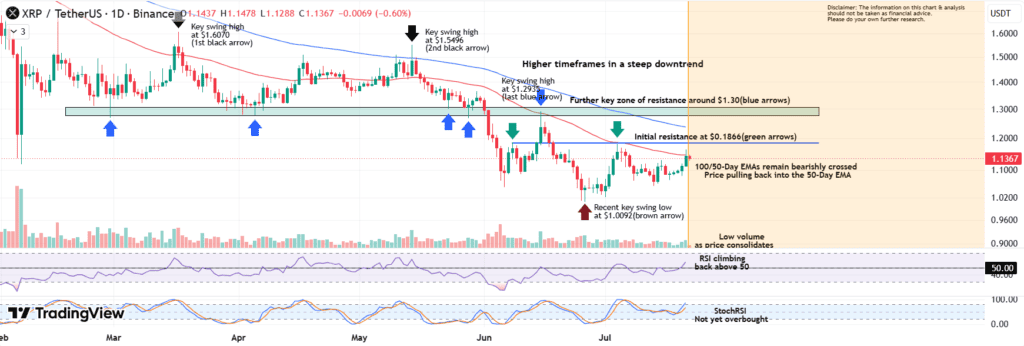
XRP has joined the broader crypto-market recovery but now faces its first major resistance at $1.1866, a key hurdle bulls must clear to sustain the rebound. Source: DukesMarketAnalysis on TradingView
"A break and close above $1.1866 would strengthen the short-term bullish case," the analysis noted, while emphasizing that the $1.30 region remains the more important resistance zone.
That distinction is important for the XRP price prediction . A move above $1.1866 could confirm that buyers are gaining control of the immediate price action, but it would not, by itself, reverse the longer-term trend.
The $1.30 level is particularly relevant because XRP previously struggled to maintain advances in that region. A sustained move through that resistance would represent a more substantial change in market structure than the initial $1.13 breakout.
Momentum Indicators Turn More Constructive
Momentum readings have improved alongside the price recovery.
TradingView's technical breakdown shows the 14-period Relative Strength Index (RSI) at 58.12. That reading is above the neutral 50 threshold but remains below the traditional overbought zone, suggesting that momentum has strengthened without reaching an extreme level.
The Stochastic %K (14, 3, 3) stands at 65.71, while the Commodity Channel Index (CCI 20) is at 104.97. Both readings were classified as neutral in the supplied technical analysis.
Several momentum-based indicators, however, lean bullish. The Awesome Oscillator is at 0.00094, the Momentum (10) reading is 0.05245, and the MACD Level (12, 26) is -0.00424, with the cited TradingView analysis classifying these readings as Buy signals.
The combination presents a mixed but improving picture. RSI is supporting the recovery, while the absence of an extreme oscillator reading leaves room for additional movement in either direction.
DukesMarketAnalysis similarly noted that RSI had moved back above 50 and that StochRSI had turned higher while remaining below overbought territory.
The analysis also cautioned that trading volume had remained relatively subdued during the consolidation. A stronger breakout would therefore be more convincing if accompanied by a clear increase in buying activity.
Moving Averages Keep the Long-Term Trend Under Pressure
The biggest obstacle to a broader XRP trend reversal remains the longer-term moving-average structure.
TradingView's moving-average analysis records 10 Buy signals, four Sell signals and one Neutral signal. Shorter-term averages are providing support, with the 10-period EMA at $1.10750 and the 10-period SMA at $1.09982. The 20-, 30- and 50-period moving averages also carry Buy signals in the cited analysis.
These readings indicate that XRP's recent price action has strengthened relative to its shorter-term trend.
The longer-term averages tell a different story. The 100-period EMA is positioned at $1.23738, while the 100-period SMA stands at $1.25639. Further above, the 200-period EMA is at $1.44043 and the 200-period SMA at $1.41593.
With XRP still below these longer-term averages, the broader market structure remains vulnerable to renewed selling pressure.
DukesMarketAnalysis also pointed to a bearish 100/50-day EMA crossover and argued that the higher timeframes continue to reflect an established downtrend. From that perspective, the latest rally is better viewed as an attempt to repair the technical structure rather than definitive evidence that the larger trend has already turned bullish.
XRP Price Prediction: Key Levels to Watch
The technical levels around XRP have become increasingly important as the token attempts to build on its recent breakout.
The first level is the $1.13 area. Holding above this former resistance could help establish it as short-term support. A sustained return below it would weaken the breakout thesis and raise questions about whether the move was a temporary push above resistance.
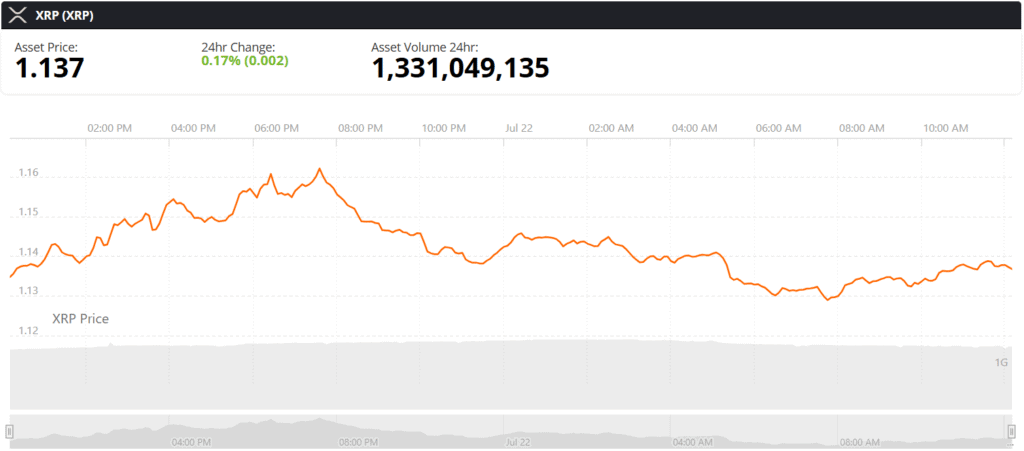
XRP price chart. Source: XRP price via Brave New Coin
Above the market, $1.1866 is the next notable hurdle identified by the technical analysis. A decisive break and close above that level could improve the short-term structure.
The $1.25 region is another important area. TradingView's classic pivot calculations place R1 at $1.24893, making the zone relevant to traders watching for the next stage of the recovery.
Beyond that, the $1.30 resistance area remains the central level for the broader bullish case. A sustained move through $1.30 would represent a considerably stronger technical development than the initial breakout above $1.13.
The pivot point is calculated at $1.12844, slightly below the current XRP price . The same classic pivot framework places support at $0.91802, with lower support levels at $0.79753 and $0.46662. These wider levels highlight the potential volatility surrounding XRP if the current recovery fails.
For the immediate XRP price prediction, the structure therefore remains divided. Holding above $1.13 and breaking $1.1866 would keep the short-term recovery intact, while a move toward $1.25-$1.30 would be needed to challenge the broader bearish structure.
XRP Price Prediction: Bulls Need More Than a Breakout
The XRP price prediction has improved at the short-term level following the move above $1.13, but the evidence for a full trend reversal remains incomplete.
The RSI at 58.12 and stronger short-term moving averages indicate improving momentum. The price is also trading above the calculated $1.12844 pivot, while the recent breakout has shifted attention toward $1.1866 and then the $1.25-$1.30 resistance region.
At the same time, XRP remains below the 100- and 200-period moving averages. The bearish 50/100-day EMA structure and subdued volume also suggest that buyers have more work to do before the broader trend can be considered decisively bullish.
For now, the market is at a technical crossroads. Holding above $1.13 would preserve the recent breakout structur e, while a move above $1.1866 could provide further evidence of improving momentum. A sustained break through the $1.25-$1.30 region, supported by stronger volume, would offer a more meaningful signal that XRP is attempting to reverse its broader downtrend.
Until those levels are reclaimed, the latest move remains a developing recovery rather than a confirmed long-term trend change .