


As of September 20, the current Solana price is trading near $108.79 after declining approximately 3.47% over the past 24 hours. The latest pullback from $112.39 has brought SOL closer to short-term support around $107.50, leaving traders focused on whether buyers can stabilize the price or whether the correction will deepen.
Solana's Bullish Structure Targeting $125
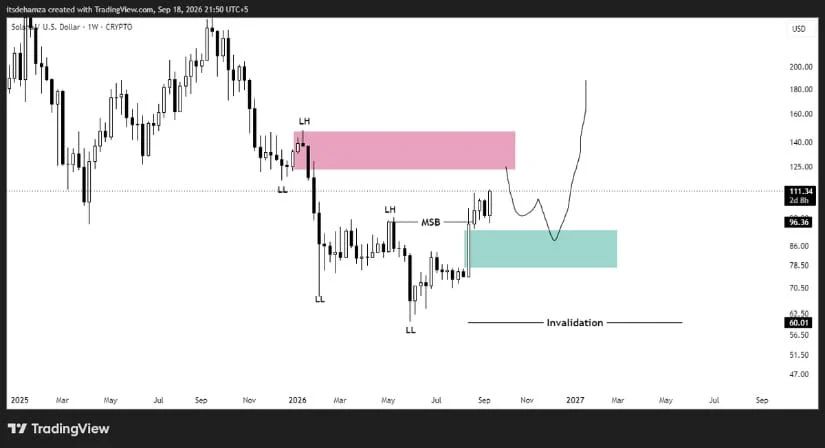
Solana has recorded an important market structure break on the higher-timeframe chart after recovering from its recent lows. The move above the previous lower high near $96 suggests that buyers are beginning to challenge the bearish structure that controlled price during the earlier decline.
The setup shared by HK shows SOL trading above the former breakout level, with a potential retest of the $80-$96 demand region before another expansion develops. This zone remains important because holding it would support the newly established bullish structure and allow buyers to prepare for a move towards higher resistance.
The next major supply area sits around $125-$145, where previous price action could attract selling. A sustained recovery into this region would strengthen the longer-term reversal scenario, while a decisive break beneath the broader demand zone would weaken it. The chart places a deeper structural invalidation near $60.
Solana Tests Weekly VWAP Resistance Near $115
Solana is approaching an important weekly VWAP resistance area after recovering from its recent lows. DocXBT's chart shows SOL trading around $112.91, just below the horizontal resistance at $115.58, where the upper VWAP band is also converging with price.
SOL price has recovered from the $60-$80 region and is now testing the descending upper VWAP band, while the lower band has started to flatten beneath price. A sustained weekly close above the upper band and $115 resistance would strengthen the case for a broader trend reversal.
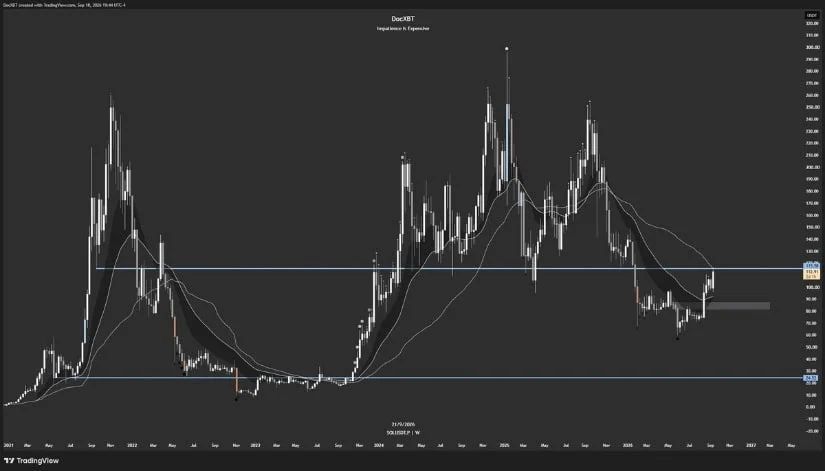
A successful retest of $113-$115 as support would provide further confirmation. However, another rejection from the VWAP resistance could send SOL back towards the $80-$90 demand region. For now, the recovery is improving, but the higher-timeframe breakout still needs confirmation.
Solana Price Support Zone Between $100-$96
The latest decline towards $108.79 means Solana is now testing whether buyers can sustain the recent improvement. Price has pulled back from the $112 region but remains above the previous market structure break near $96.
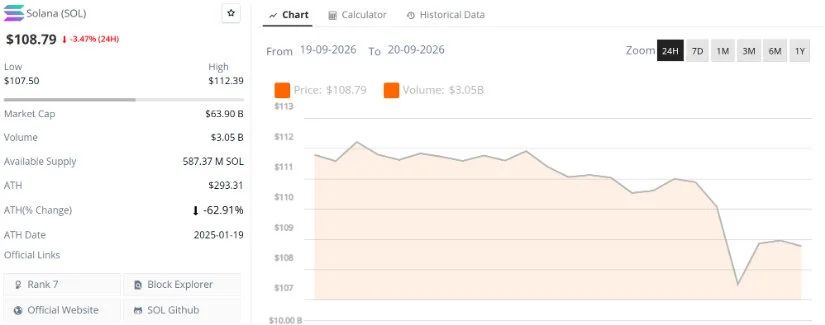
The immediate resistance lies around $112-$115. A recovery above this area would improve short-term momentum and allow SOL to challenge the next major resistance cluster around $125. Beyond that, the higher-timeframe supply zone extends towards approximately $140-$145.
On the downside, $105-$100 is the first area to watch if the correction continues. Losing $100 would bring the previous breakout level near $96 back into focus. Holding above that level would preserve the broader recovery structure, while a sustained move below it could expose the deeper $80-$90 demand region.
Solana On-Chain Fundamentals Hitting Record Highs
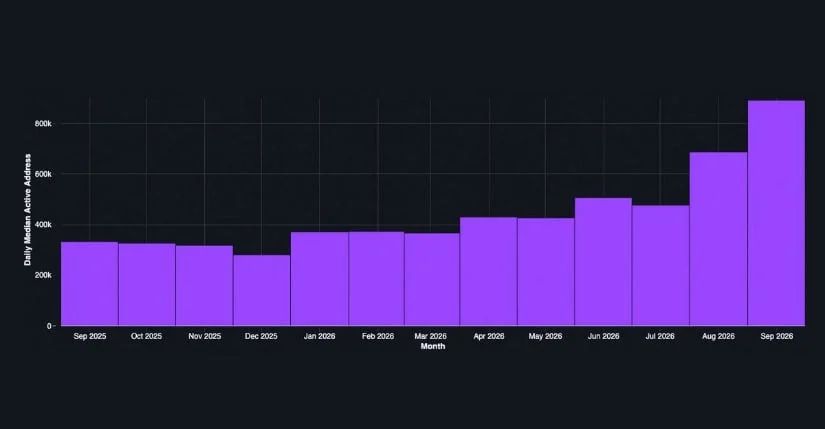
Solana's on-chain fundamentals are improving, with stablecoin activity reaching new levels as the network continues to attract users. According to an update shared by Solana, daily active stablecoin addresses reached approximately 888,000 in September, up 269% from 333,000 a year earlier.
For SOL, the increase in active addresses adds a supportive fundamental backdrop to the developing technical recovery. However, stronger on-chain usage does not guarantee immediate price appreciation. With SOL still facing important resistance around $115, the next step is whether improving network activity can be accompanied by sustained market demand and a confirmed technical breakout.
Short-Term Solana Technical Analysis
Solana is pulling back after a strong rally towards $113-$114, with price now trading around $108.50. The latest correction is testing whether buyers can defend the recent breakout structure or whether SOL needs a deeper retracement before attempting another move higher.
The main levels to watch on the chart are:
Immediate support: $107-$108. Holding this region would allow SOL to stabilize after the latest pullback. Lower support: $102-$104, followed by $97-$100. These areas formed part of the previous consolidation and breakout base. Key resistance: $112-$114. Reclaiming this zone would bring the recent high back into focus and strengthen the case for further upside.For now, the short-term structure remains constructive, but buyers need to defend $107-$108 to avoid a deeper correction. A break below this area could bring $102-$104 into focus, while a recovery above $112-$114 would signal renewed bullish momentum.
Final Thoughts: Bullish Path or Bearish Outlook?
Solana's broader structure has improved following its recent recovery, while growing stablecoin activity provides a supportive fundamental backdrop. However, the latest pullback shows that buyers still have work to do, particularly around the $112-$115 resistance region.
The bullish scenario requires SOL to defend $100-$105 and eventually establish itself above $115. A confirmed breakout would bring $125 into focus, followed by the larger $140-$145 supply zone. Holding the former breakout level near $96 during any deeper retest would also help preserve the higher-timeframe recovery.
The bearish scenario becomes more relevant if SOL fails to regain $115 and begins losing nearby support. A sustained break below $96 could expose $80-$90, while the broader bullish structure would face a more serious challenge if the chart's major invalidation near $60 is reached.
For now, Solana is showing signs of a developing recovery rather than a confirmed long-term reversal. The next reaction around $100-$115 will help determine whether Solana price prediction can extend towards $125 or needs another deeper support test first.