


Bitcoin recently climbed above $85,000 before encountering renewed selling pressure. Glassnode’s latest Week On-Chain report shows that a new sell-order block has formed around $86,500-$86,750, while the largest concentration of Binance spot bids has moved toward $81,000-$81,250.
The setup leaves Bitcoin price today caught between overhead supply and a nearby demand zone. A sustained hold above $81.1K could preserve the recent recovery structure, while a decisive loss of the level would weaken the bullish case and expose lower support areas.
Bitcoin Price Faces $81K Demand Zone
Glassnode reported that Bitcoin was rejected after reaching the $86,500 sell wall, with the market subsequently moving lower toward a zone where buyers have positioned significant resting orders.
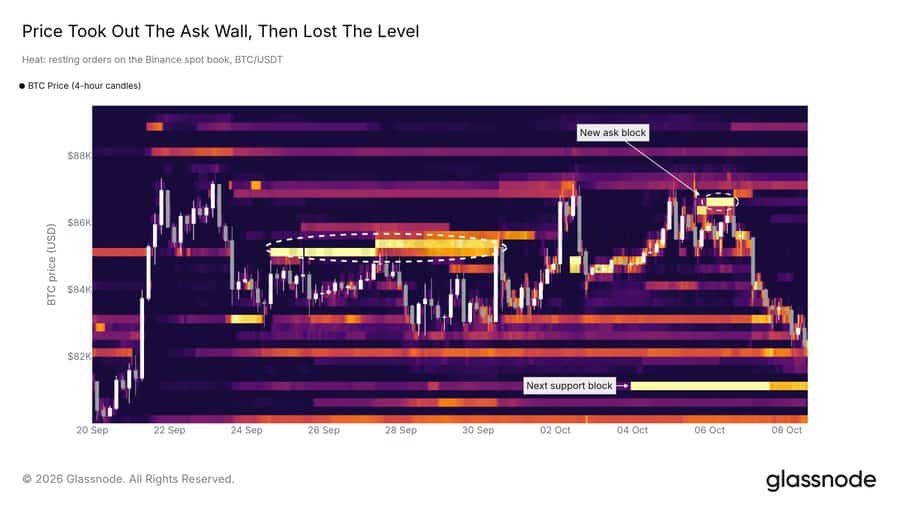
Glassnode notes Bitcoin falling toward support after rejection at the $86.5K sell wall, with substantial buy orders near $81K potentially limiting downside. Source: Glassnode via X
According to the research firm, “the largest block of bids now sits at $81K-$81.25K,” making the area an important reference point if the pullback continues. Glassnode also identified a liquidation cluster around $81.7K-$83.3K, suggesting that leveraged positions could increase volatility if BTC moves deeper into that range.
The order-book structure does not guarantee that the bids will hold. Large limit orders can be canceled or absorbed as market conditions change. However, the concentration of liquidity gives traders a clear level to monitor as they assess the latest BTC price action.
The $81K area is also close to the $81,119 Fibonacci level highlighted in a TradingView analysis by Kazim Karabacak. That analysis argues that Bitcoin’s recovery remains intact as long as daily closes stay above the level.
$81.1K Holds Key Technical Significance
The $81,119 level comes from a Fibonacci retracement framework drawn between Bitcoin’s March 2023 low and its cycle high. BTC previously reclaimed the 0.382 retracement and subsequently moved above the 0.236 level at $81,119.
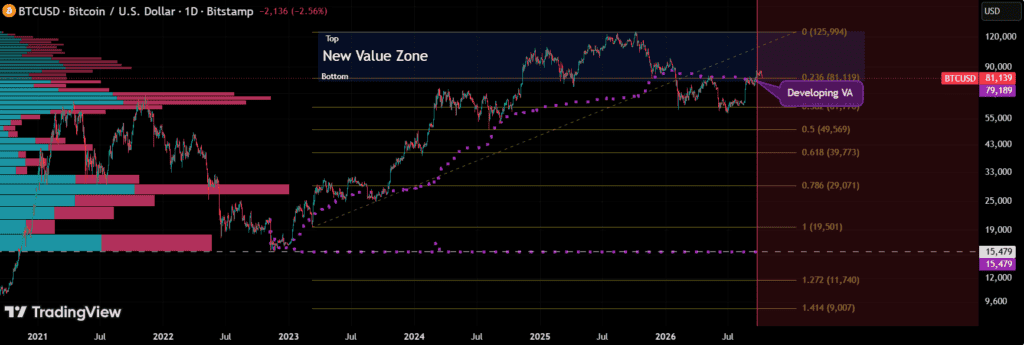
Bitcoin reclaimed the 0.382 Fibonacci level and broke above the 0.236 level at $81,119, where it is now trading. Source: KazimKarabacak on TradingView
That makes the level more than a short-term order-book reference. It is also a technical pivot for determining whether the recent recovery represents an unwinding of the previous pullback or the beginning of another decline.
A daily close above $81,119 would keep the reclaim structure in place under this framework. Conversely, a sustained move below the level could return Bitcoin to the broader range between the 0.236 and 0.382 Fibonacci retracement levels.
The lower retracement identified in the analysis sits near $61,776. That does not mean BTC is necessarily headed toward that level, but it illustrates the downside range that could become relevant if the $81.1K support fails.
Bitcoin Momentum Shifts Away From US Trading Hours
Bitcoin’s latest move is also notable because the source of its gains has changed. Glassnode found that US trading hours accounted for much of BTC’s advance from July through the September breakout above $85,000.
That pattern has since reversed.
Glassnode reported that the US session has become a net seller, while gains outside US trading hours have provided the market’s remaining net advance. The firm linked the shift to weaker contributions from US market activity following the breakout.
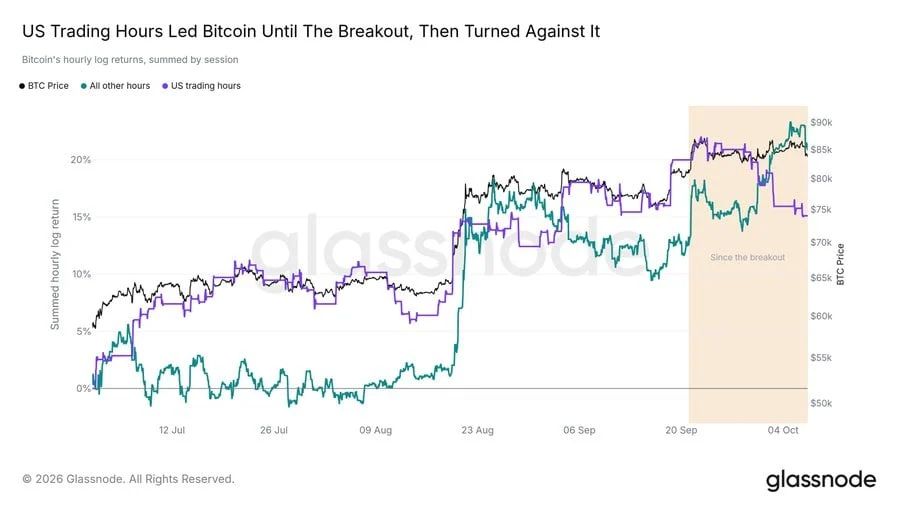
US trading hours led BTC’s pre-breakout gains, while non-US sessions have driven performance post-breakout as US contributions have stalled. Source: Glassnode via X
This distinction matters because US trading hours overlap with activity in spot Bitcoin ETFs and broader US financial markets. A return of positive momentum during those hours could provide a stronger confirmation of renewed demand.
For now, the rally is occurring against a backdrop of relatively light trading activity. Glassnode said combined Bitcoin spot-exchange and US spot ETF volume averaged about $6.8 billion over seven days, a level lower than on most days since January 2024.
Double-Bottom Setup Keeps $100K in Focus
The technical picture becomes more constructive on a longer timeframe. TradingView analyst VincePrince has identified a potential double-bottom formation on Bitcoin’s weekly chart .
The analysis points to BTC holding above its 50-EMA and 100-EMA while also remaining above an ascending trendline. The chart structure is further supported by bullish RSI divergence, according to the analysis.
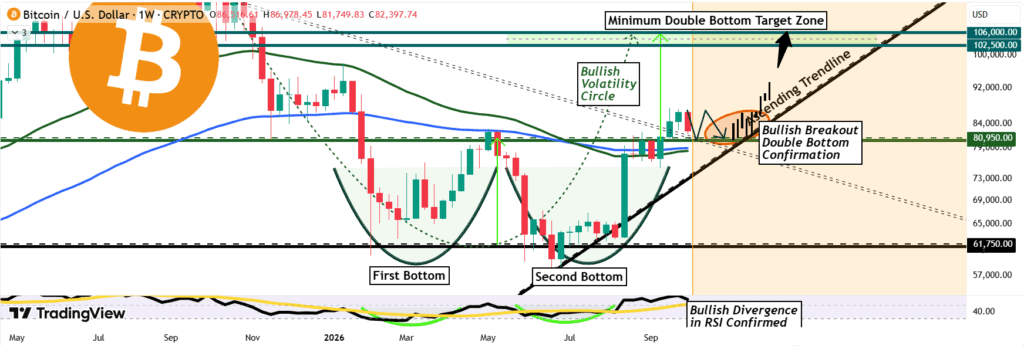
Bitcoin is forming a large double bottom above its neckline, supported by a bullish RSI divergence that strengthens the breakout setup. Source: VincePrince on TradingView
A double bottom generally develops when price tests a similar low twice before breaking above the intervening peak, known as the neckline. If the pattern is confirmed, its measured move can provide an upside reference.
VincePrince’s analysis places potential targets above $100,000 if Bitcoin maintains the relevant support levels and completes the formation. That remains a technical scenario rather than a confirmed price target, particularly while BTC price is still testing short-term support.
Bitcoin Price Prediction: What Traders Are Watching
The immediate BTC price outlook therefore centers on two levels: approximately $81.1K on the downside and the $86.5K-$86.75K area above.
Holding $81,119 would preserve the Fibonacci reclaim and keep the potential double-bottom structure technically relevant. A move back through $86,500, meanwhile, would challenge the latest ask wall identified by Glassnode and could provide stronger evidence that sellers are being absorbed.
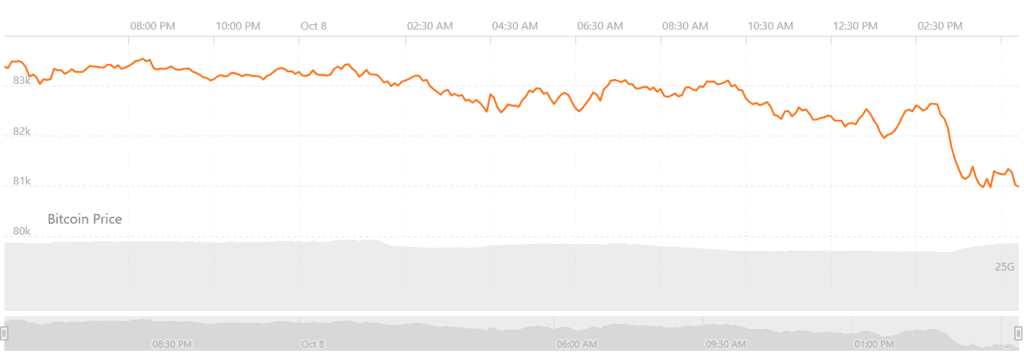
Bitcoin (BTC) price chart (24H). Source: Brave New Coin
Glassnode also noted that the largest liquidation cluster above the current market sits around $87,100-$95,900, with the concentration particularly strong near $92,000. If BTC clears the nearby resistance, those positions could become relevant to the next phase of price discovery.
For now, Bitcoin remains in a decision zone rather than a confirmed breakout. The $81K-$81.1K region combines technical support with substantial spot-market bids, making it an important test of the recovery. Whether buyers defend that area and whether US trading activity returns as a source of demand will likely determine whether the current pullback stabilizes or develops into a deeper correction.