


Santiment data shows that wallets holding at least 1 million XRP have climbed to 2,147, suggesting increased accumulation among large holders. At the same time, technical analysts are identifying potential reversal signals around $1.30, with Fibonacci extensions pointing toward higher price targets. However, XRP still faces resistance around $1.33–$1.56, leaving confirmation of a sustained recovery dependent on further buying pressure.
XRP Whale Wallets Reach Highest Level of 2026
On-chain data provider Santiment reports that the number of XRP wallets holding at least 1 million tokens has increased to 2,147, marking the highest reading so far in 2026. The count has added 28 wallets over the past 10 days, including 18 in the most recent three-day period. The increase comes as XRP trades under pressure near $1.30, highlighting a difference between large-holder activity and broader price performance.
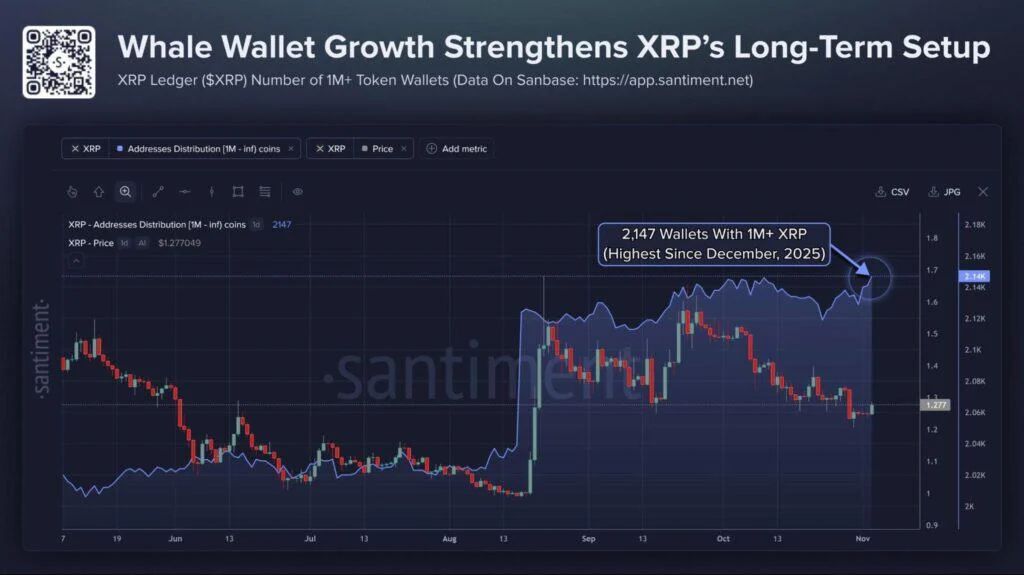
XRP’s million-token holder wallets reached a 2026 high of 2,147, increasing by 28 over the past 10 days. Source: @SantimentData via X
The growing wallet count suggests that some large investors are accumulating XRP rather than reducing their exposure during the recent pullback. Santiment's chart shows the number of millionaire wallets climbing toward a yearly peak even as XRP's price candles reflect considerable volatility. This divergence has attracted attention because sustained accumulation during market weakness can indicate confidence among larger holders. However, wallet counts alone cannot establish whether every increase represents fresh buying, as transfers between addresses can also affect the figures.
The $1.20–$1.25 region remains an important reference area for monitoring this trend. If XRP maintains support around these levels while millionaire wallet numbers remain elevated, the on-chain picture could provide a constructive signal for longer-term market sentiment. Conversely, a decline in large-holder activity alongside a breakdown below support would weaken the accumulation narrative.
XRP 12-Hour Chart Shows a Potential Buy Signal
Technical analyst Jesse Olson (@JesseOlson) has identified a potential buy signal on XRP's 12-hour Binance chart after the cryptocurrency found support at a horizontal level he described as a "sniper target." His chart marks the support reaction with an upward arrow and highlights an attempt to break above a descending trendline.
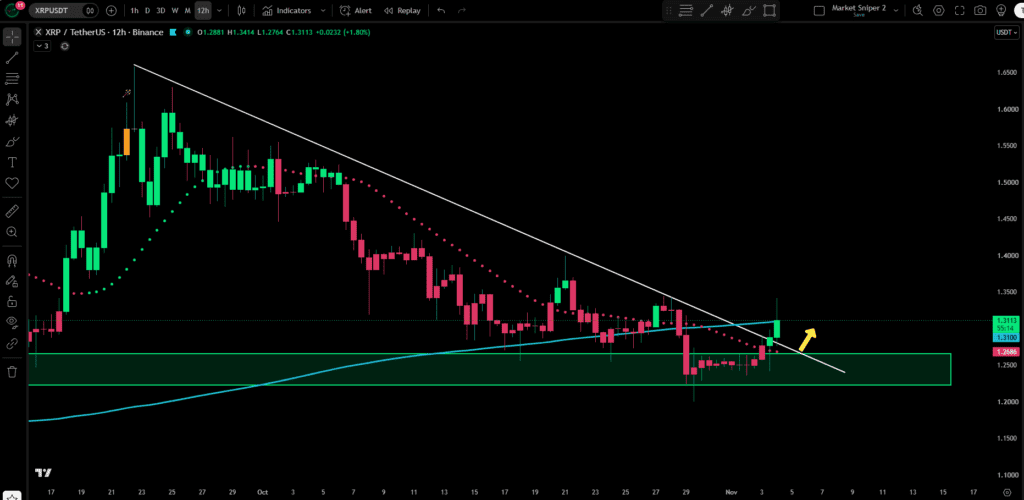
XRP’s 12-hour Binance chart shows price bouncing from a key sniper-target support level while attempting to break its descending trendline. Source: Jesse Olson via X
The setup suggests that buyers are attempting to regain control after a period of downward price movement. Olson's analysis also raises the possibility of a confirming buy signal on the daily timeframe, which would provide another indication that selling pressure is easing. XRP traded around $1.30–$1.31 during the early November session, recording gains of more than 2% over the day.
Olson, who operates MarketSniperPro, focuses on identifying specific support and resistance areas for cryptocurrency swing trades. His 12-hour chart signal remains an early technical indication rather than confirmation of a broader trend reversal. A sustained move above the descending trendline, followed by a stronger daily signal, would provide additional evidence that XRP could extend its recovery.
Elliott Wave Analysis Points to a Potential $2 XRP Rally
An Elliott Wave analysis published by Intuit identifies a potential completion of XRP's corrective B-wave, opening the possibility of an upward move toward $2. The analysis highlights a relationship between the duration and retracement of the first two corrective waves, with wave B lasting approximately as long as wave A and retracing 61.8% of its previous decline.
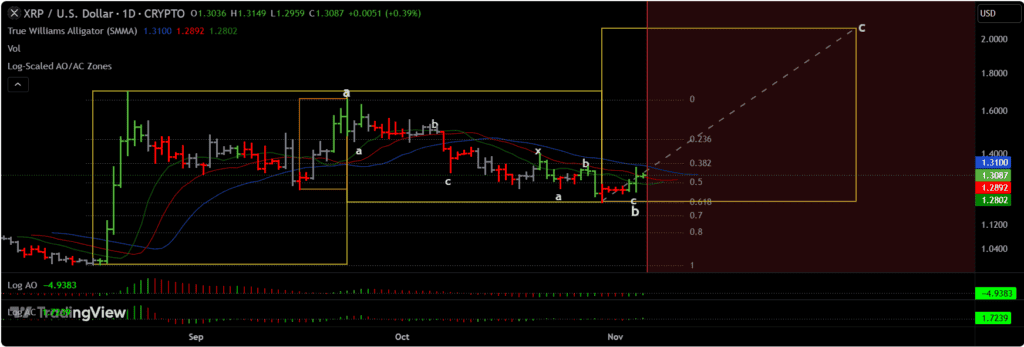
XRP’s Wave-B matches Wave-A in duration and retraces exactly 61.8%, with a potential internal double zigzag structure and strong bullish divergences across multiple timeframes. Source: Intuit on TradingView
The analyst also identifies a possible double-zigzag structure within wave B and bullish divergences across multiple timeframes. These conditions form the basis of a bullish interpretation in which XRP could begin another upward phase after completing its correction.
"From here, I suspect we begin a climb towards $2 over the next month," Intuit wrote, outlining the expected direction of the next move. The analysis also identifies $1.20 as an important invalidation level. A break below that price would require a reassessment of the current Elliott Wave count rather than support the existing bullish projection.
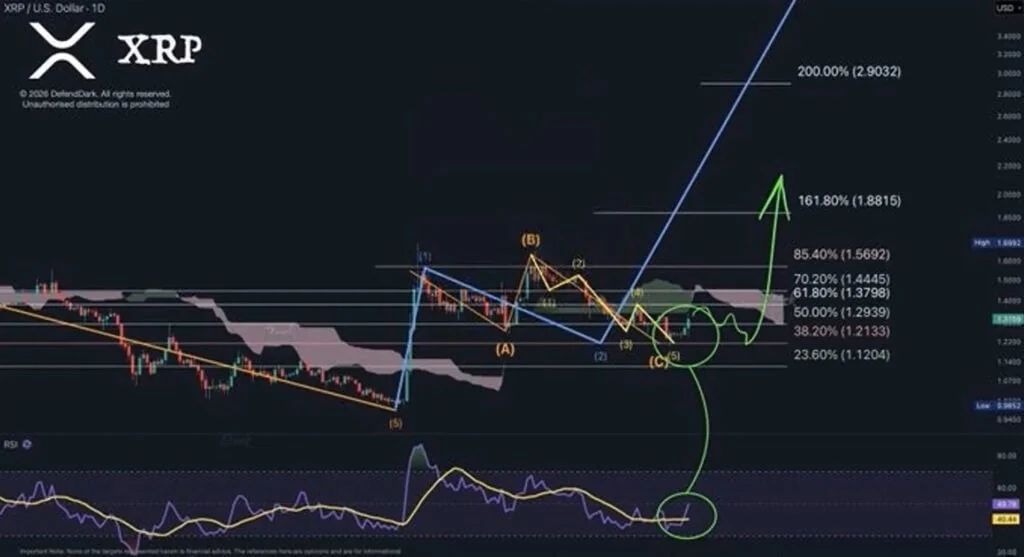
XRP could be entering a major Elliott Wave 3 advance, with RSI turning higher and a break above $1.56 needed for Ichimoku-based confirmation. Source: Carolina via X
Another technical outlook from @Carolinatcwnl identifies the possibility of a new Elliott Wave 3 advance. The analysis points to an upward turn in the Relative Strength Index (RSI) and identifies $1.56 as a critical breakout threshold. A move above this level, supported by confirmation from the Ichimoku Cloud, could strengthen the bullish interpretation.
The accompanying Fibonacci projections identify $1.8815 as the 161.8% extension and $2.9032 as the 200% extension. These levels represent potential upside objectives if XRP establishes a sustained upward trend. However, they remain conditional projections rather than confirmed price targets, particularly while the cryptocurrency trades near $1.31.
XRP Price Forecast: Technical Indicators Show Mixed Signals
The broader technical picture presents a more cautious outlook despite improving short-term price action. XRP/USD recently traded around $1.30546 on Bitstamp, gaining approximately 2.37% during the latest session covered by the market readings. However, the aggregated technical summary remains neutral, with nine sell signals, nine neutral readings, and eight buy signals.
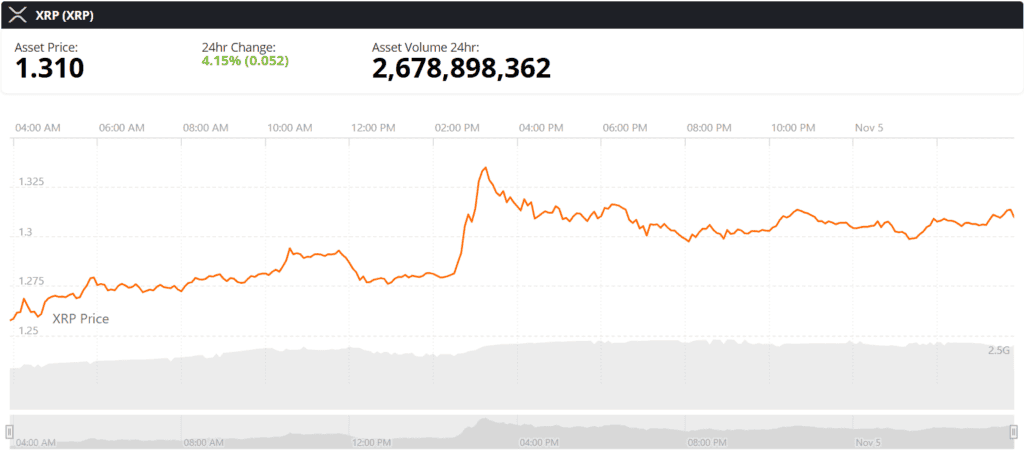
XRP price chart. Source: Brave New Coin
The 14-period RSI stands at 48.22, indicating that XRP is neither overbought nor oversold. The Average Directional Index (ADX) reads 18.06, suggesting limited trend strength. Meanwhile, the Stochastic oscillator remains neutral at 58.27, while the MACD carries a buy signal despite remaining below zero. These readings indicate some improvement in momentum but do not yet establish a decisive bullish trend.
Shorter-term moving averages offer some support. The 10-period and 20-period exponential moving averages (EMAs) stand at $1.28439 and $1.30177, respectively, both carrying buy signals. Their simple moving average counterparts also indicate buying pressure. The Volume Weighted Moving Average (VWMA) at $1.29468 and the Hull Moving Average at $1.29406 provide additional short-term support references.
However, intermediate and longer-term averages remain less favorable. The 30-period EMA stands at $1.31964, while the 50-period EMA is near $1.33379, both carrying sell signals. The 200-period EMA is also higher at $1.36196. This arrangement shows that XRP has recovered above several shorter-term averages but still faces overhead resistance from longer-period indicators.
The Relative Strength Index and low ADX reading also suggest that the current recovery lacks strong directional momentum. A sustained move above the $1.33–$1.34 region would therefore be an important development for buyers.
Looking Ahead: Can Bulls Push Toward $2?
The immediate technical outlook depends on whether XRP can maintain its recovery above the $1.29–$1.30 area and overcome resistance around $1.33–$1.34. The classic pivot level stands at $1.33398, making it an important near-term reference. A decisive move above this area could bring the next resistance levels at $1.40197 and $1.46997 into focus.
Further gains could expose the Fibonacci pivot resistance near $1.55429, which also aligns with the $1.56 breakout threshold identified in the Elliott Wave analysis. Clearing this area would strengthen the case for a move toward $1.8815, the first significant Fibonacci extension target. A continuation of the rally could then put the $2 psychological level within reach, broadly aligning with Intuit's projection.
On the downside, the $1.2939–$1.2133 region represents an important nearby support zone. The 200-period simple moving average near $1.27282 also provides a reference for assessing whether buyers can defend the recent recovery. A sustained move below $1.20 would weaken the bullish Elliott Wave structure and require a fresh assessment of the price outlook .
Overall, XRP's latest on-chain and technical developments present a potentially constructive setup, but they do not yet confirm a sustained trend reversal. The increase to 2,147 millionaire wallets provides evidence of growing large-holder participation, while the 12-hour buy signal and Elliott Wave projections offer possible upside scenarios. For the $2 target to become more credible, XRP would need to reclaim successive resistance levels, particularly $1.56, while maintaining support above $1.20. Until those conditions are met, the market remains in a transitional phase between accumulation signals and an unconfirmed recovery.