


The November 21 selloff has kept all three cryptocurrencies under pressure, with moving averages indicating sustained bearish momentum. Although oversold readings suggest that selling pressure could ease temporarily, the broader technical picture remains negative. Investors are watching whether Bitcoin can stabilize below $60,000, Ethereum can defend the $1,550–$1,580 area, and XRP can avoid another test of its recent lows.
Bitcoin Price Nears $55K as Bearish Signals Strengthen
Bitcoin (BTC) remains under significant selling pressure after falling below $60,000 for the first time since July. Reuters reported that BTC declined 9.67% to $55,809 at 03:50 GMT on November 21. The latest move followed a broader retreat in risk assets, with concerns about elevated valuations weighing on the artificial intelligence trade and other market segments.
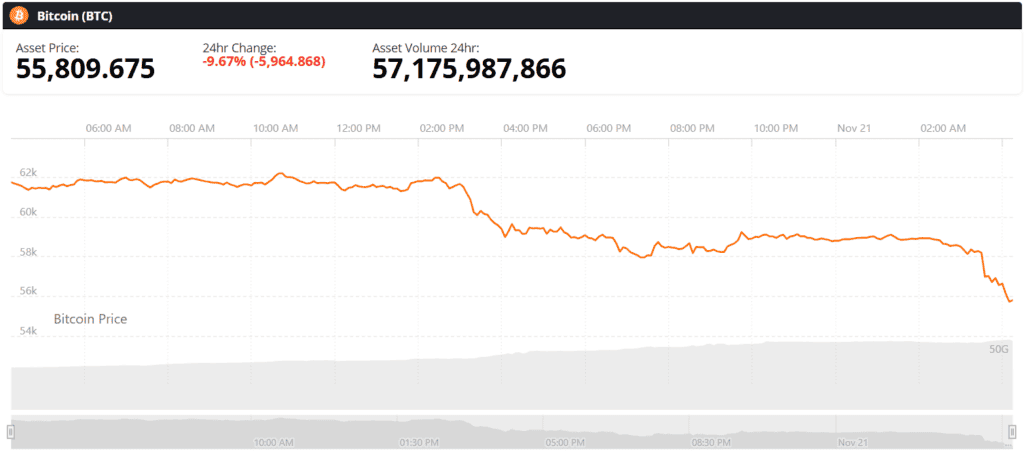
Bitcoin (BTC) price chart. Source: Brave New Coin
The technical picture also points to continued weakness. The TradingView analysis recorded 16 sell signals, seven neutral readings, and only three buy signals across its combined indicators. Moving averages were particularly bearish, with 14 sell signals, one neutral reading, and no buy signals. This alignment suggests that Bitcoin's downtrend extends beyond a short-term price correction.
Several momentum indicators reinforce that assessment. The Relative Strength Index (RSI) on the 14-day setting stood at 18, indicating deeply oversold conditions. The Commodity Channel Index (CCI) reached -127, while Williams Percent Range fell to -93. These readings suggest that selling may be approaching exhaustion, although they do not independently establish a price reversal.
Meanwhile, the MACD remained negative at -5,033, and the Momentum indicator registered -15,050. Both readings point to persistent downward pressure. The Average Directional Index (ADX) at 46 also indicates a strong prevailing trend, supporting the view that the bearish structure remains firmly established.
Bitcoin's moving averages provide further evidence of the weakness. The 10-day exponential and simple moving averages stood near $64,088 and $64,125, respectively. Longer-term averages were positioned considerably higher, with the 50-day EMA near $73,842 and the 200-day EMA around $75,217. These levels represent potential recovery barriers if buyers attempt to regain control.
The supplied classic pivot analysis identified $58,181 as an important support reference. However, with the later Bitcoin quote already below that level, traders need to reassess the pivot structure against updated price data. On the upside, the $64,000 area represents an initial resistance zone based on the short-term moving averages.
Ethereum Price Plunges Over 10% as $1,543 Support Comes Into Focus
Ethereum (ETH) experienced an even sharper decline, with one CoinGlass market snapshot showing the cryptocurrency at $1,543.46, down 10.69% over 24 hours. Its recorded intraday range extended from $1,539.90 to $1,762.80. A subsequent market update showed ETH recovering toward $1,618, illustrating how quickly prices have moved during the selloff.
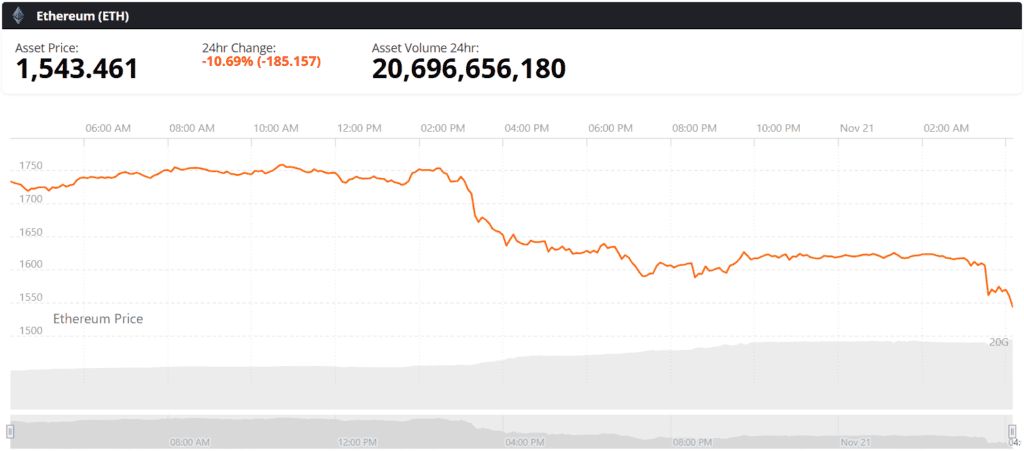
Ethereum (ETH) price chart. Source: Brave New Coin
The TradingView technical analysis classified Ethereum's overall position as Strong Sell. The combined indicator summary recorded 16 sell signals and 10 neutral readings, with no buy signals. Moving averages accounted for 14 sell signals and one neutral reading, while the oscillator group remained predominantly neutral.
Ethereum's momentum indicators also reflect the scale of the decline. The 14-day RSI stood at 18.9, placing it well below the traditional oversold threshold of 30. The Stochastic %K reached 6.8, while the CCI registered -133.8. These readings indicate substantial downward pressure and the possibility of a temporary recovery if selling activity slows.
However, the MACD at -170.8 and Momentum indicator at -450.1 continued to generate sell signals. The ADX reading of 41.7 suggests that the prevailing trend remains strong rather than reflecting ordinary sideways price movement. As a result, the oversold readings have not yet provided sufficient confirmation of a bullish reversal.
Ethereum is also trading considerably below its key moving averages. The 10-day EMA and SMA stood near $1,833 and $1,838, respectively, while the 20-day EMA was positioned around $1,975. The 50-day EMA near $2,181 and 200-day EMA around $2,262 highlight the distance ETH would need to recover before its broader technical structure begins to improve.
The $1,550–$1,580 area is an important near-term zone to monitor, given the recent trading range. A sustained move below this region could expose Ethereum to further losses. Conversely, the Hull Moving Average near $1,697 represents an initial recovery hurdle, followed by resistance around the $1,833–$1,838 moving-average cluster.
XRP Price Tests $0.87 Support as Oversold Readings Emerge
XRP (XRP) has also experienced persistent selling, with the price falling below the $1.00 level and approaching an important technical support region. A previous technical snapshot placed XRP near $0.8710, while subsequent market data showed the token recovering toward $0.91. Its November 20 trading session recorded a low around $0.865, keeping the $0.87 support zone in focus.
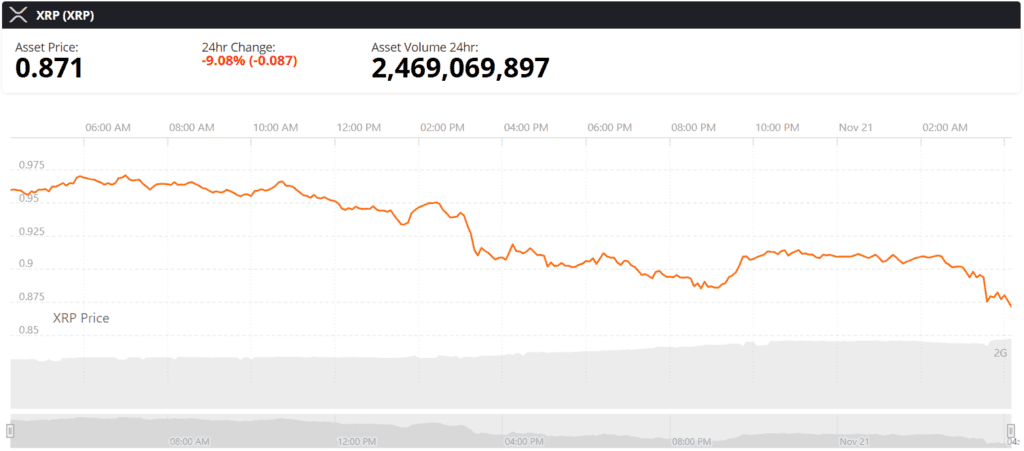
XRP price chart. Source: Brave New Coin
The broader trend remains bearish despite some improvements in short-term momentum readings. The TradingView daily technical assessment showed a Sell rating, while the hourly, four-hour, and weekly timeframes also leaned toward Sell or Strong Sell. This reflects the pressure affecting XRP across multiple trading periods.
The 14-day RSI stood near 25.42, indicating oversold conditions. The Stochastic %K was around 11.97, while Williams Percent Range reached approximately -92.46. These readings suggest that XRP has experienced substantial selling and could enter a consolidation phase if buyers return.
However, its moving averages continue to indicate a weak market structure. The 10-day simple moving average was near $0.9618, while the corresponding exponential average stood around $0.9727. Longer-term averages were positioned substantially higher, including the 50-day SMA near $1.24 and the 100-day SMA around $1.31.
The MACD and Momentum indicators also remained negative, highlighting the difference between short-term oversold conditions and the broader downward trend.
Classic pivot calculations identify $0.8718 as the first notable support level, followed by $0.8343 and $0.7469. On the upside, the central pivot sits near $0.9217, with initial resistance around $0.9592. A sustained move above these levels would help reduce immediate bearish pressure, while a break below $0.8718 could expose XRP to additional selling.
Crypto Market Outlook: Oversold Conditions Face Persistent Selling Pressure
Bitcoin, Ethereum, and XRP are displaying similar technical characteristics despite differences in their recent price movements. All three assets are trading below their principal moving averages, while negative MACD and momentum readings continue to indicate downward pressure.
The oversold readings across their RSI and other oscillators deserve attention. Bitcoin's RSI near 18, Ethereum's at 18.9, and XRP's around 25.42 suggest that recent selling has pushed momentum toward historically weak territory. Such conditions can precede a temporary rebound, but they do not guarantee that prices have reached a durable bottom.
The key distinction is that moving averages continue to favor sellers. Bitcoin faces recovery barriers beginning around $64,000, Ethereum must reclaim levels near $1,697 and $1,833, while XRP needs to move above its $0.92–$0.96 resistance region to improve its short-term outlook.
For now, the immediate focus remains on price stabilization. Bitcoin's ability to recover above $60,000, Ethereum's response around $1,550, and XRP's defense of the $0.87 region will help determine whether the current decline begins to slow or develops into another leg lower.
The technical readings reflect historical price behavior and can change quickly as new trading data becomes available. Until stronger buying activity and confirmation across multiple timeframes emerge, the broader market structure continues to favor a cautious outlook.