

AMZN
#5
Amazon.com, Inc. - Common Stock
271.5 8 USD
+0.15%
Settore: Beni di Consumo Ciclici
Base: USD
Valuta di Profitto: USD
Intervallo Giornaliero
Intervallo Annuale
Variazione giornaliera
+15.32%
Variazione Mensile
+11.39%
Variazione di 6 mesi
+13.77%
Variazione Annuale
+22.29%
Chiusura Precedente
235.5 0
Open
271.4 9
Minimo
271.4 7
High
271.5 8
Volume
845
Financials
2026
Current report, Q3 FY2026
AMAZON COM INC current report, Q3 FY2026
8-K
Current report, Q3 FY2026
AMAZON COM INC current report, Q3 FY2026
8-K
Quarterly report, Q2 FY2026
AMAZON COM INC quarterly report, Q2 FY2026
10-Q
Current report, Q2 FY2026
AMAZON COM INC current report, Q2 FY2026
8-K
Current report, Q2 FY2026
AMAZON COM INC current report, Q2 FY2026
8-K
Current report, Q2 FY2026
AMAZON COM INC current report, Q2 FY2026
8-K
Current report, Q2 FY2026
AMAZON COM INC current report, Q2 FY2026
8-K
Current report, Q2 FY2026
AMAZON COM INC current report, Q2 FY2026
8-K
Current report, Q2 FY2026
AMAZON COM INC current report, Q2 FY2026
8-K
Institutional holdings, Q1 FY2026
AMAZON COM INC institutional holdings, Q1 FY2026
13F-HR
Notizie
La volatilità rotazionale dovrebbe rallentare nelle prossime settimane: GS
Dopo CINQUE guadagni superiori al 50% a luglio, la nuova lista AI per agosto è ora disponibile
Le azioni della settimana secondo Investing.com
Benchmark alza il target su Amazon a $400 grazie alla crescita di AWS
UBS alza il target su Amazon a $318 grazie alla crescita AI di AWS
TD Cowen alza il target su Amazon a $350 grazie alla crescita di AWS
Cantor Fitzgerald abbassa il target su Amazon a $320 per valutazione
Truist alza il target su Amazon a $350 grazie alla crescita del cloud
NVIDIA e mercati del debito: allarme per i 250 miliardi di rischio IA
RBC Capital alza il target su Amazon a $330 grazie alla crescita di AWS
KeyBanc alza il target su Amazon a $350 grazie alla domanda AI
JPMorgan alza il target su Amazon grazie all’accelerazione di AWS
Grafici & Idee
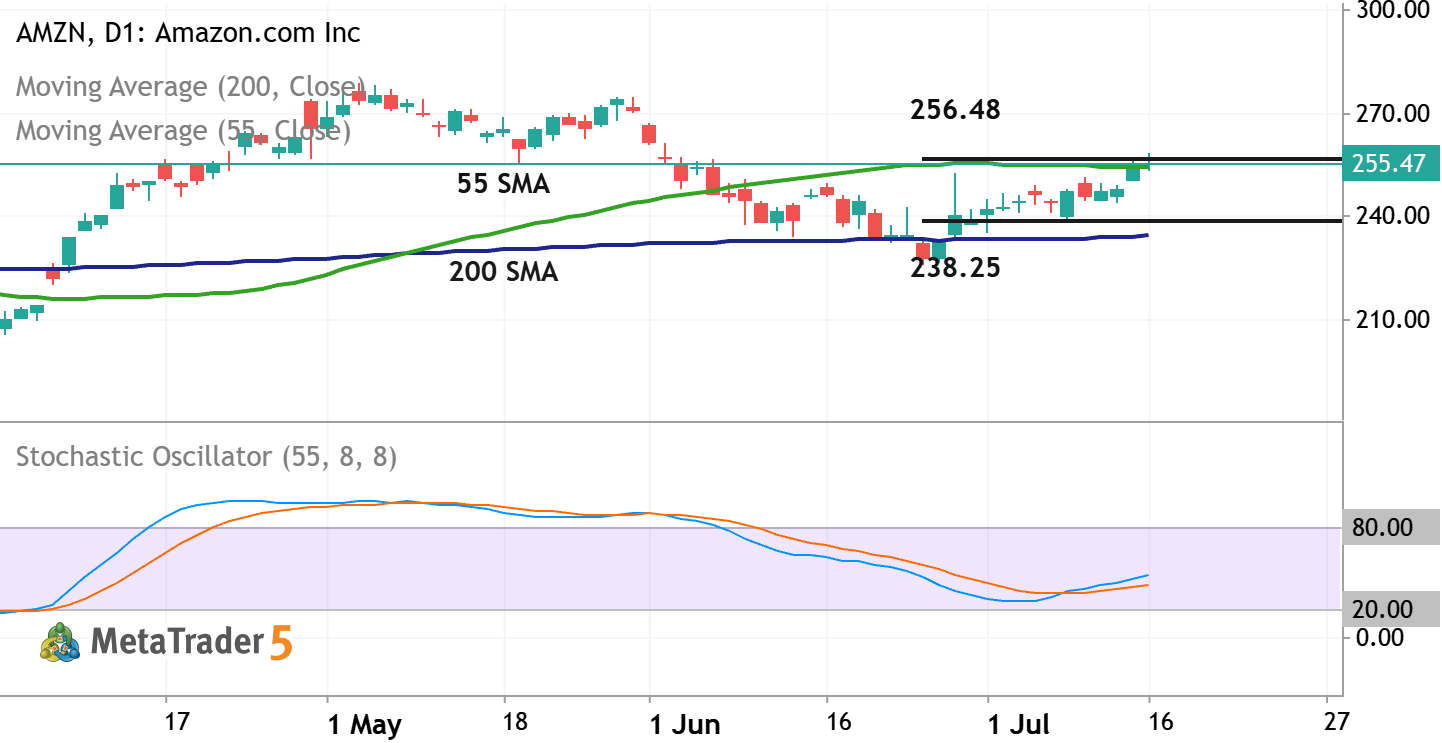
AMZN - Daily Trading Forecast
Daily price is located above 200 SMA in the bullish area of the chart. The Stochastic oscillator is showing the uptrend to be started by crossing the 50 level to above, and the price is trying to break the resistance level at 256.48 together with 55 SMA to above for the strong bullish trend to be continuing. If the price breaks resistance at 256.48 together with 55 SMA to above so the primary bullish market condition will be continuing for daily price. If the price crosses support level at 238.25 together with 200 SMA to below so the primary bearish reversal will be started. Alternatively, the price will be on secondary ranging above 200 SMA to be inside s/r levels waiting for direction of the strong trend tioo be started. Trading Summary : bullish ranging for direction.
0 
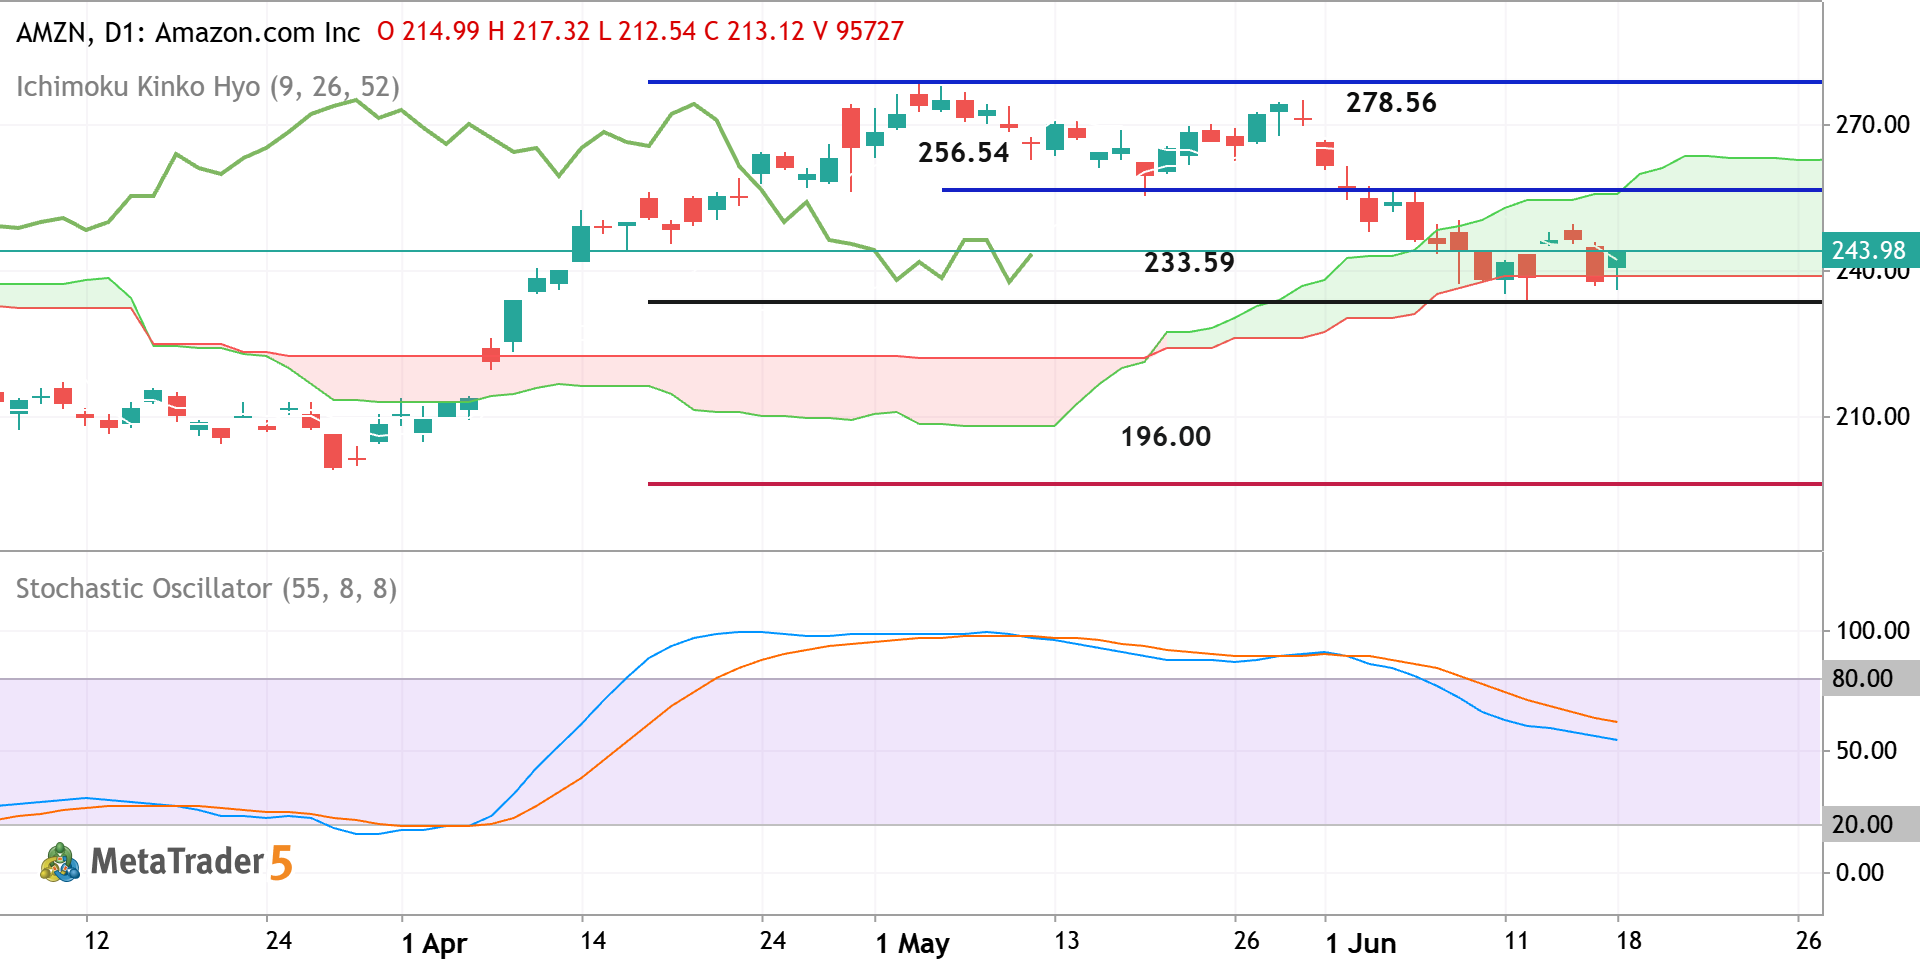
AMZN - Breakdown with the Possible Bearish Reversal
Daily price is located near and inside Ichimoku cloud for trying to break the support level at 233.59 to below for the primary bearish reversal to be started. Chinkou Span line of Ichimoku indicator broke the historical price to below for the strong breakdown to be started for the possible bearish reversal of the daily price movement. If the price crosses the 233.59 support ot below so we may see the primary bearish reversal with 196.00 as a possible target. If the price breaks the resistance at 256.54 to above so the primary bullish trend will be resumed with 278.56 target to re-enter, Alternatively, the price will be on secondary ranging to be inside and near the Ichimoku cloud waiting for direction. Trading Summary : breakdown with the possible bearish reversal
1 
The AMZN doesn’t have other trading ideas at this time
Browse ready-made trading ideas or select a symbol and create your own
Go to Charts and Trading Ideas