

NVDA
#1
NVIDIA Corporation - Common Stock
229.2 8 USD
-0.01%
Market Price
Settore: Tecnologia
Base: USD
Valuta di Profitto: USD
Intervallo Giornaliero
Intervallo Annuale
Variazione giornaliera
-0.52%
Variazione Mensile
+8.62%
Variazione di 6 mesi
+23.26%
Variazione Annuale
+21.98%
Chiusura Precedente
230.4 8
Open
233.8 8
Minimo
229.1 1
Massimo
233.8 9
Financials
2026
Current report, Q2 FY2026
NVIDIA CORP current report, Q2 FY2026
8-K
Quarterly report, Q1 FY2027
NVIDIA CORP quarterly report, Q1 FY2027
10-Q
Current report, Q2 FY2026
NVIDIA CORP current report, Q2 FY2026
8-K
Institutional holdings, Q1 FY2026
NVIDIA CORP institutional holdings, Q1 FY2026
13F-HR
INFORMATION TABLE, Q1 FY2026
NVIDIA CORP INFORMATION TABLE, Q1 FY2026
INFORMATION TABLE
Current report, Q1 FY2026
NVIDIA CORP current report, Q1 FY2026
8-K
Current report, Q1 FY2026
NVIDIA CORP current report, Q1 FY2026
8-K
Annual report, FY2026
NVIDIA CORP annual report, FY2026
10-K
Current report, Q1 FY2026
NVIDIA CORP current report, Q1 FY2026
8-K
2025
Current report, Q4 FY2025
NVIDIA CORP current report, Q4 FY2025
8-K
Notizie
Nuvacore, sostenuta da Sequoia, punta a una valutazione di 2,5 miliardi
5 grandi mosse degli analisti sull’AI: Google confermata top pick dopo il lancio dell’agente Gemini
Borse oggi | Wall Street | Apertura in rialzo con OpenAI e petrolio in calo
UBS mantiene il target di $300 su Nvidia grazie ai dati export di Taiwan
I futures del TSX salgono leggermente in attesa dei dati sull’occupazione
Borsa Usa, futures in rialzo su calo petrolio, telecom sotto pressione
Nvidia pianifica un investimento nel rivale di chip AI d-Matrix
Firmus Grid, sostenuta da Nvidia, rinvia la IPO in Australia
Borsa Usa in calo, rialzo rendimenti e petrolio alimenta timori inflazione
70 milioni di bambini hanno appena ricevuto i conti Trump. Il vero vincitore potrebbe essere State Street
Nvidia si impegna a investire 1 miliardo di dollari nella ricerca scientifica statunitense
Grafici & Idee
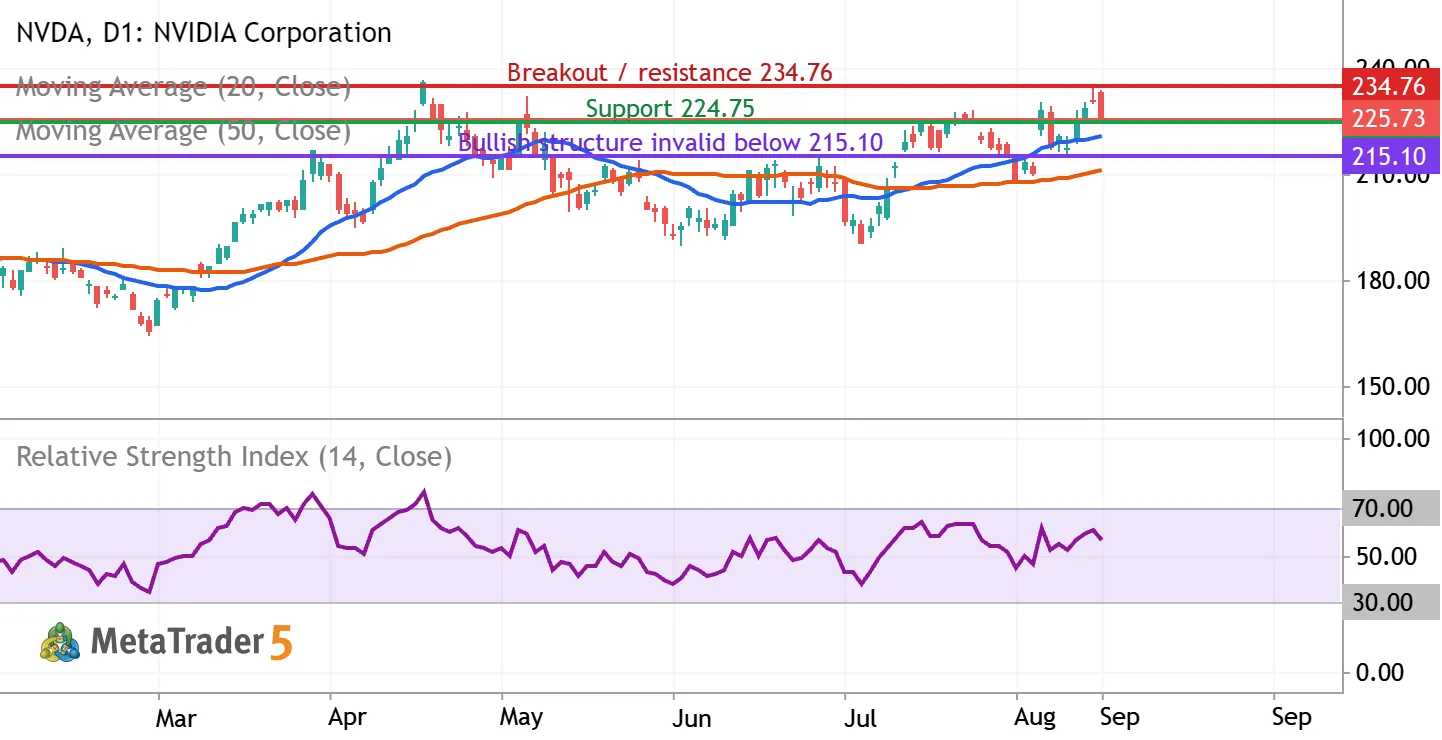
NVDA: testing $225 support as the uptrend meets $234.76 resistance
NVIDIA (NASDAQ: NVDA) | Daily chart | September 9, 2026 Bias: conditionally bullish over the next 2–6 weeks. Entry confirmation is still required. The latest completed regular session, September 8, closed at $225.73, down 2.01%, after reaching $233.71 intraday. The close near the session low signals selling pressure despite the broader recovery. What the indicators show The chart includes a blue 20-day simple moving average, an orange 50-day simple moving average, and purple RSI(14), all calculated from closing prices. At the latest completed candle, MetaTrader showed the averages near $220.48 and $211.22, with RSI near 56.19. Price remains above both rising averages, and the 20-day average is above the 50-day average. RSI above 50 supports positive momentum, but its reading below 70 is


The NVDA doesn’t have other trading ideas at this time
Browse ready-made trading ideas or select a symbol and create your own
Go to Charts and Trading Ideas