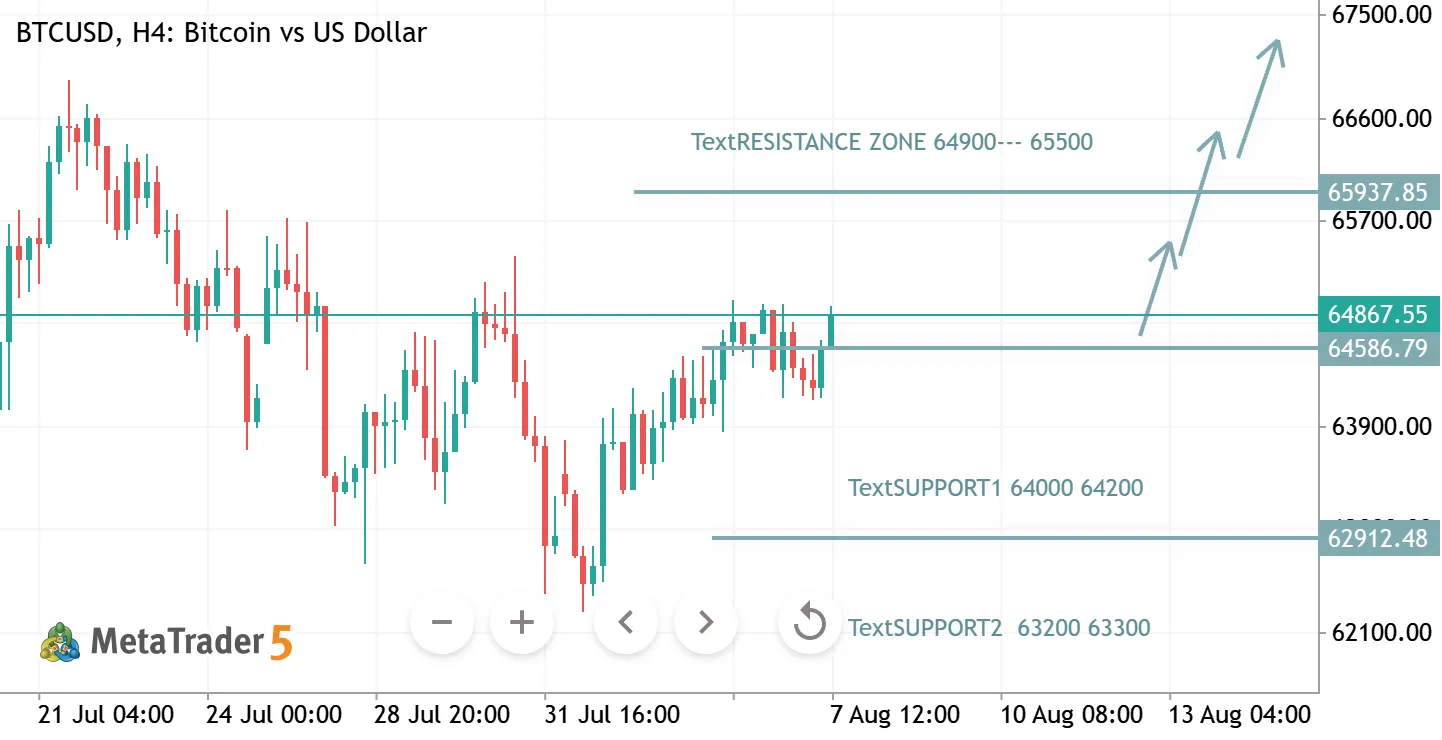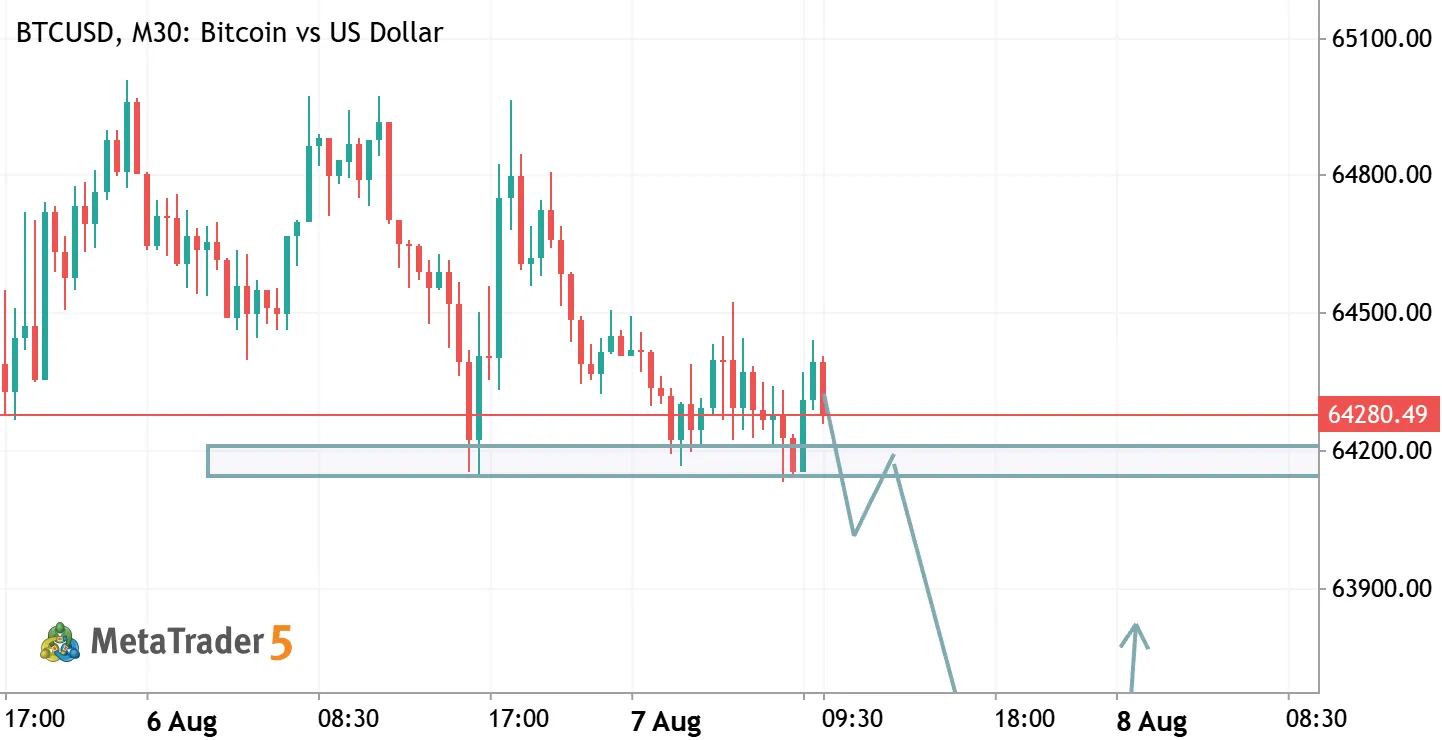
BTCUSDT — Long at Demand Rejection [Quantum Algo] BTCUSD Long Bitcoin vs US Dollar
BTCUSDT — Long at Demand Rejection [Quantum Algo]
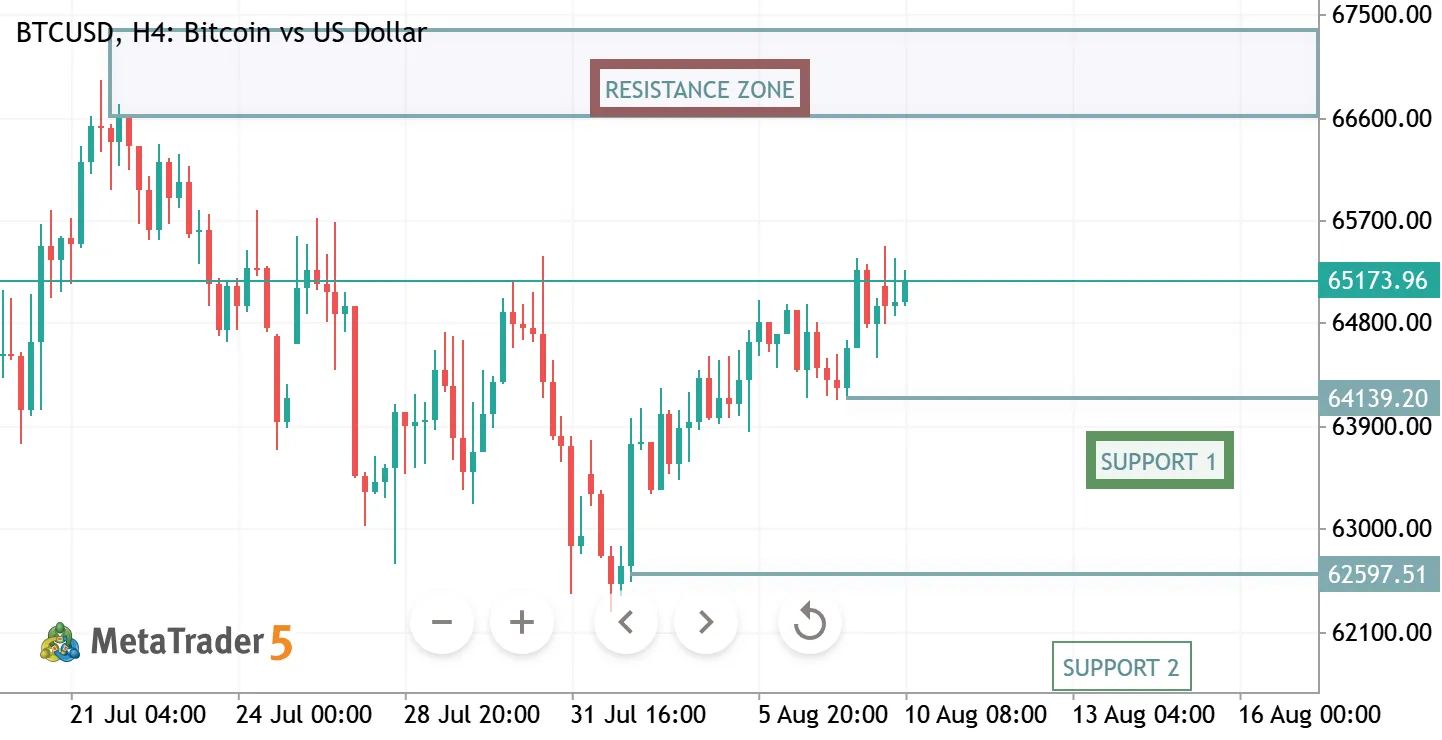
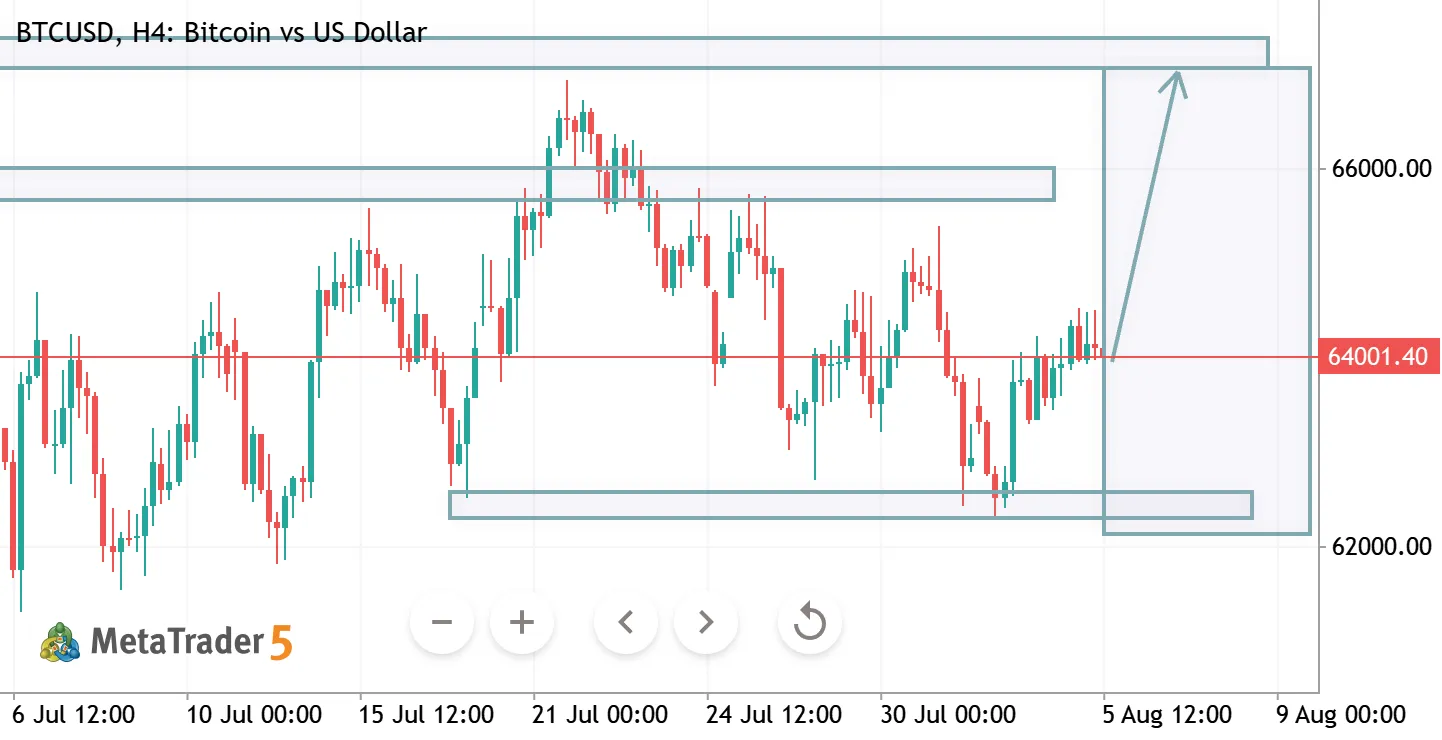
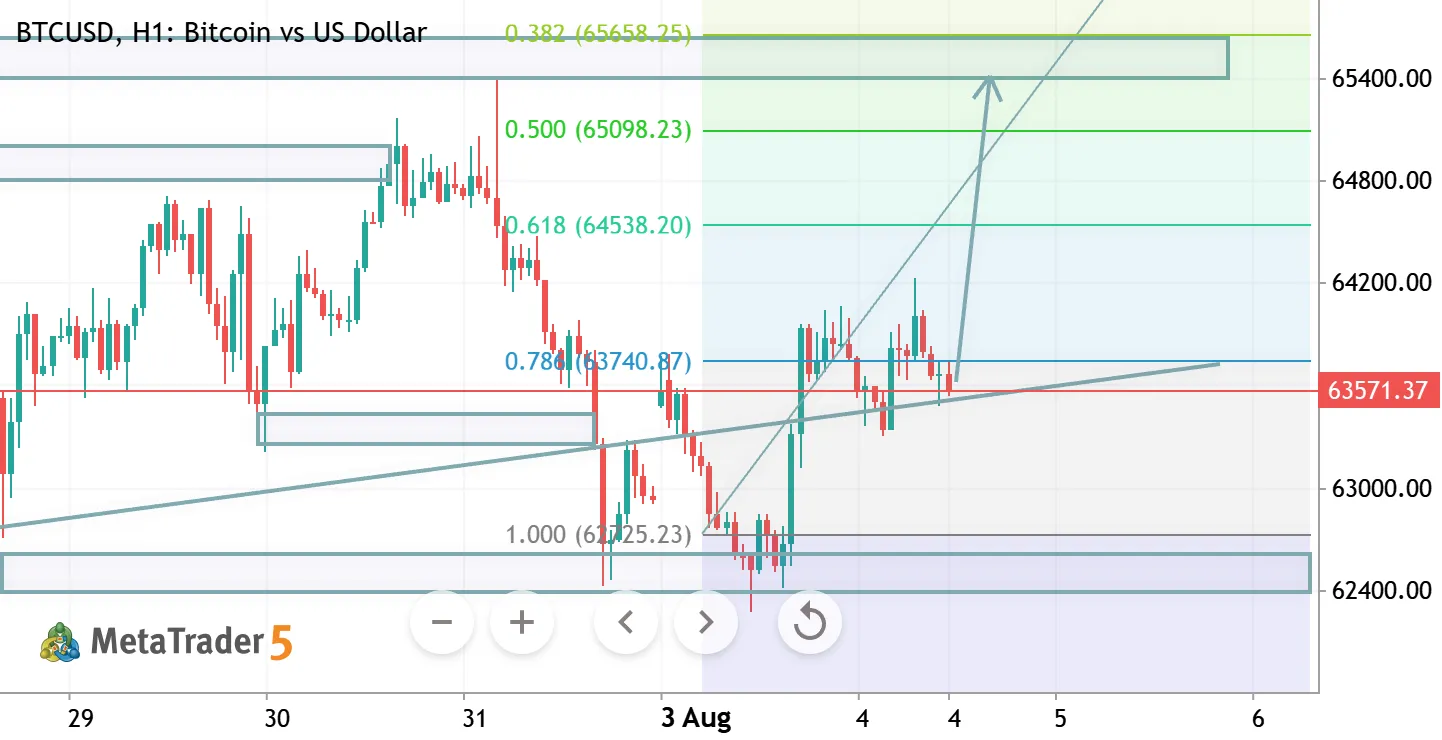
BTC swept the range lows into 58,434, reclaimed hard, and has been building higher lows back up through the range. Price pulled into a higher demand shelf near 62,600 and held, firing the Buy. This is a continuation long: the sweep-and-reclaim flipped the structure bullish, momentum is carrying, and the play is to buy the shallow pullback into demand and ride the next leg toward the range highs. Why this setup works — three confluences: Demand holding above the reclaim. Since the sweep of the range low, every pullback has been bought at a higher level. Price tapped this demand shelf and held instead of breaking down — the Buy printed on the reaction, with a defined floor to lean risk against rather than chasing the move. Higher-low structure off the sweep. The reclaim of the range low set
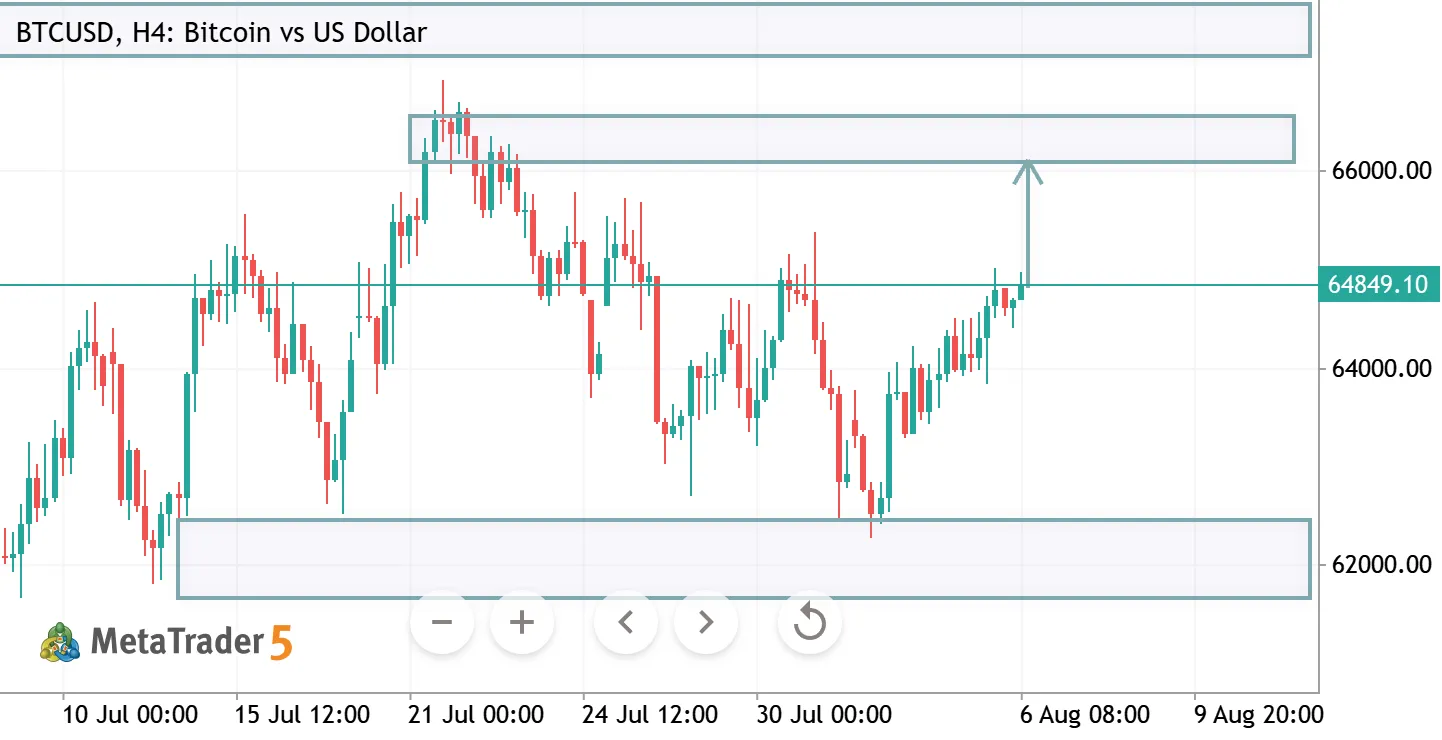
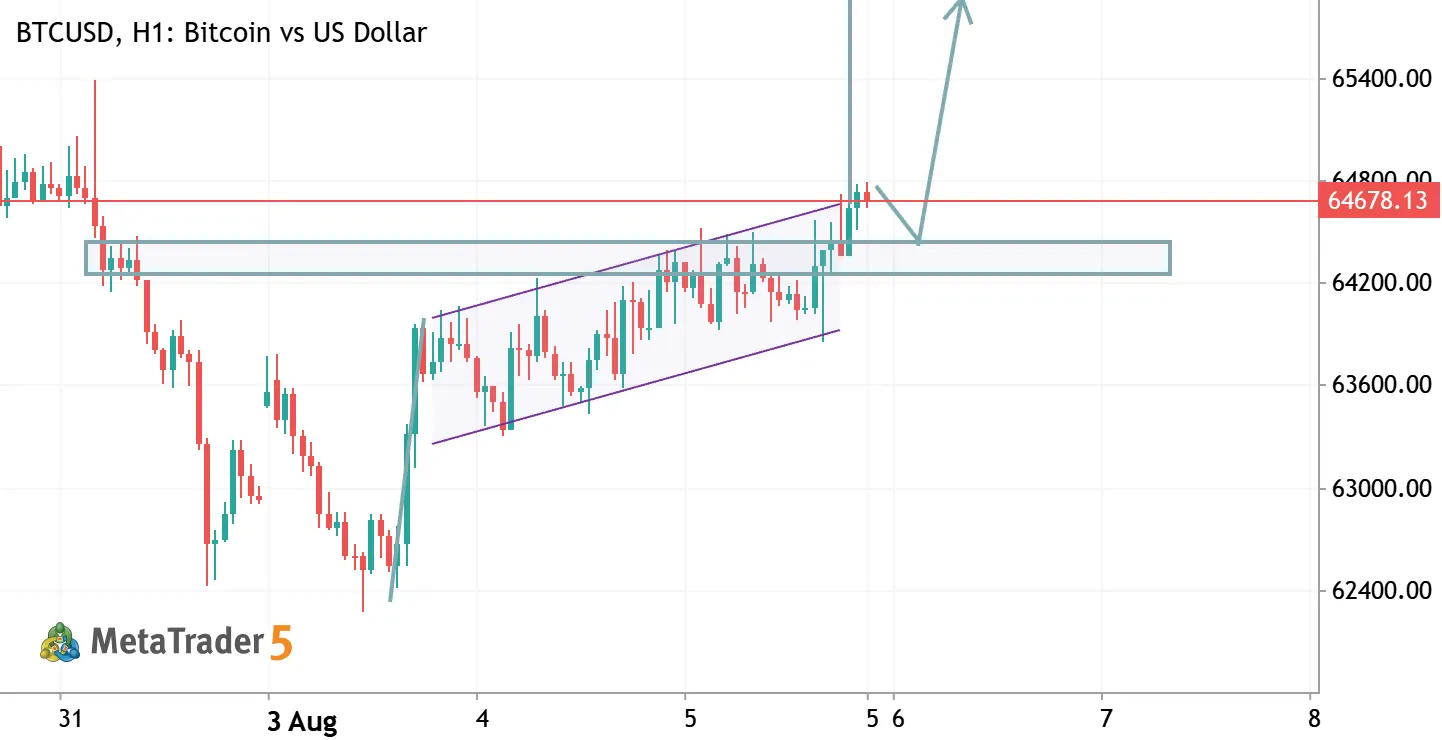
BTCUSDT — Bullish Range Reclaim Forecast [Quantum Algo] BTCUSD Bitcoin vs US Dollar
BTCUSDT — Bullish Range Reclaim Forecast [Quantum Algo]
BTC has been rotating in a well-defined 59K–67K range for weeks. Twice now price has probed below the 59K floor, swept resting liquidity under the range, and snapped straight back inside — the textbook bear-trap signature. Each sweep failed to find continuation sellers, and price is now pushing back into the upper half of the range with momentum turning up. This is a forecast for a bullish continuation: reclaimed support, trapped shorts overhead as fuel, drawing toward the range highs. Why this setup works — three confluences: Double liquidity sweep and reclaim. Two clean stabs below the 59K floor, both rejected and recovered inside the range. When a level gets swept twice with no downside follow-through, it signals the sellers underneath have been absorbed — the stops are taken and the
BNBUSDT — Short at Supply Rejection [Quantum Algo] BNBUSD Short Binance Coin (USD)
BNBUSDT — Short at Supply Rejection [Quantum Algo]
BNB rallied hard off the 536 lows, climbing through the 550 mid-range and pushing straight into an overhead supply block near 566. Price stalled at the top of the run and printed the Sell at 561.8. This is a mean-reversion short: the leg up ran into resistance without a pullback, and the play is to fade the exhaustion back toward the 550 shelf where prior structure sits. Why this setup works — three confluences: Supply rejection into resistance. The rally pushed into an overhead supply zone and stalled instead of breaking clean through. That's where sellers step in — the reaction printed on the tap, not on a guess, and it gives a defined ceiling to lean risk against. Extended move with no pullback. Price ran roughly 25 handles off the low in a near-vertical push. Moves this stretched
btcusd h1 analysis BTCUSD Bitcoin vs US Dollar
btcusd h1 analysis
BTCUSD | H1 Analysis Price remains under bearish trendline resistance, keeping sellers in control. A rejection from the resistance zone suggests another move toward lower support if bulls fail to reclaim the trendline. Watch for a breakout above resistance before considering a bullish shift. Bias: Bearish 📉 Key Levels: Resistance: 59,300–59,500 | Support: 58,100–57,800 Trade Safe – Wait for Confirmation.
BTCUSD TRADE IDEA BTCUSD Long Bitcoin vs US Dollar
BTCUSD TRADE IDEA
BTCUSD (H1) Trade Analysis – Bullish Bias Market Structure Price is trading inside a descending wedge , a pattern that often precedes a bullish breakout. Buyers have defended the 58,000–58,800 support area several times. Short-term momentum remains weak until the wedge resistance is broken. Buy Setup Entry Zone: 58,500–59,000 (after bullish confirmation) Stop Loss: Below 57,950 Take Profit 1: 60,300–60,600 Take Profit 2: 61,800–62,100 Take Profit 3: 63,500–64,000 (if bullish momentum continues) Alternative Scenario If BTC closes below 57,950 , the bullish setup is invalidated. A breakdown could lead to a move toward 57,000 and potentially 56,000 . Trading Plan Wait for a strong bullish rejection from support or a break and close above the wedge resistance before entering. Avoid buying in
BTCUSD H1 ANALYSIS BTCUSD Bitcoin vs US Dollar
BTCUSD H1 ANALYSIS
BTCUSD H1 Analysis BTC is consolidating within a descending structure while holding above a key Fibonacci support zone. Momentum is building, and a breakout could define the next major move. 📈 Bullish Scenario: A confirmed break above 60,700–61,300 may trigger a rally toward 63,900. 📉 Bearish Scenario: If support around 59,000 fails, expect a continuation toward lower demand levels. Bias: Neutral-to-Bullish. Wait for a confirmed breakout before entering. #BTCUSD #Bitcoin #Crypto #TechnicalAnalysis #MQL5 #PriceAction
BTCUSD H1 ANALYSIS BTCUSD Bitcoin vs US Dollar
BTCUSD H1 ANALYSIS
BTCUSD H1 Analysis BTCUSD has reached a key support zone after a sharp bearish move. Price is reacting near the Fibonacci retracement support and showing signs of a potential bullish rebound. A successful hold above the current low could trigger a recovery toward the 61.8%–78.6% Fibonacci resistance area. However, a break below support may extend the downtrend. Bias: Bullish Recovery Above Support Key Resistance: 60,500 – 62,300 Key Support: 58,700 – 59,200 Trade with proper risk management. This analysis is for educational purposes only and not financial advice.
BTCUSD H1 ANALYSIS BTCUSD Bitcoin vs US Dollar
BTCUSD H1 ANALYSIS
BTCUSD H1 Analysis Price has broken below the descending trendline and is testing a key support zone around 62.0k–62.2k. A successful rebound from this area could trigger a corrective move toward 63.0k–64.0k resistance. However, sustained weakness below support may keep bearish pressure intact. Bias: Neutral to Bullish (if support holds) Key Support: 62,000 Key Resistance: 63,000 – 64,000 Trade with proper risk management and wait for confirmation before entry.
BTCUSD H4 ANALYSIS BTCUSD Bitcoin vs US Dollar
BTCUSD H4 ANALYSIS
BTCUSD H4 Analysis Bitcoin has broken out of its short-term bearish structure and is now testing a key resistance zone. The recent bullish momentum suggests buyers remain in control, with potential for a continuation move toward higher liquidity levels if resistance is cleared. 📈 Bias: Bullish 🎯 Targets: 64,000 → 68,000 ⚠️ Key Support: 60,000–61,000 Momentum favors the upside, but a rejection from resistance could trigger a pullback before the next move higher. Manage risk accordingly.
BTCUSD H4 ANALYSIS BTCUSD Bitcoin vs US Dollar
BTCUSD H4 ANALYSIS
BTCUSD Technical Outlook BTC is showing signs of a bullish reversal after breaking out of a descending channel. Price has reclaimed short-term structure and is attempting to build momentum from the recent lows. 📈 Bullish Scenario: A sustained move above 64,500 could accelerate buying pressure toward 67,000–72,000. 🔹 Support: 62,000–63,000 🔹 Resistance: 64,500, 67,000, 72,000 Market Bias: Bullish while price remains above the channel breakout zone. Higher lows suggest buyers are regaining control. Disclaimer: This analysis is for educational purposes only and not financial advice. Always use proper risk management before trading.

BTCUSD TRADE IDEA BTCUSD Bitcoin vs US Dollar
BTCUSD TRADE IDEA
Market Structure: Bearish The chart shows a strong downtrend with consecutive lower highs and lower lows. Heavy selling pressure pushed price from the 81,000 area down toward 61,000–63,000. Recent price action is moving sideways after the sharp drop, indicating consolidation rather than a confirmed reversal. Key Levels Resistance 1: 64,491 Resistance 2: 67,256 Support 1: 61,633 Current Pivot: 62,845 Bullish Scenario A H4 candle close above 64,491 could trigger a recovery move. Target zones: 67,256 Higher resistance if momentum continues. Bearish Scenario Failure to break 64,491 and a close below 61,633 would favor trend continuation. Sellers could target fresh lows below the recent swing low. Trading Idea Buy Setup: Above 64,491 after a confirmed breakout. TP1: 67,256 SL: Below 61,633