BTCUSD: Bearish Continuation Setup After Support Bounce
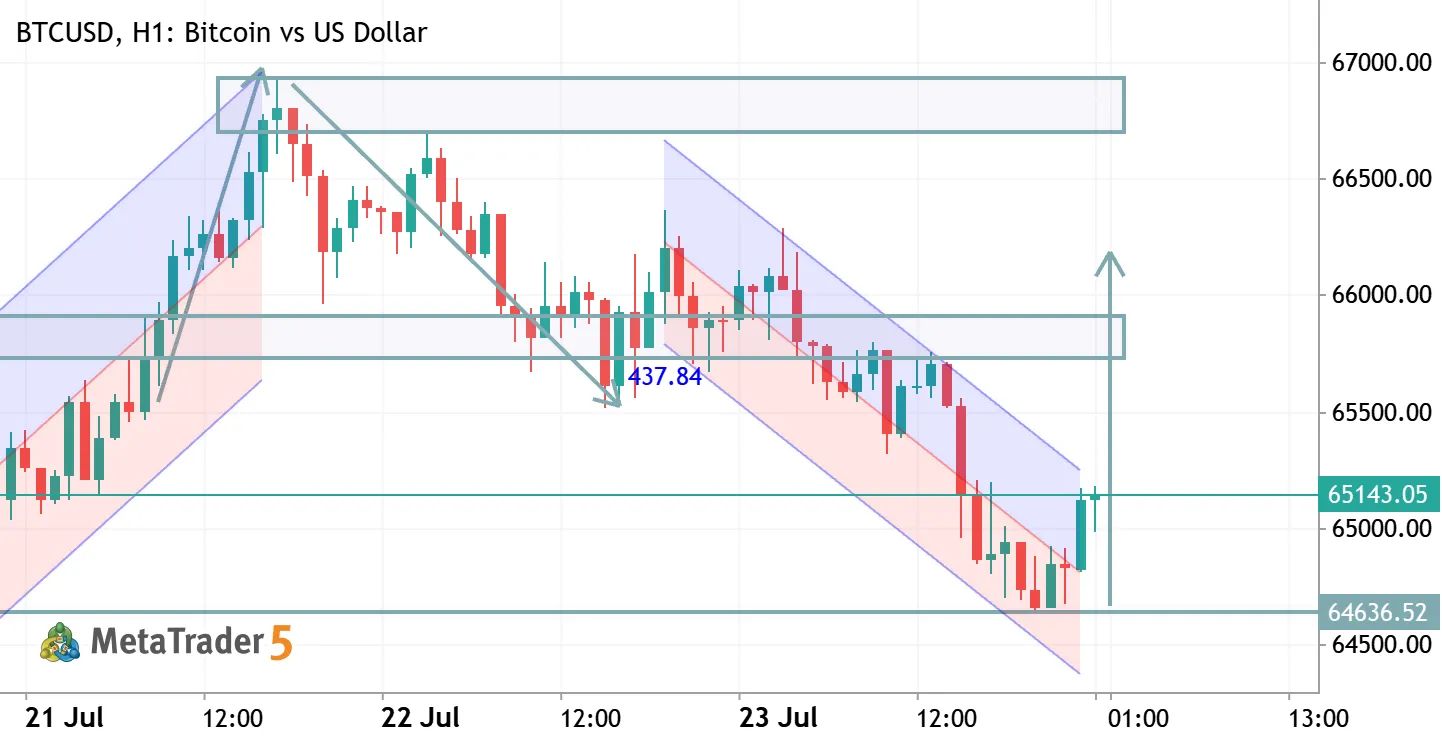
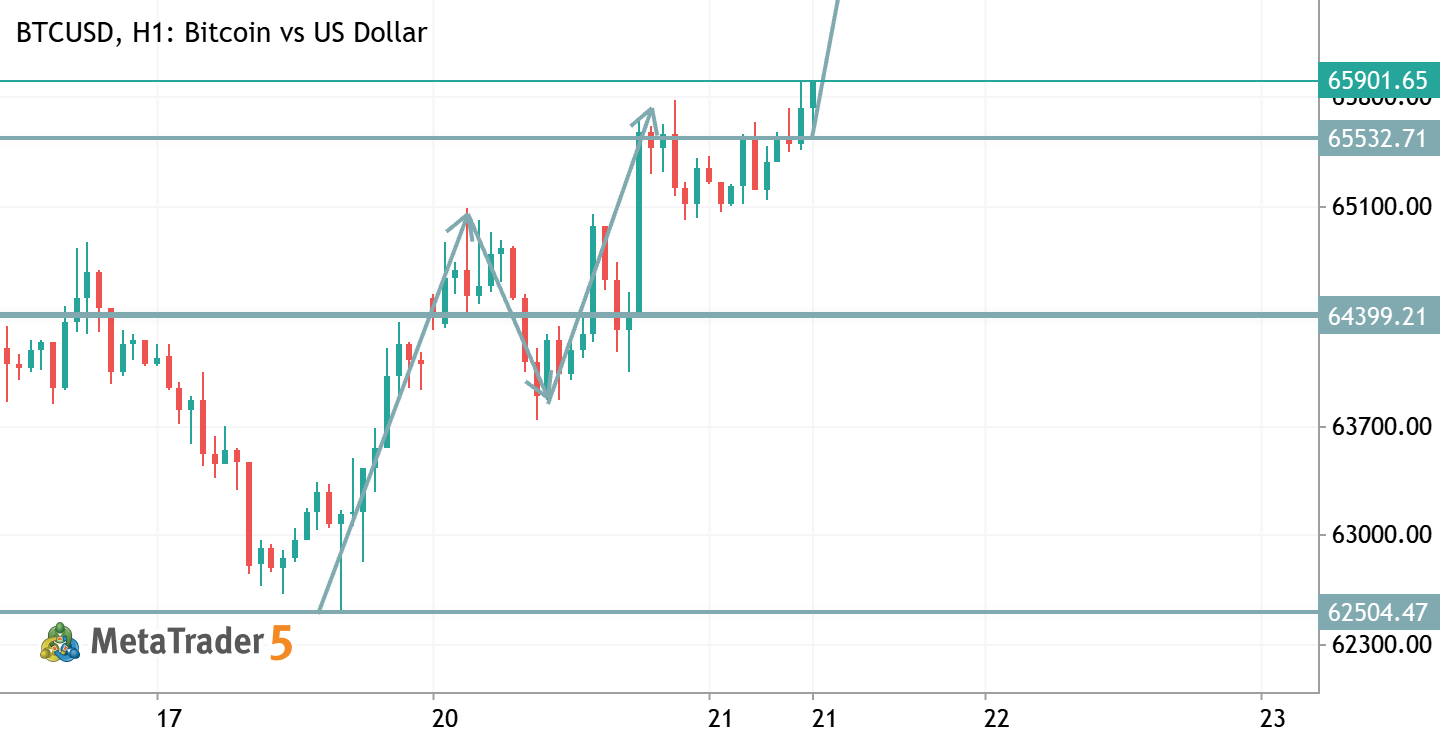
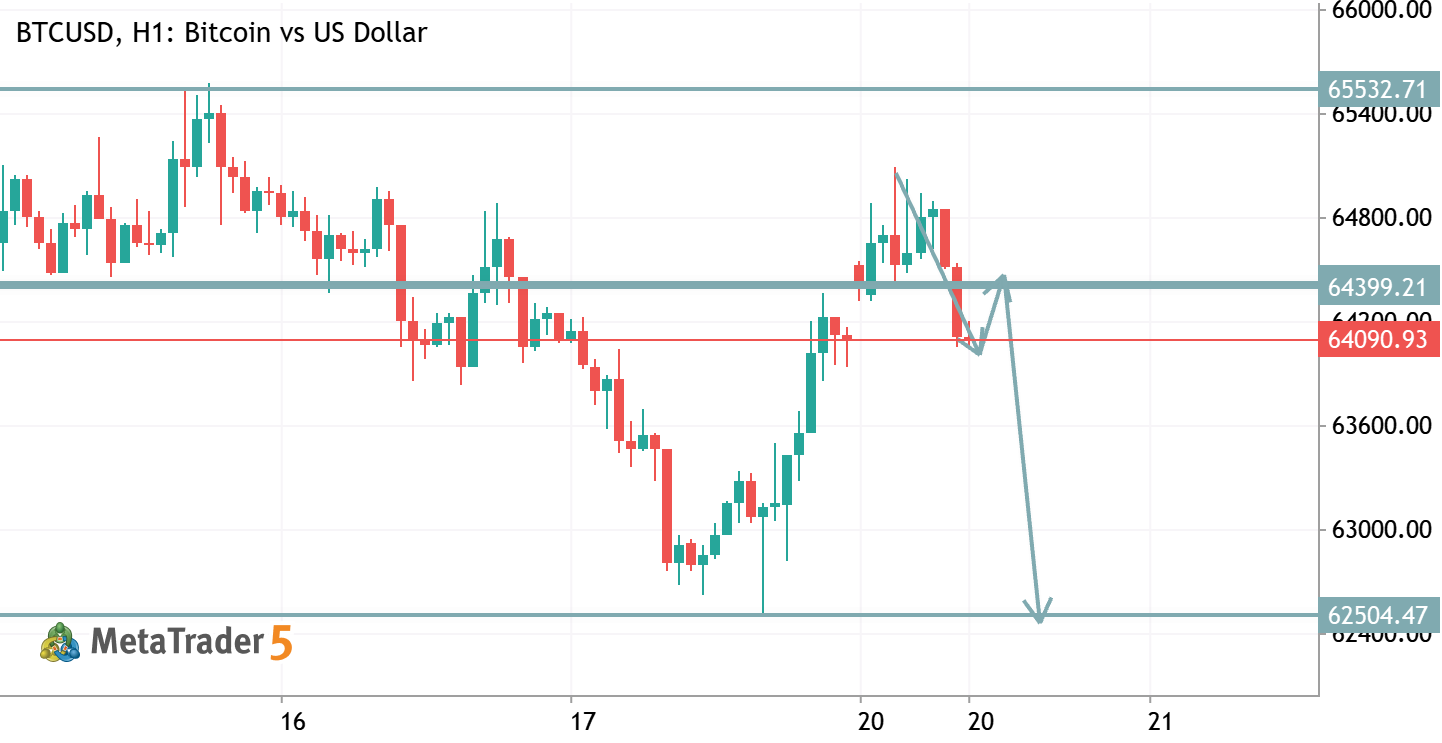
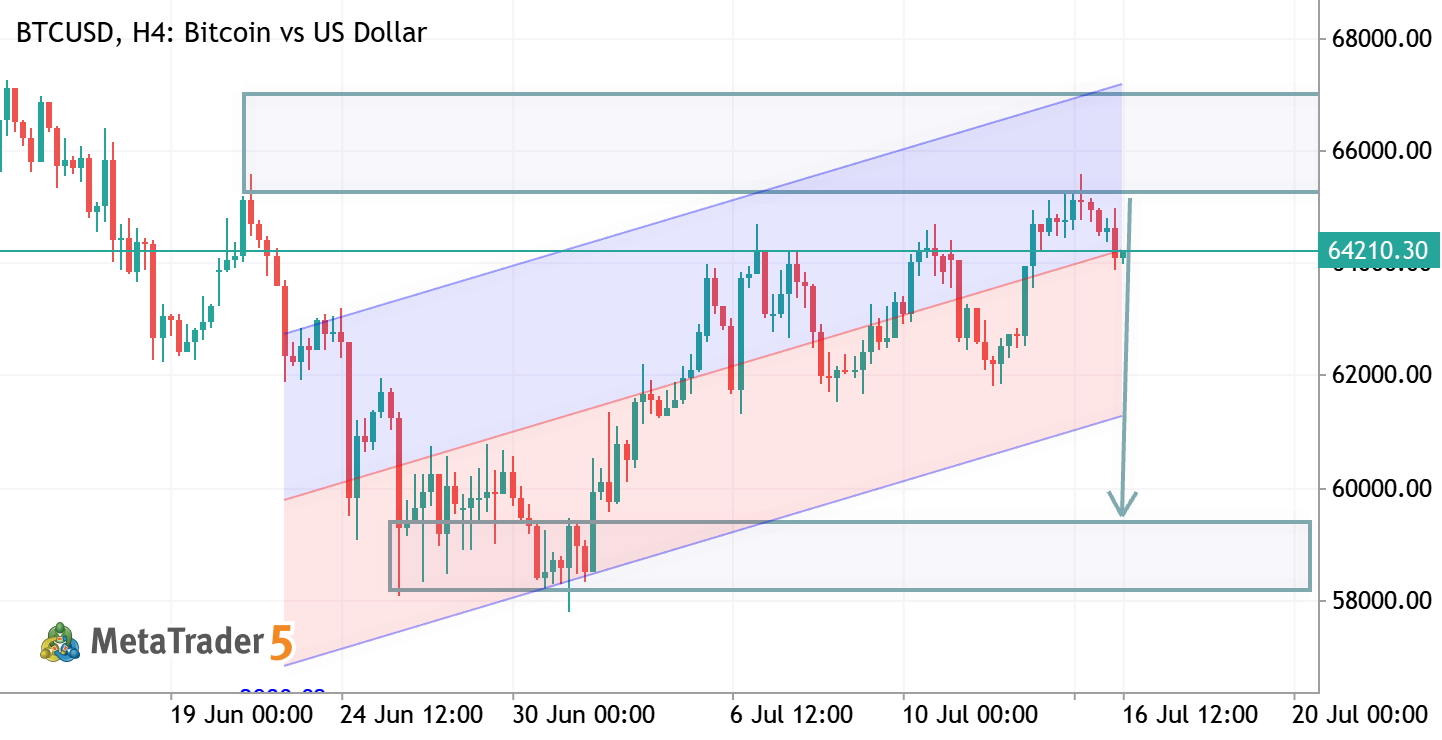
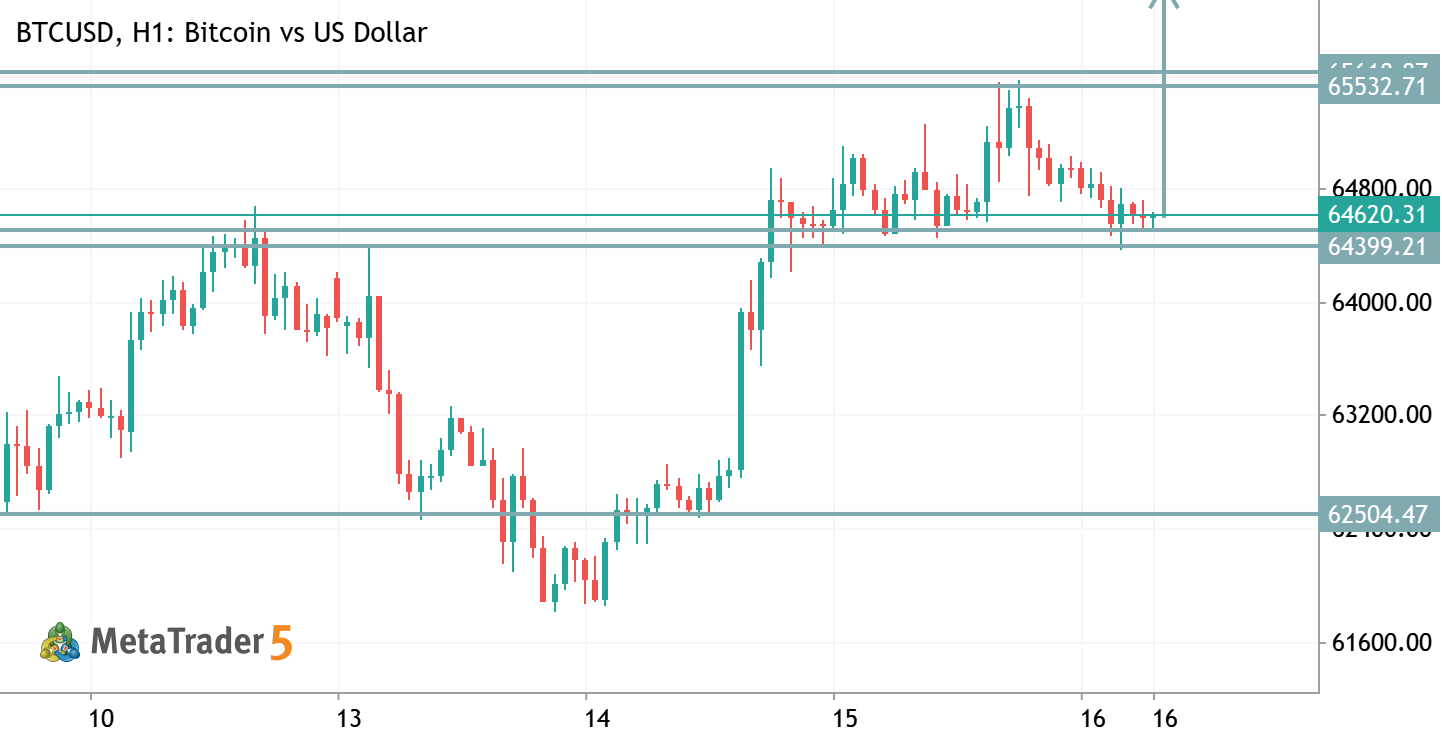
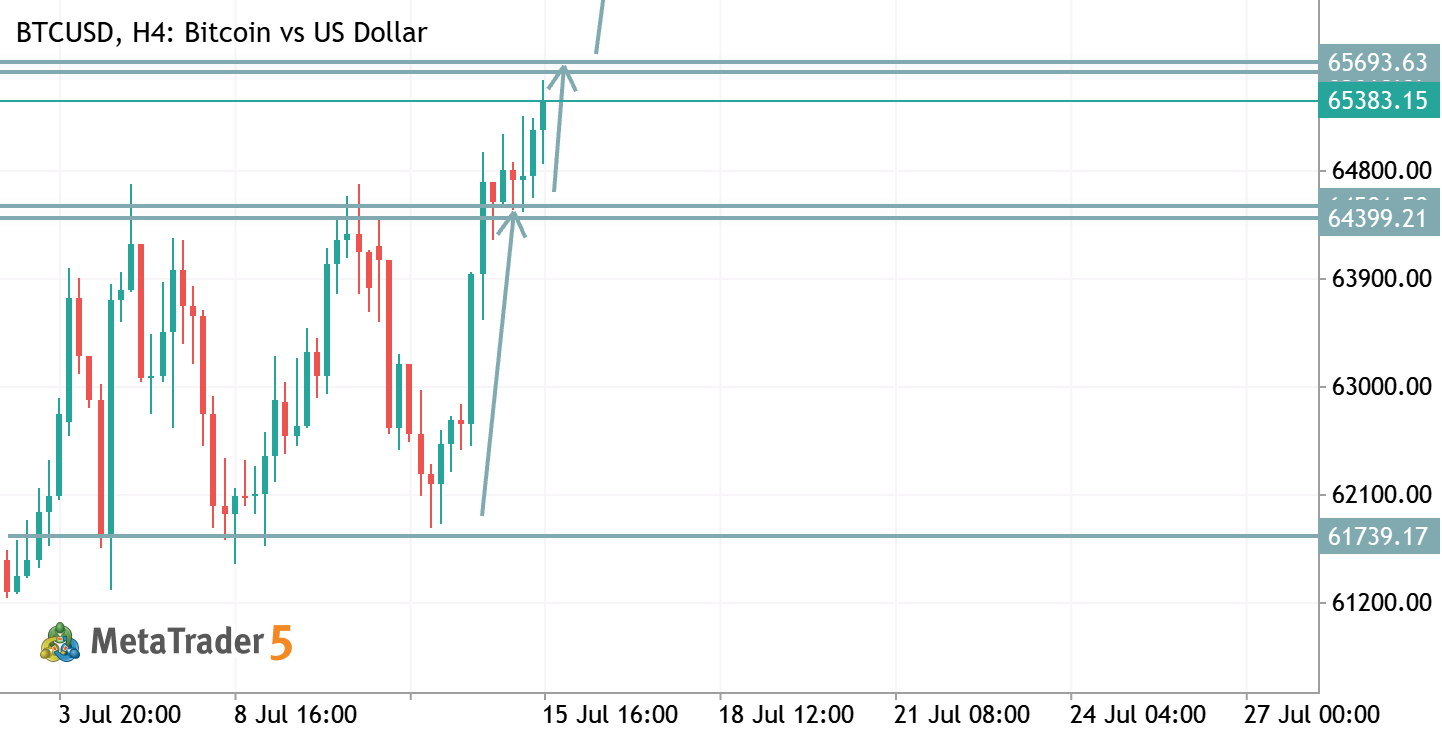
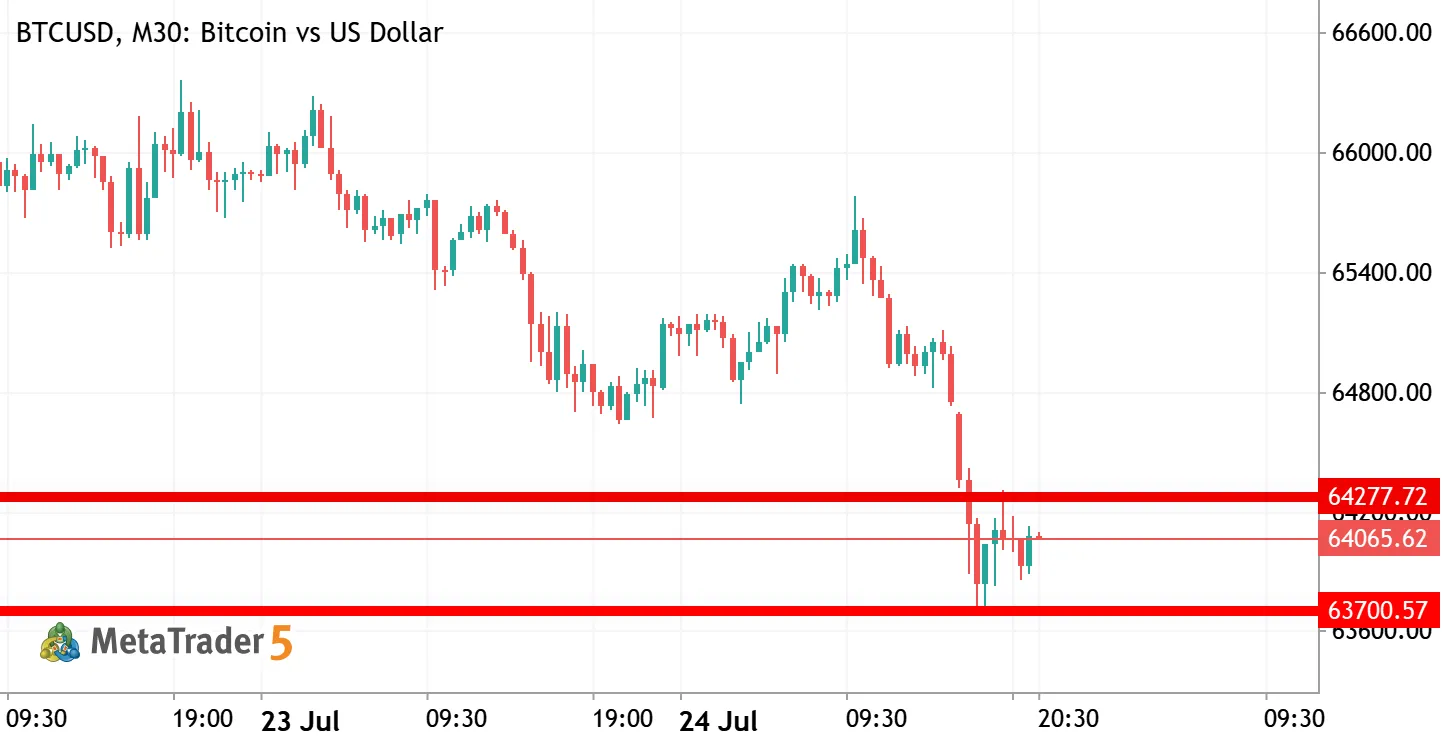
📉 BTCUSD Market Structure Analysis Bitcoin recently bounced from the key support area around 63,700–64,000. However, price is now approaching a previous bullish reaction zone, which may act as resistance after the recent breakdown. I'm watching this area for a possible bearish rejection. If sellers regain control, BTC could continue its downside movement toward lower liquidity areas. Key levels:
🔴 Resistance / rejection zone: Previous bullish reaction area
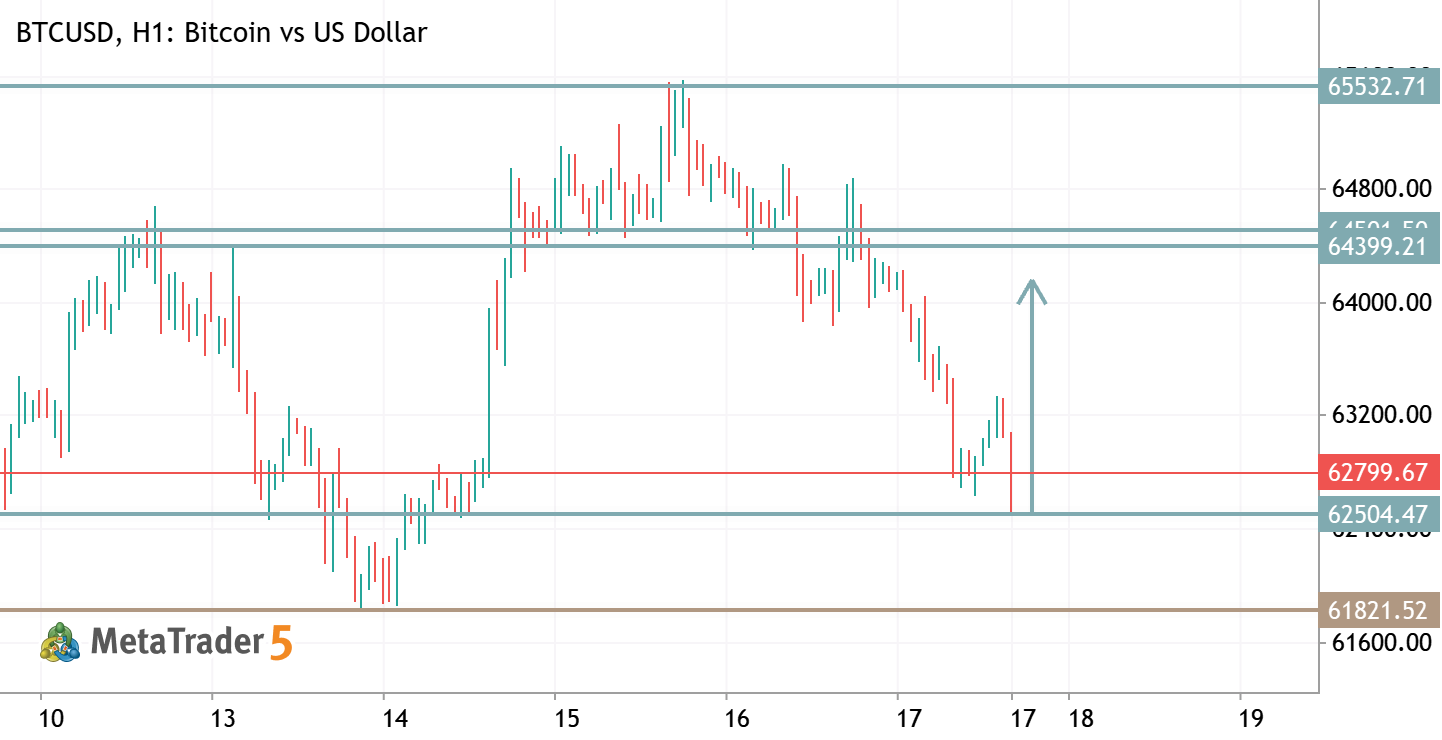
🟢 Support: 63,700–64,000 Confirmation from price action will be important before considering the next move.
0