XAUUSD H4 ANALYSIS XAUUSD Gold vs US Dollar

XAUUSD H4 ANALYSIS

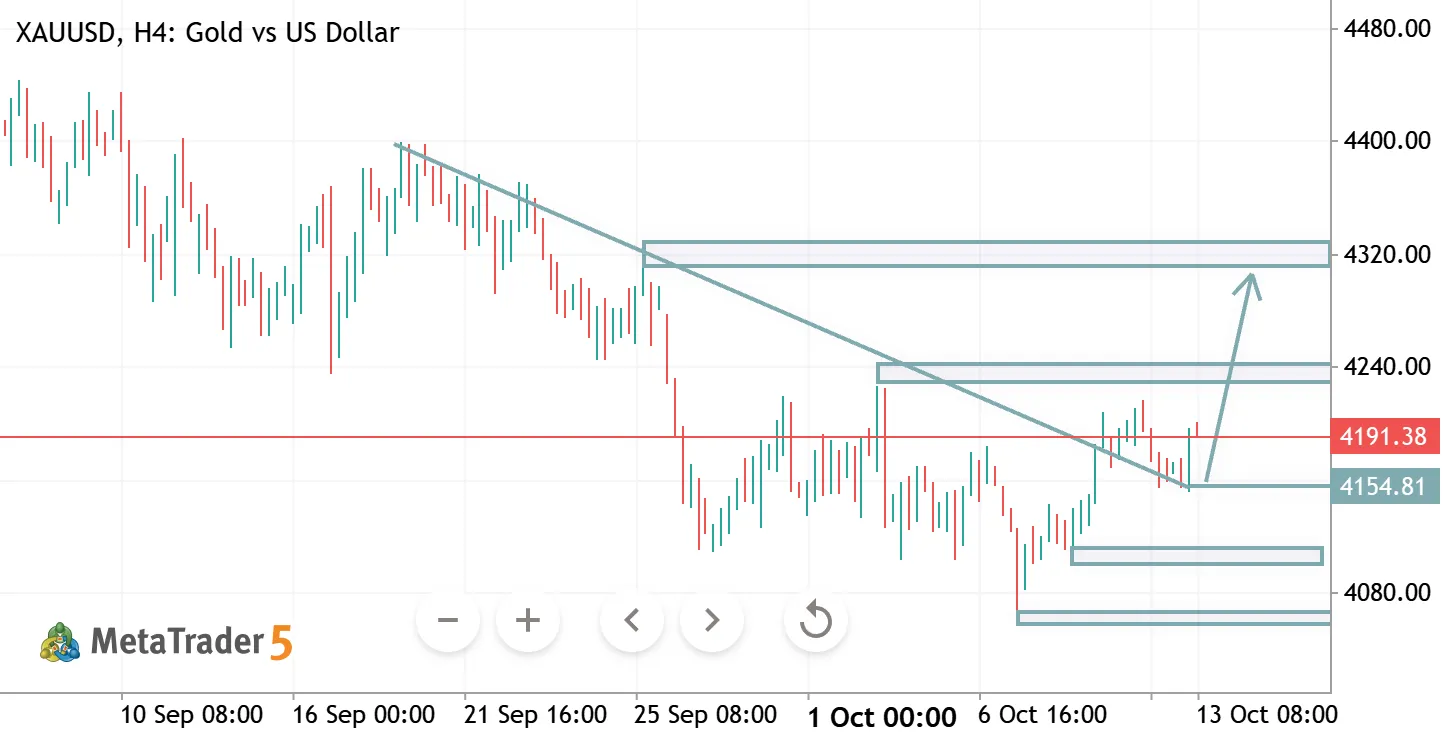
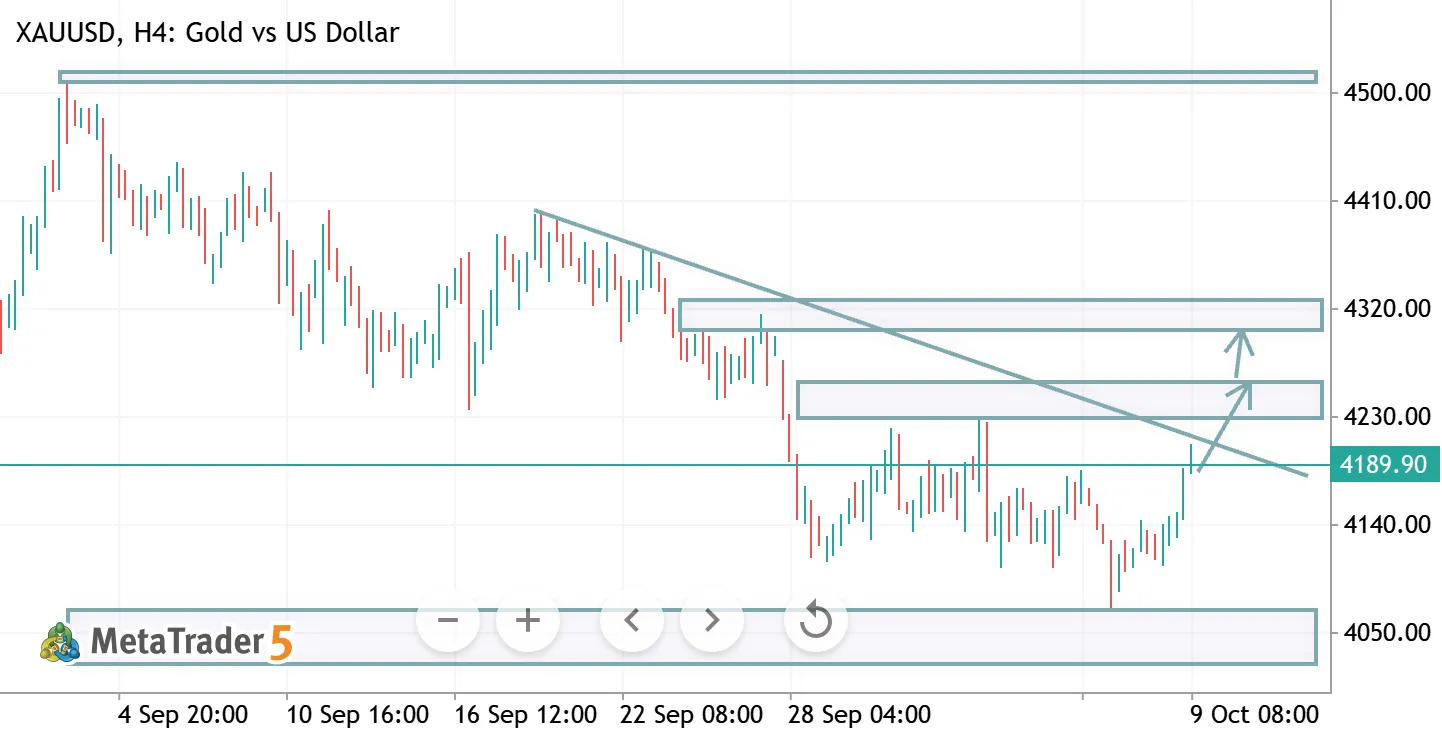
📊 XAUUSD H4 Analysis – Gold vs US Dollar Gold is attempting a bullish recovery near 4193 after consolidating around key support. Price is approaching the descending trendline, making the next breakout important. 🔹 Resistance: 4200–4220 | 4270–4280 🔹 Support: 4150 | 4100–4070 🔹 Bullish Scenario: A confirmed breakout above the trendline could push price toward 4220 and then 4270. 🔹 Bearish Scenario: Rejection may lead to a pullback toward 4150 and 4100. 📌 Key Focus: Wait for H4 breakout confirmation before considering a bullish continuation. ⚠️ Disclaimer: Educational analysis only. Always use proper risk management.
XAUUSD BUY Setup / tradline support XAUUSD Long Gold vs US Dollar

XAUUSD BUY Setup / tradline support

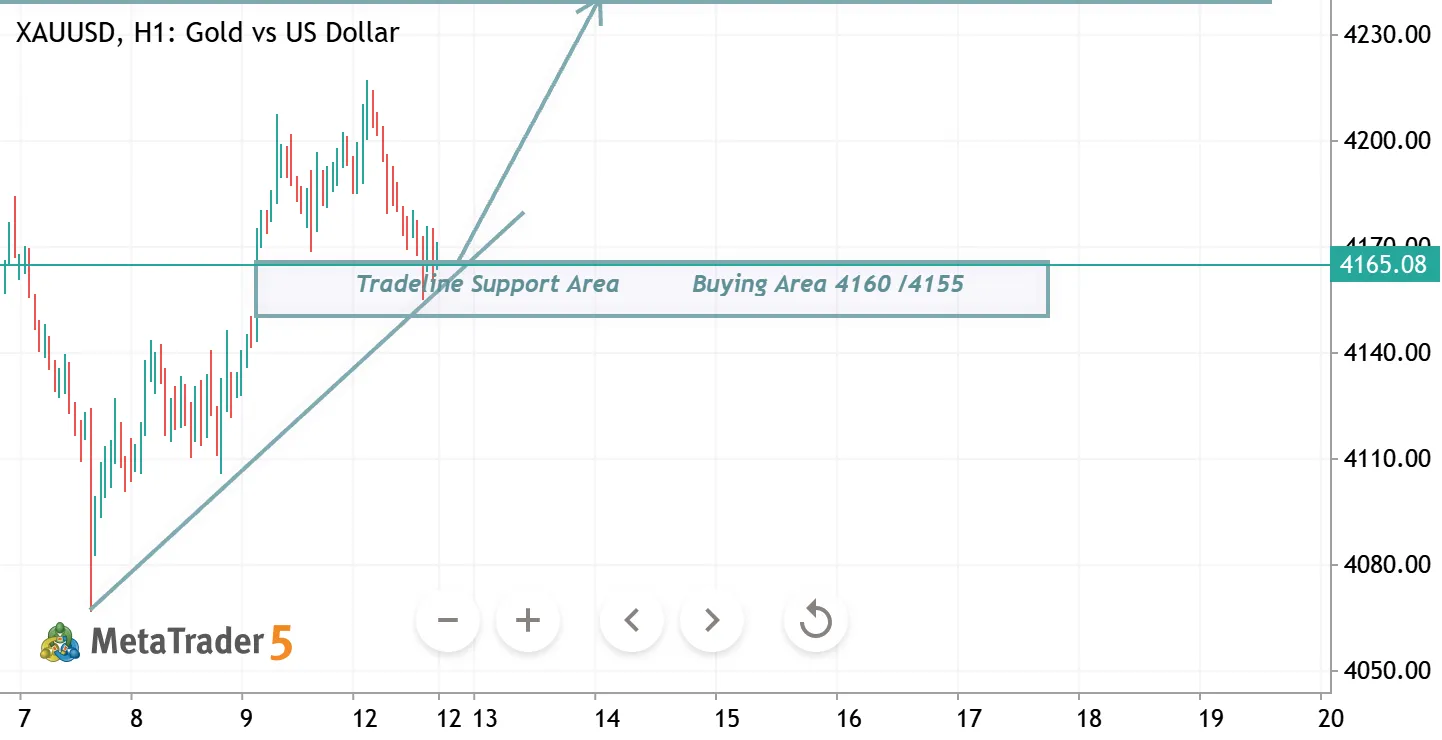
Entry Zone: 4160–4155 Target: 4260 🎯 Stop Loss: 4135 Educational Reason: Price is approaching a key trendline support area, where bullish reactions may occur. A successful bounce and bullish price-action confirmation could open the way toward 4260. 📌 Trade Management: Consider securing partial profits at TP1 and TP2. After TP1 is reached, consider moving SL toward breakeven to protect the position. Allow the remaining trade to target TP3 or the Open Target if bearish momentum continues. ⏳ Trade Type: Swing & Intraday Trade ⚠️ Educational purposes only. Wait for confirmation and manage risk properly.
XAGUSD H4: Bearish Trendline Holds | Silver Below Key 60.20 Level XAGUSD Short Silver vs US Dollar

XAGUSD H4: Bearish Trendline Holds | Silver Below Key 60.20 Level

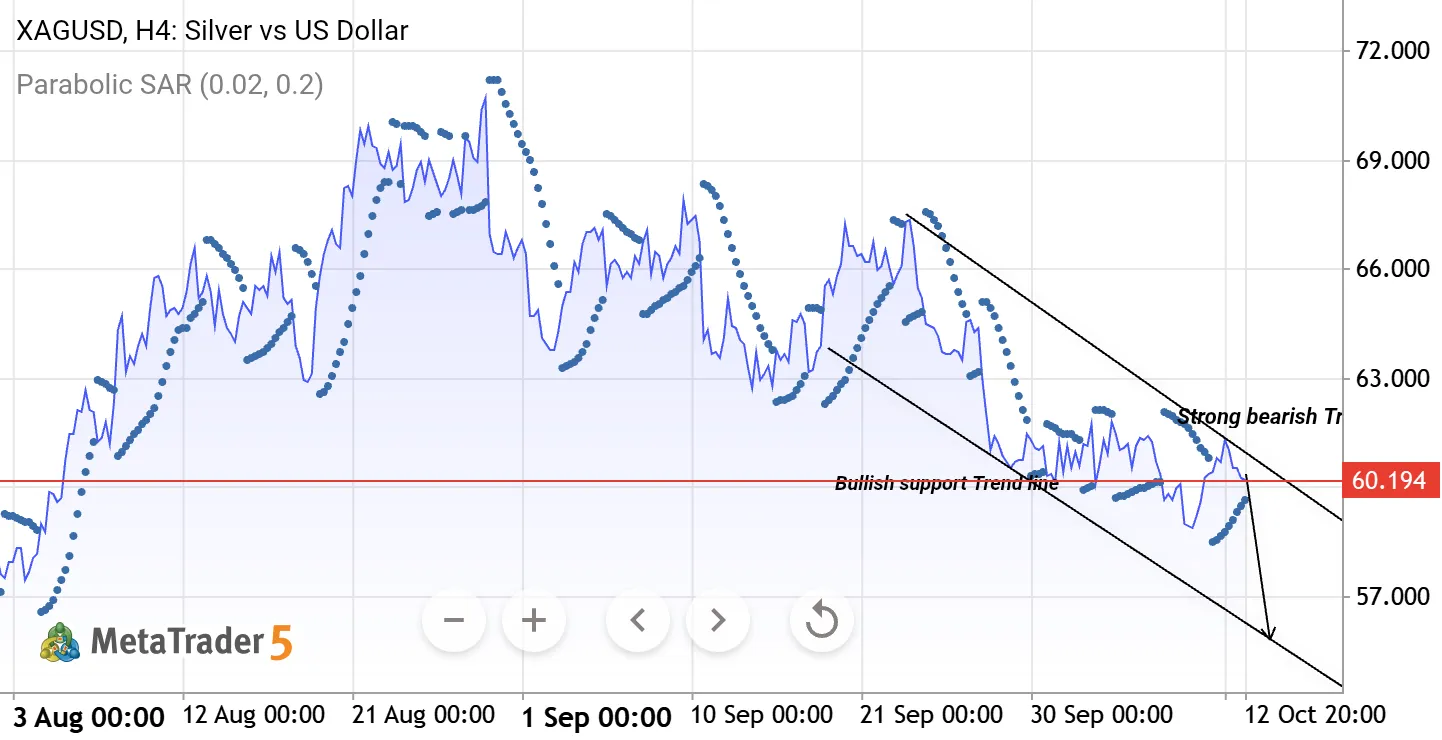
XAGUSD H4 — Bearish Setup Silver is trading below the 60.20 key level with a strong bearish trendline controlling the structure. 🔻 Sell below: 60.20 🎯 TP1: 59.00 🎯 TP2: 58.00 🎯 TP3: 57.50 🛑 Invalidation: Above the bearish trendline Parabolic SAR is supporting the bearish bias. A clean breakout above the trendline could change the setup. Wait for confirmation and follow proper risk management. Educational analysis only — Not financial advice.
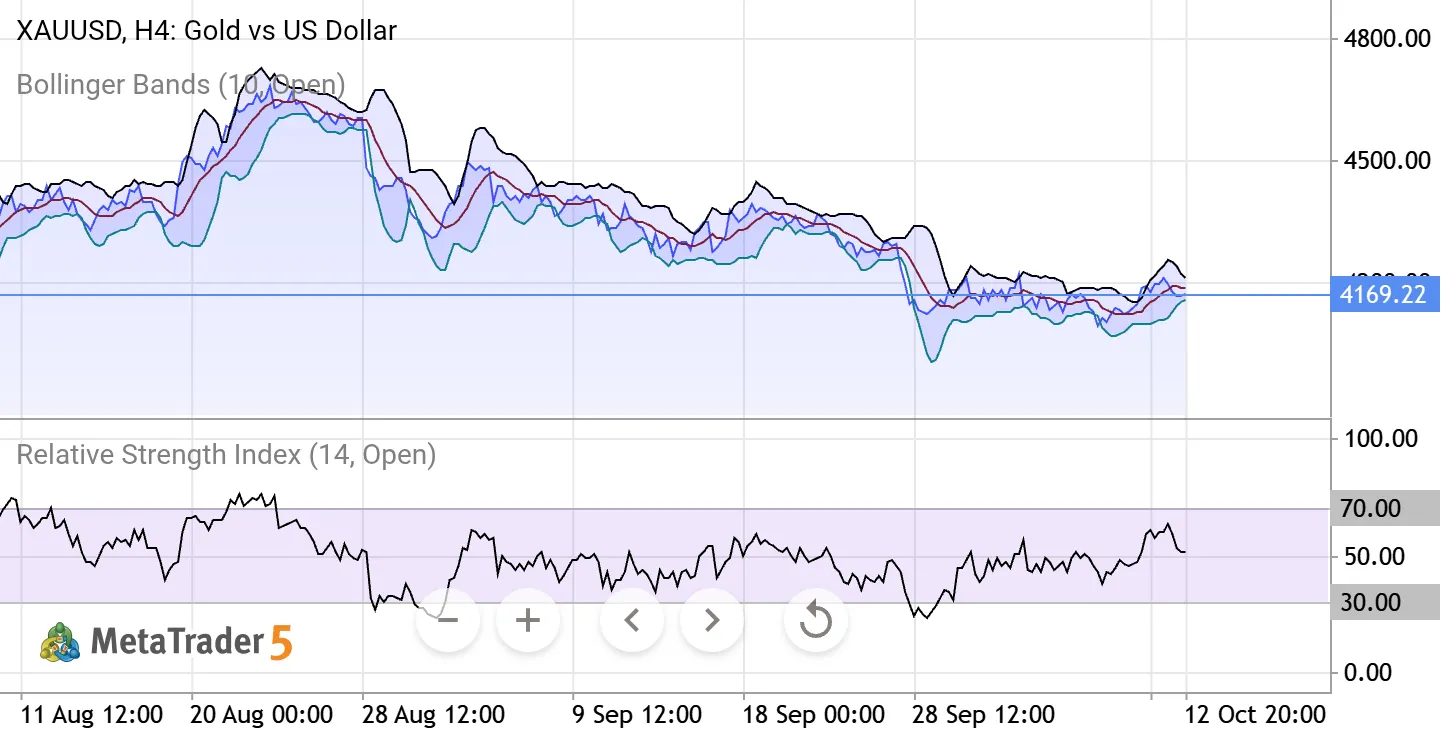
XAUUSD H4: Bollinger Bands & RSI | Key Levels and Market Outlook XAUUSD Long Gold vs US Dollar

XAUUSD H4: Bollinger Bands & RSI | Key Levels and Market Outlook

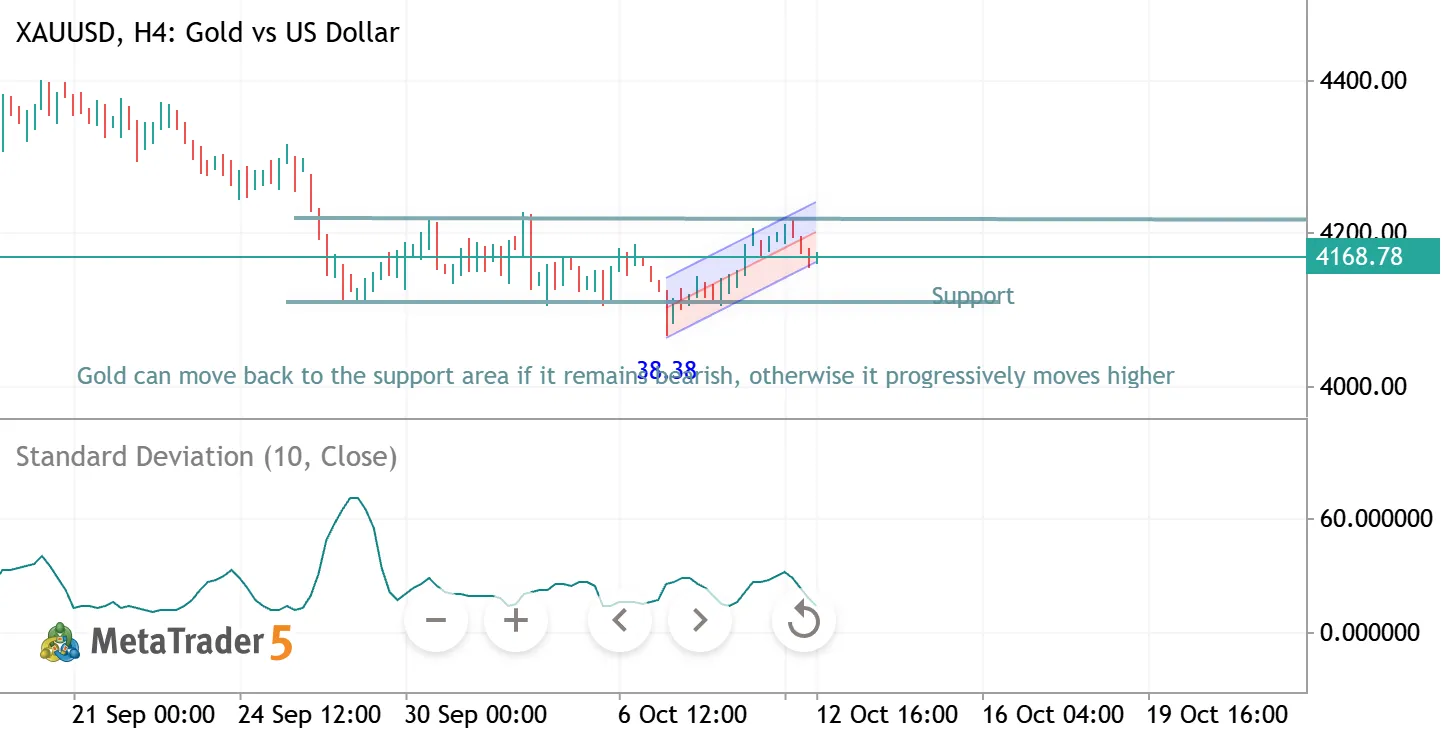
XAUUSD H4 — Technical Outlook 📊 Gold is currently trading around 4169 , with price moving near the middle area of the Bollinger Bands. The market has recently shown a recovery from the lower Bollinger Band, but momentum remains mixed. The Bollinger Bands are relatively compressed, suggesting a potential expansion in volatility ahead. A sustained move above the 4200–4220 area could strengthen bullish momentum and open the way toward higher resistance levels. On the other hand, rejection from the upper band or failure to hold the current structure could bring price back toward 4140–4100 support . The RSI is around the mid-50s , showing that momentum is neither overbought nor oversold. This leaves room for movement in either direction, so confirmation from price action is important before
Gold Daily Plan | Oct 12, 2026 XAUUSD Gold vs US Dollar

Gold Daily Plan | Oct 12, 2026

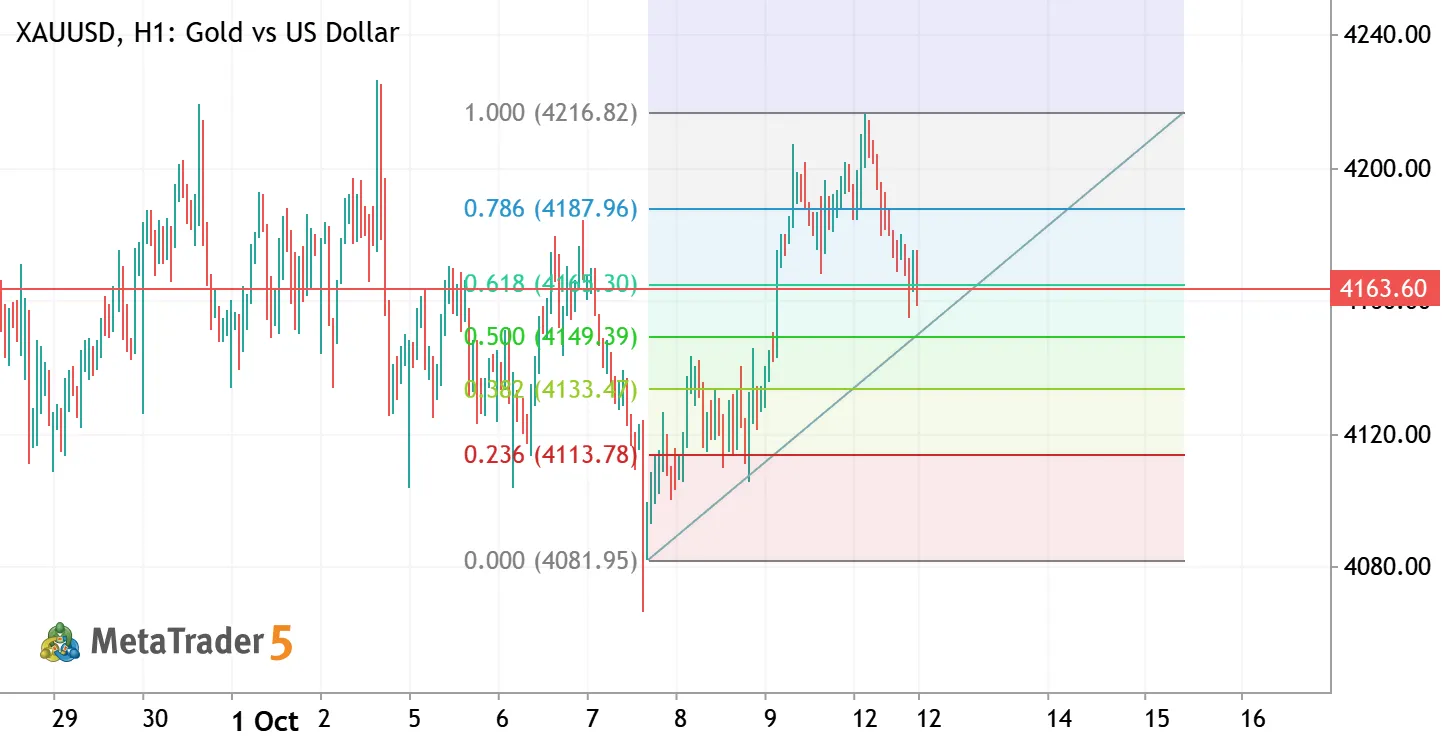
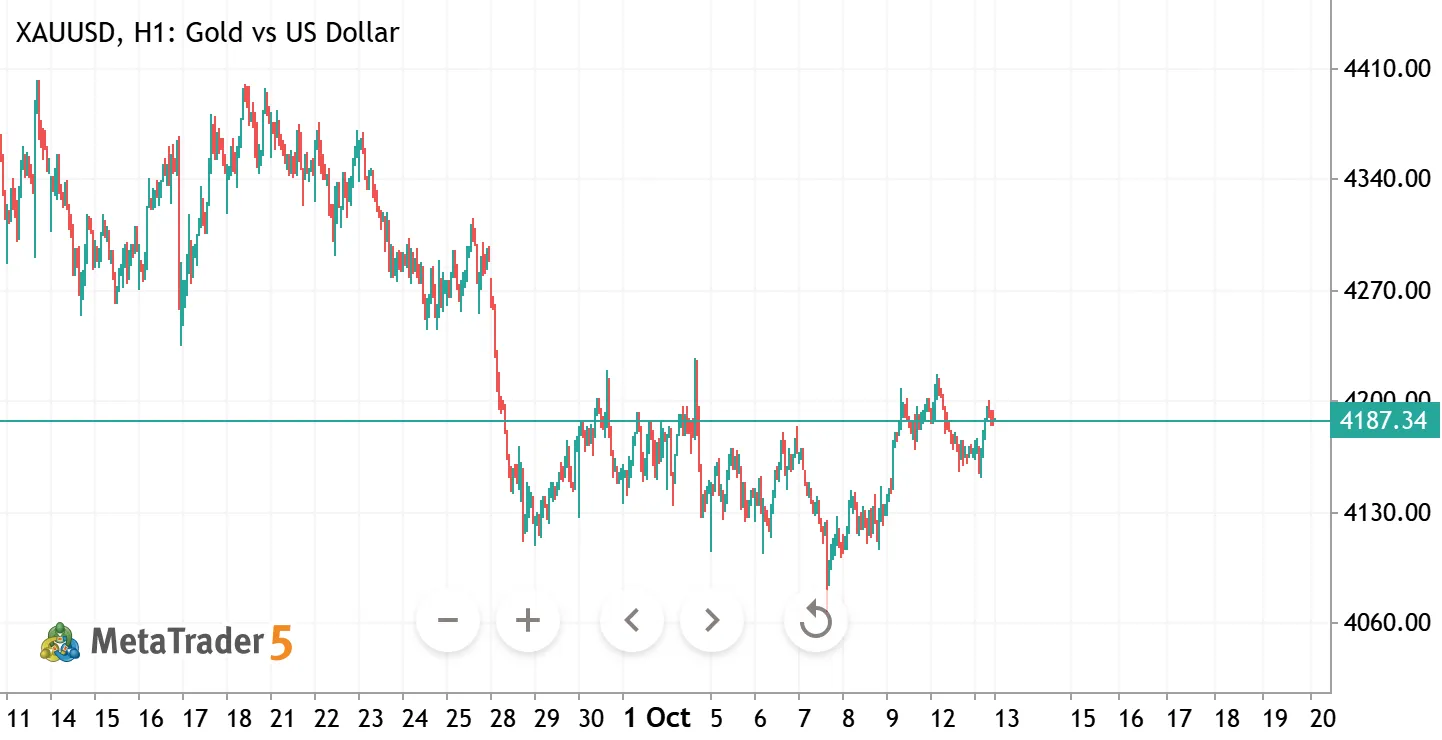
Gold Daily Plan | Oct 12, 2026 – Long from 4165 at the 0.618 + trendline Gold bounced from the 4081 low and rallied up to 4216.77, then pulled back in a healthy correction. Using a Fibonacci on the bullish leg (4081.70 → 4216.77), the pullback stopped exactly at the **0.618 level (4165.17)**, right on the **rising trendline** from the 4081 low. A wick down to ~4157 was quickly bought back, which shows buyers defending this area. Trade: BUY XAUUSD - Entry: 4165 - SL: 4140 - TP1: 4188 - TP2: 4217 Invalidation: an H1 close below 4149 breaks the trendline and cancels the setup.
XAUUSD H4 ANALYSIS XAUUSD Gold vs US Dollar

XAUUSD H4 ANALYSIS

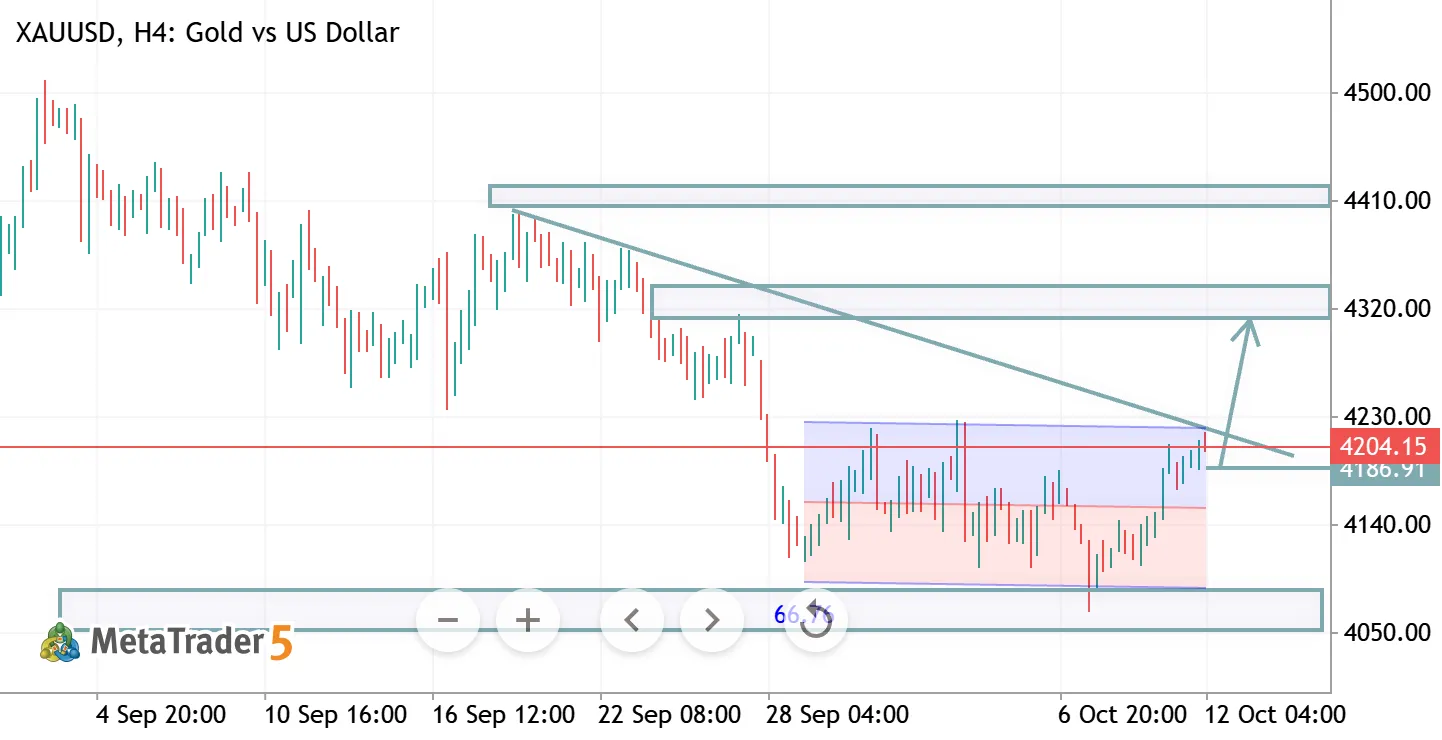
📊 XAUUSD H4 Analysis – Gold Gold is showing bullish recovery and is approaching a key resistance zone around 4200–4240, where the descending trendline may act as a barrier. 🔹 Resistance: 4200–4240 | 4320 | 4400 🔹 Support: 4160 | 4120 | 4080 🔹 Bullish Scenario: A confirmed breakout above 4240 could open the way toward 4320. 🔹 Bearish Scenario: Rejection near resistance may push price back toward 4160–4120. 📌 Key Focus: Watch for an H4 candle close above resistance to confirm bullish momentum. ⚠️ Disclaimer: Educational analysis only. Trade responsibly with proper risk management.
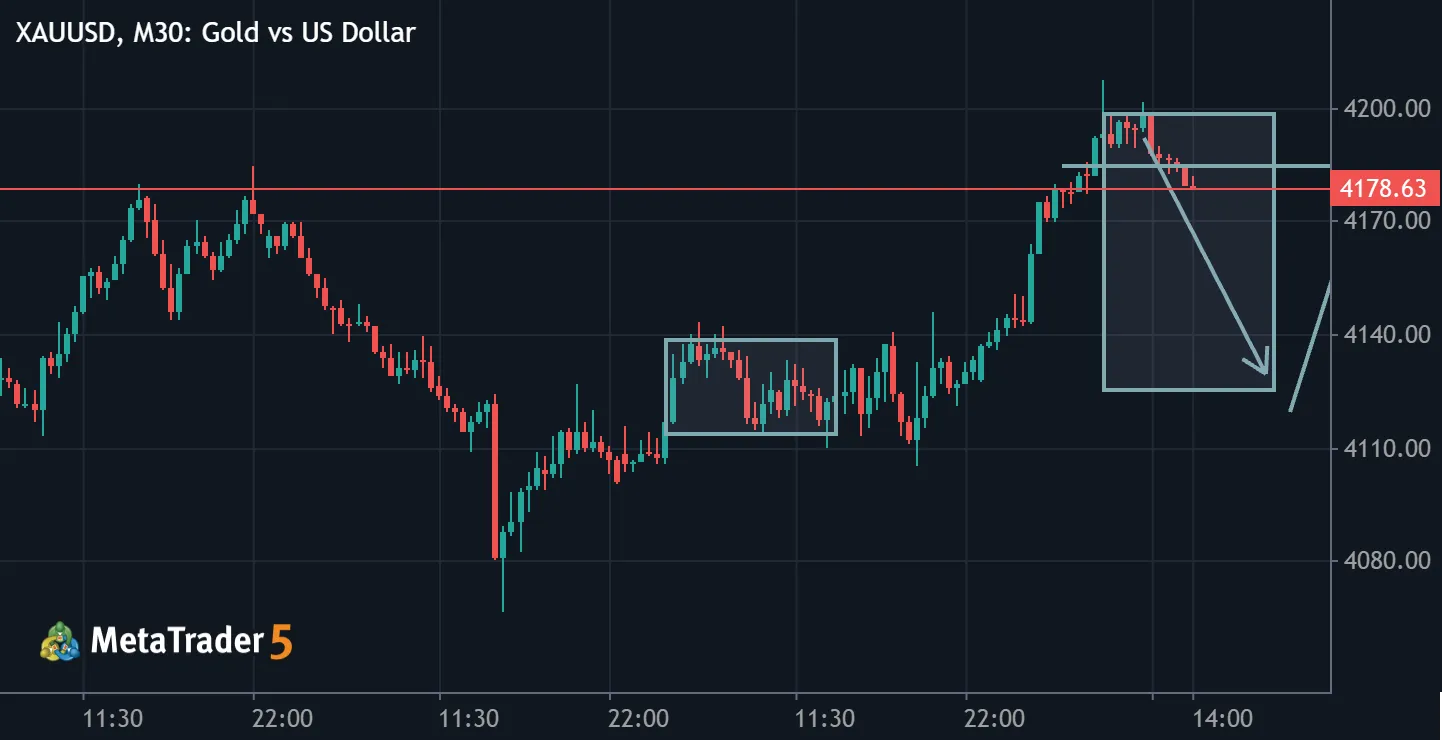
XAUUSD M15: Gold Faces Strong Resistance at 4195–4205 — Is a Pullback Coming? 📉 XAUUSD Short Gold vs US Dollar

XAUUSD M15: Gold Faces Strong Resistance at 4195–4205 — Is a Pullback Coming? 📉

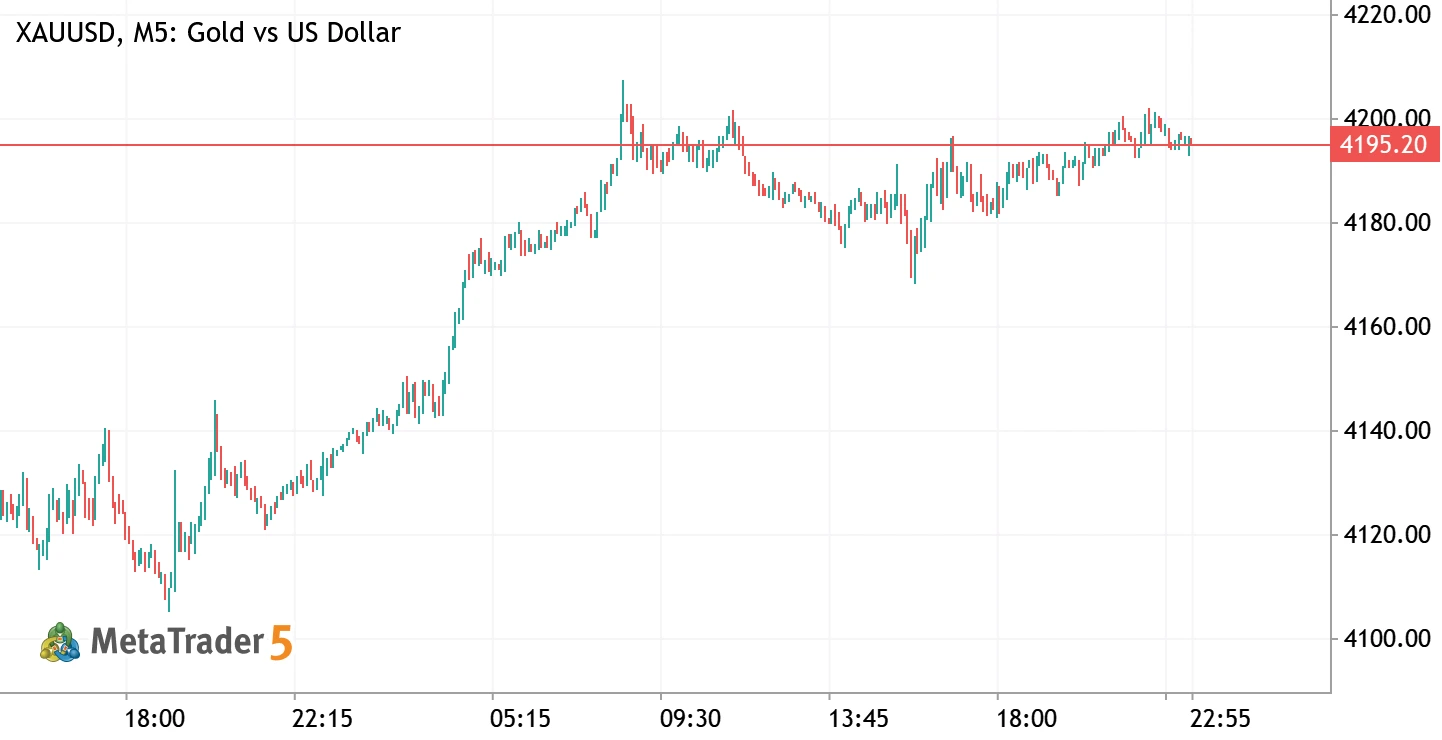
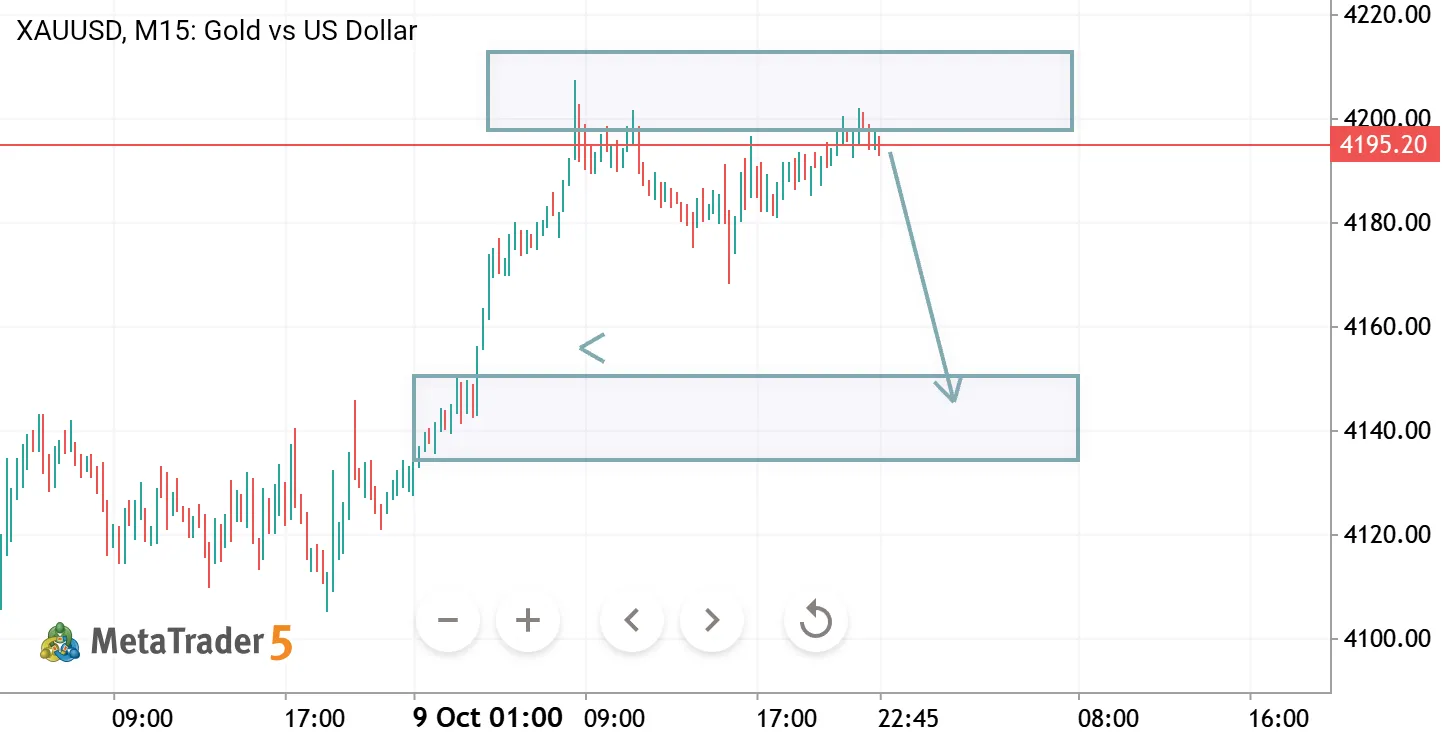
Gold has made a strong bullish move on the 15-minute chart, climbing from the 4130–4150 region toward the 4195–4205 resistance zone. However, price is now approaching an area where sellers have previously stepped in. 🔍 Technical Breakdown 🔴 Resistance Zone: 4198–4215 Price has returned to a previous supply area where selling pressure may emerge. A rejection from this zone could signal a short-term bearish correction. 🟢 Potential Support Zone: 4134–4152 This zone previously acted as a breakout area before the strong bullish rally. If price pulls back, it could become an important area to watch for a potential reaction. 📉 Bearish Scenario If price rejects resistance and confirms bearish momentum on M15, gold could pull back toward 4180, followed by the 4150–4140 region. The lower support
XAUUSD H4 ANALYSIS XAUUSD Gold vs US Dollar

XAUUSD H4 ANALYSIS

📊 XAUUSD H4 Analysis – Gold vs US Dollar Gold is showing bullish momentum after rebounding from the 4080 support zone. Price is approaching a descending trendline and key resistance around 4190–4200. 🔹 Resistance: 4200, 4240, 4320 🔹 Support: 4160, 4120, 4080 🔹 Bullish Scenario: A breakout above 4200 could push price toward 4240 and 4320. 🔹 Bearish Scenario: Rejection from resistance may lead to a pullback toward 4160 and 4120. 📌 Key Level: Watch for an H4 candle close above the trendline to confirm a potential bullish breakout. ⚠️ Disclaimer: This analysis is for educational purposes only. Trade with proper risk management.