
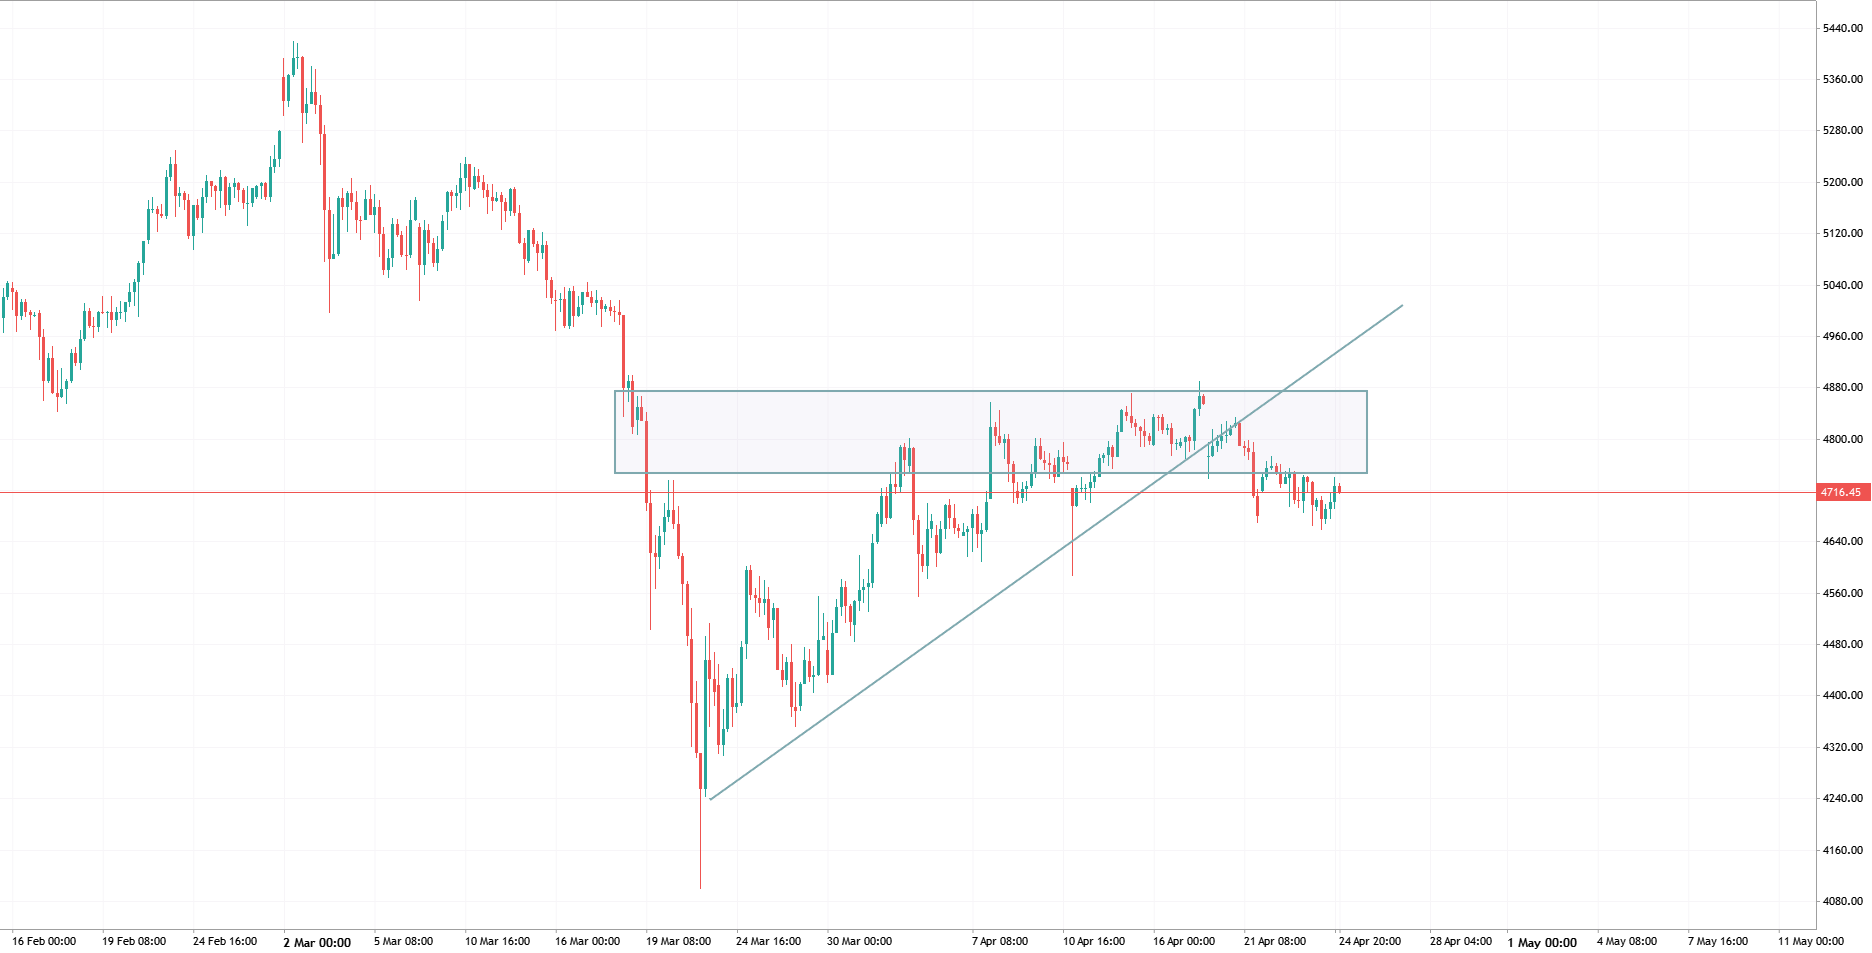
the gold chart is showing significant signs of a trend reversal. After a prolonged period of consolidation within a corrective structure, the price has failed to break above a major resistance zone and is now confirming a bearish breakout.
The price has decisively broken below the lower boundary of a Rising Wedge pattern. This breakdown typically signals the exhaustion of buyers and the start of a new bearish leg.
The red box (approx. $4,750 - $4,850) acted as a heavy supply zone. Multiple rejections at this level formed a Lower High structure, indicating that sellers are now in control.
The momentum has clearly shifted in favor of the bears. As long as the price remains below the broken ascending trendline, the path of least resistance is to the downside.
Traders should keep an eye on incoming macro data that may increase volatility, but the technical structure remains firmly bearish.
Please don’t forget to like and share your thoughts in the comments! ❤️
1

 MQL5プロファイル
免責条項:
提供された情報は、MetaQuotesによる金融、投資、取引、その他の助言または推奨を構成するものではありません。詳細については、利用規約をご覧ください。
新しいコメント
What's out of this scammer