



 MQL5プロファイルを開く
═══════════════════════════════════
Founded & Developed by Vitali Vasilenka
Algorithmic Trading Since 2019
═══════════════════════════════════
Professional Algorithmic Trading Solutions for MetaTrader 5
• 20+ Expert Advisors & Indicators
• 100+ Updates & Improvements
• Free Lifetime Updates
• Professional Technical Support
Quantum Lab develops professional trading software for traders who value reliability, transparency and continuous improvement.
Our ecosystem includes Expert Advisors, indicators and utilities designed to automate trading and simplify strategy execution.
Why Choose Us:
✔ Professional algorithmic development
✔ Continuous product improvement
✔ Regular feature updates
✔ Detailed documentation
✔ Responsive customer support
✔ Honest trading philosophy
Our Mission:
To build trading software that we would confidently use ourselves.
Every product is actively maintained and continuously improved based on real market conditions, customer feedback and new technologies.
Stay Connected
🌐 Official Website
https://eaquantumlab.net/
💬Telegram Community
https://t.me/EAQuantumLab
▶YouTube
https://www.youtube.com/@Quantum_Lab_Technologies
チャート&アイデア

XAUUSD | FVG Zones, Trend Support & Institutional Price Action
XAUUSD 1D | Smart Money Concepts, Market Structure & Liquidity Analysis Professional Candle-by-Candle Educational Description (With Reasons) --- 1. Initial Bullish Expansion Candles The chart started with strong bullish candles creating higher highs and establishing an upward market structure. Reason: Buyers showed strong momentum after defending lower demand areas, creating a series of higher highs and higher lows. --- 2. First Supply Reaction Candles Price reached a premium zone and formed rejection candles near the previous high area. Reason: Sellers entered from a high-value area where liquidity was available, causing temporary profit-taking and selling pressure. --- 3. Strong Breakout Candles Large bullish candles pushed price above previous resistance levels. Reason: The breakout
What are your thoughts on Gold?
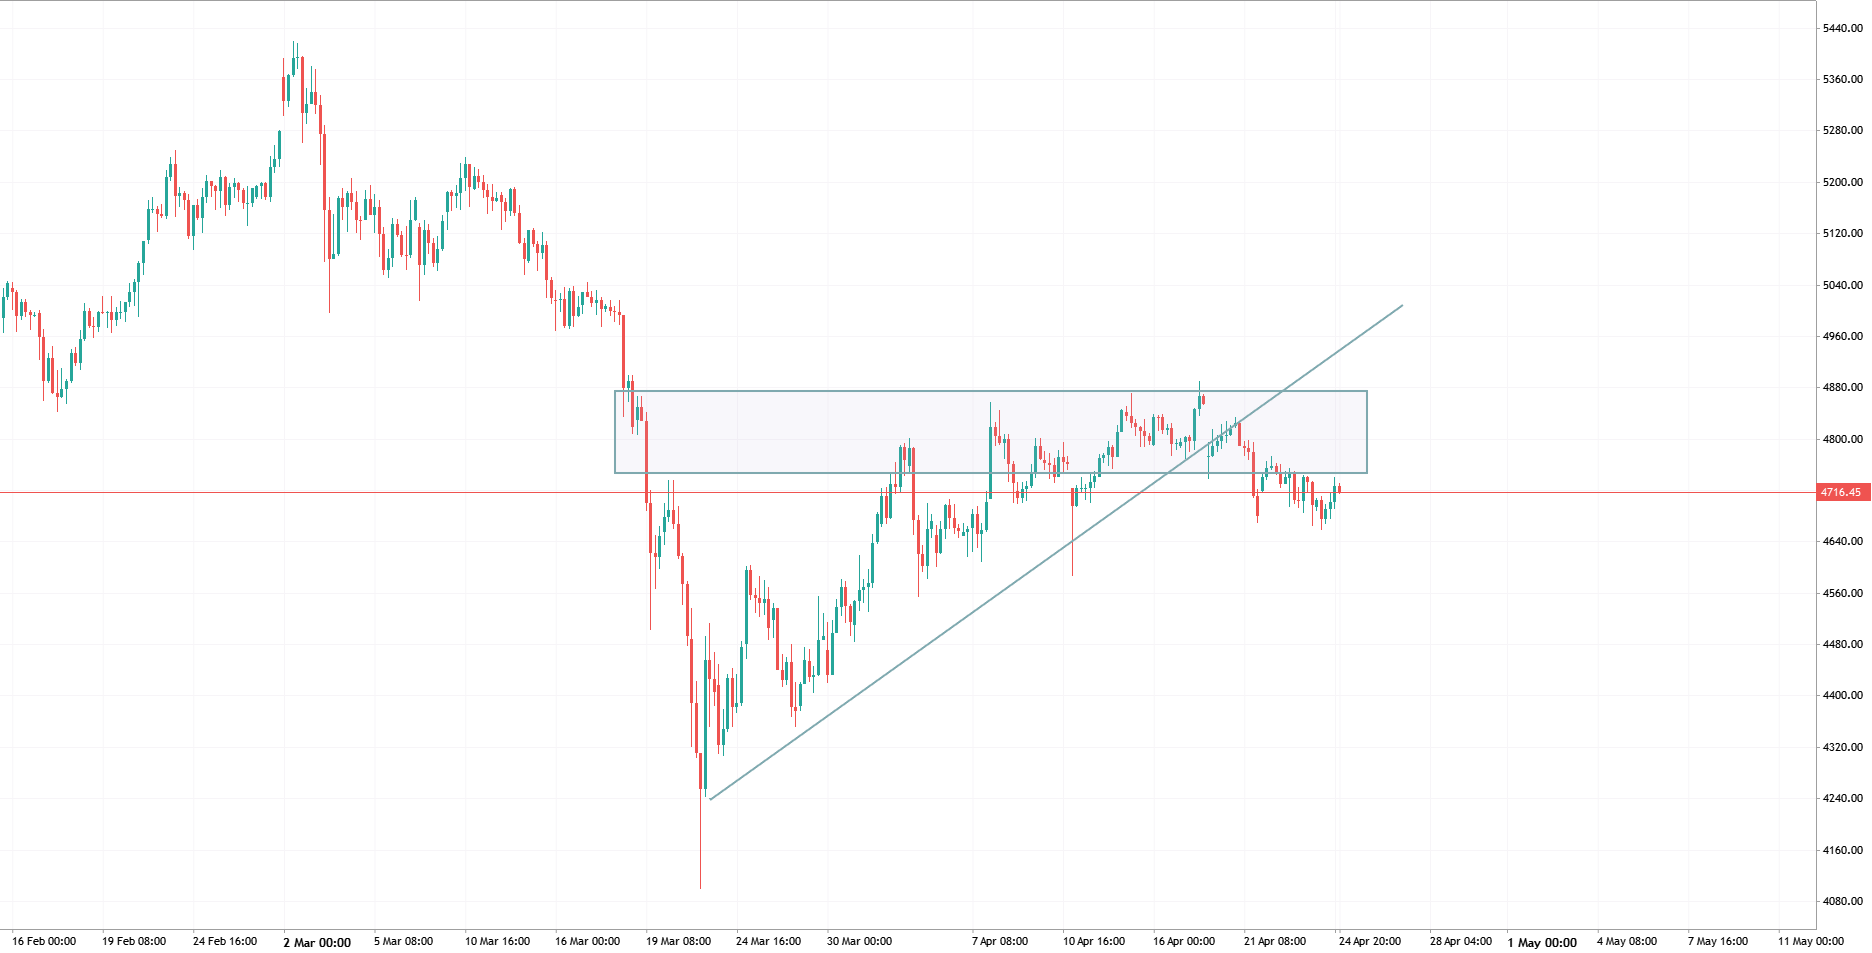
the gold chart is showing significant signs of a trend reversal. After a prolonged period of consolidation within a corrective structure, the price has failed to break above a major resistance zone and is now confirming a bearish breakout. The price has decisively broken below the lower boundary of a Rising Wedge pattern. This breakdown typically signals the exhaustion of buyers and the start of a new bearish leg. The red box (approx. $4,750 - $4,850) acted as a heavy supply zone. Multiple rejections at this level formed a Lower High structure, indicating that sellers are now in control. The momentum has clearly shifted in favor of the bears. As long as the price remains below the broken ascending trendline, the path of least resistance is to the downside. Traders should keep an eye on