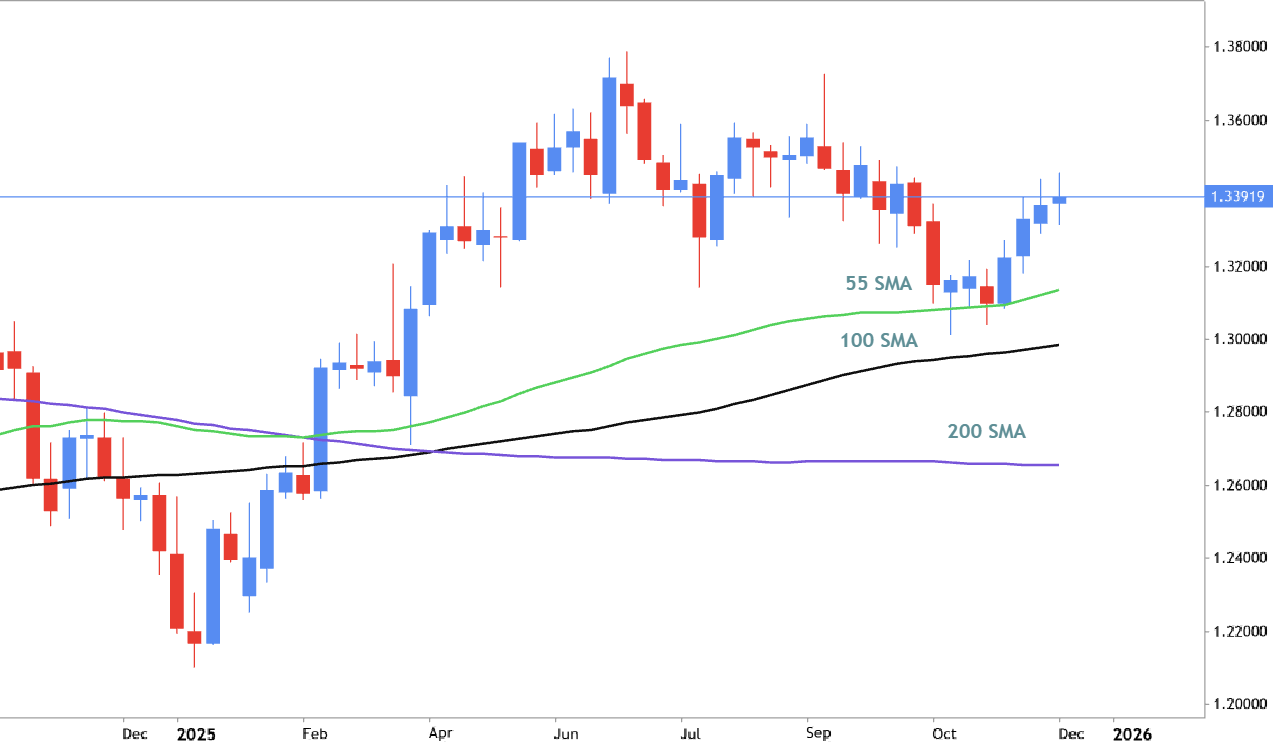
Weekly price is located to be above 200 SMA and 100 SMA as well in the bullish area of the chart. The price was bounced from 55 SMA to above for the primary bullish trend to be started. For now, the price is trying to break the symmetric triangle pattern to above together with resistance at 1.3438 on the weekly close bar. Alternatively, the price will be on secondary ranging within s/r levels waiting for direction of the strong trend to be started. Recommendation: watch the weekly price to break the resistance level on close bar, otherwise - ranging for direction.
2025.12.18 16:31
3

新しいコメント
The price broke 1.3645 support level to below for the secondary correction to be started in the ranging market condition. Conclusion: still bullish.
The weekly price broke 1.3567 resistance to above for the good bullish breakout. For now, the price is wide ranging within 1.3645/1.3869 s/r channel for direction.
- If the price breaks resistance at 1.3869 to above so the primary bullish trend will be continuing.
- if the price breaks 1.3645 support to below so the secondary correction within the primary bullish trend will be started.
The price is still on secondary ranging within the primary bullish trend: price is trying to break the ascending triangle pattern with resistance at 1.3567 to above for the bullish trend to be continuing; alternatively, the price will be on ranging waiting for direction.