
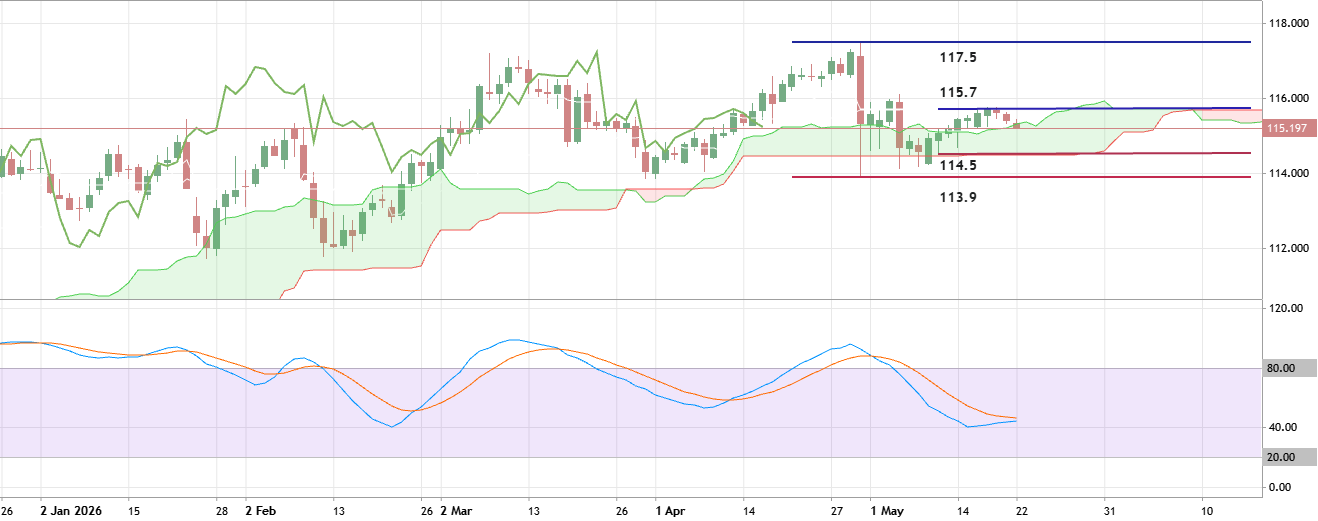
Daily price is located above and near Ichimoku cloud in the bullish area of the chart. The price was bounced from resistance level at 115.7 to below to cross the Ichimoku cloud border from above. Besides, the Chinkou Span line of Ichimoku indicator is breaking the historical price to below for the good breakdown to be started, and Stochastic oscillator is indicating the downtrend in the near future.
- If the price breaks support level at 114.5 to below so the primary bearish reversal will be started with 113.9 as a possible target.
- If the price crosses resistance at 115.7 to above so the primary bullish trend will be resumed with 117.5 possible target.
- Alternatively, the price will be on secondary ranging within s/r levels waiting for direction.
Trading Summary: possible daily breakdown

 MQL5プロファイル
新しいコメント