
Ethereum is pushing above $2,300 as the market recovers from weeks of compressed price action, with buyers gradually reasserting control after an extended period of consolidation near the $2,000 level. The move higher comes as underlying on-chain data begins to paint a more constructive picture — one that suggests the recent weakness may have been quietly working in Ethereum’s favor rather than against it.
According to a CryptoQuant report, a significant divergence has been developing beneath the surface. While price remained range-bound near $2,000, realized capitalization held by accumulating addresses continued to expand — a signal that long-term demand was absorbing available supply during the weakness rather than retreating from it. Coins were consistently moving into wallets with low historical spending behavior, the kind of addresses that tend to hold through volatility rather than react to it.
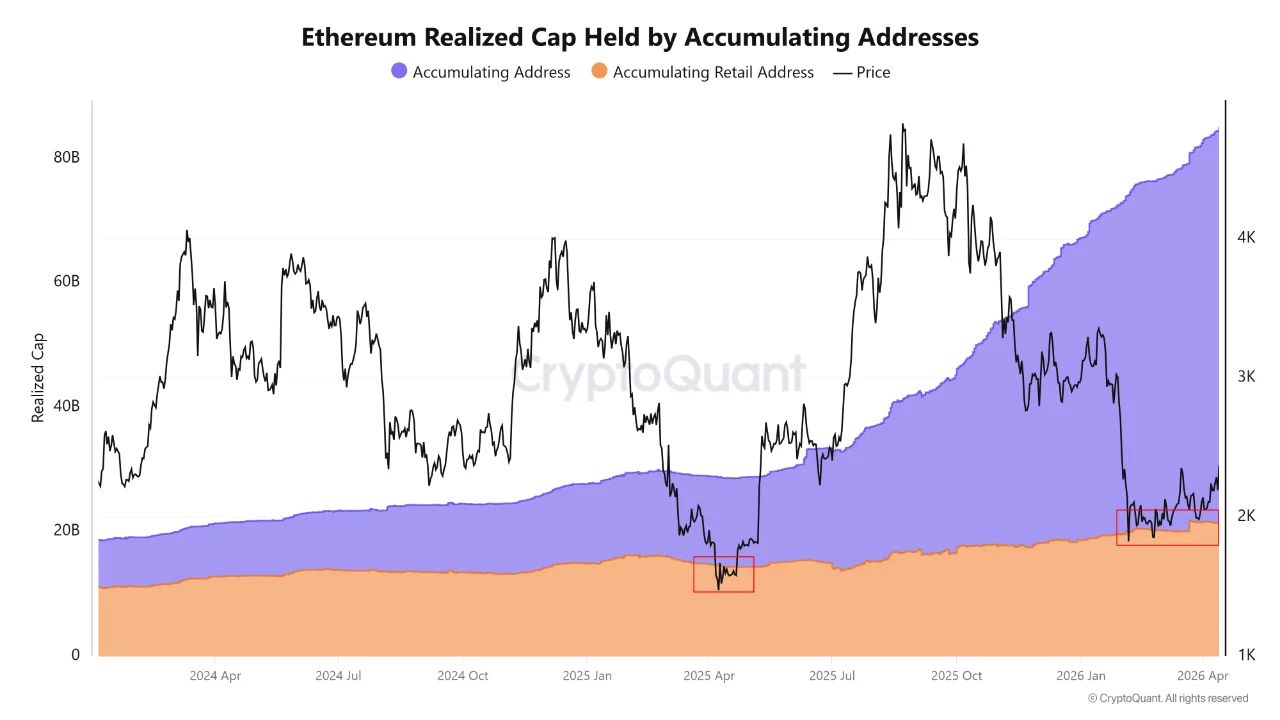
This pattern became especially visible following the April 2025 drawdown and the consolidation that followed. Rather than triggering distribution, the price volatility appeared to accelerate accumulation among conviction-driven participants. Stronger hands were increasing exposure precisely when the market looked least inviting.
That dynamic matters now because Ethereum is trading above $2,300. If the capital structure that formed during the consolidation is as durable as the on-chain data suggests, the current move may have a foundation that previous bounces lacked.
Supply Is Quietly Moving Into Stronger Hands
The inflow data reinforces what the accumulation signals have been suggesting. During the mid-2025 rally, Ethereum’s exchange inflows were dominated by high-frequency in-out addresses — the kind of activity typically associated with active trading and distribution near local price tops. That pattern reflected a market where participants were using strength as an exit rather than an entry. The current structure looks meaningfully different.
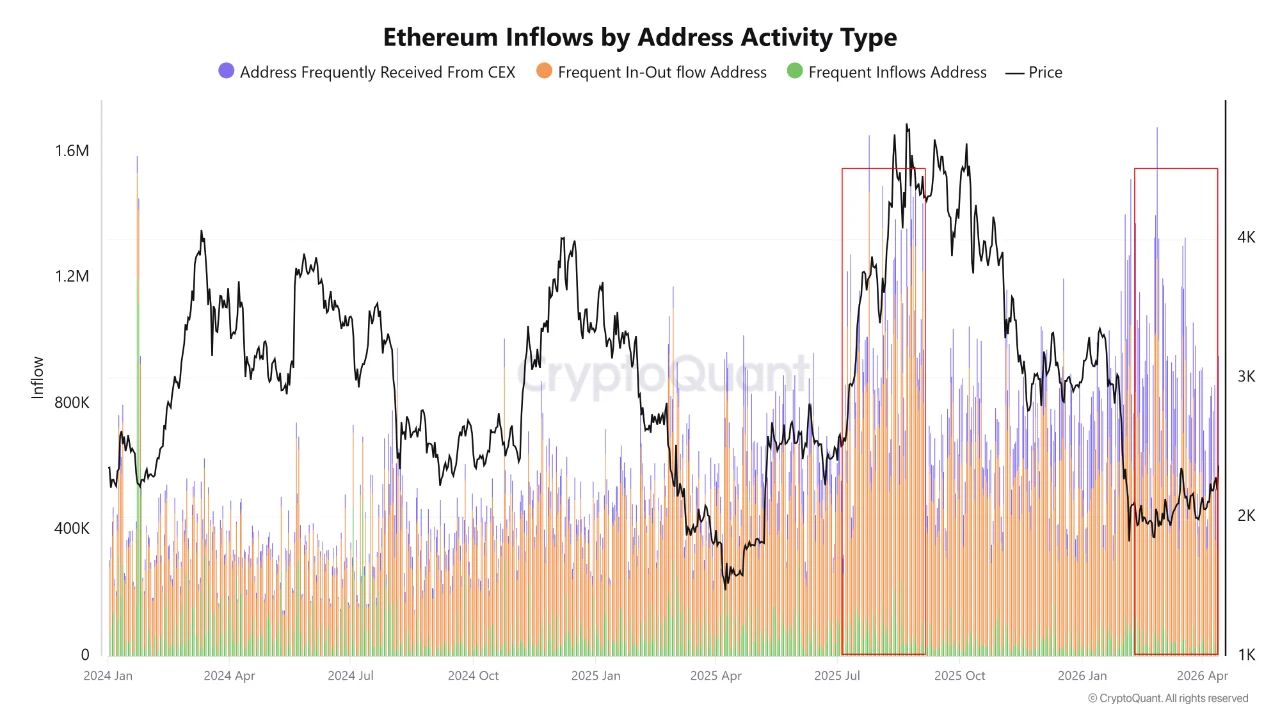
Speculative inflow activity has declined, while addresses receiving funds directly from centralized exchanges are becoming increasingly dominant in the flow data. In practical terms, assets are leaving liquid venues and moving into hands that are less likely to return them quickly to the market. Each outflow of this type quietly removes supply from the immediately available sell side.
What is notably absent is any sign of overheating. There are no extreme inflow spikes — the kind that historically precede sharp corrections by signaling that too much capital has piled in too quickly. Instead, the report describes a re-accumulation phase where supply is being transferred gradually to stronger holders without the fanfare that typically accompanies speculative excess.
If exchange outflows continue at the current pace, the supply available for immediate sale on major venues will keep tightening. That kind of structural compression, combined with improving demand signals, is the setup that has historically preceded expansion phases rather than reversals. Ethereum’s fundamentals, by this measure, are strengthening even where the price chart has yet to fully reflect it.
Ethereum Tests Critical Weekly Resistance After Post-Capitulation Recovery
Ethereum is attempting to reclaim higher ground after a volatile multi-cycle structure that has repeatedly failed to sustain momentum above the $3,000–$4,000 range. The weekly chart shows a clear pattern: impulsive rallies followed by sharp retracements, with the most recent rejection near $4,800 in late 2025 leading to a breakdown toward the $1,700–$1,800 region.
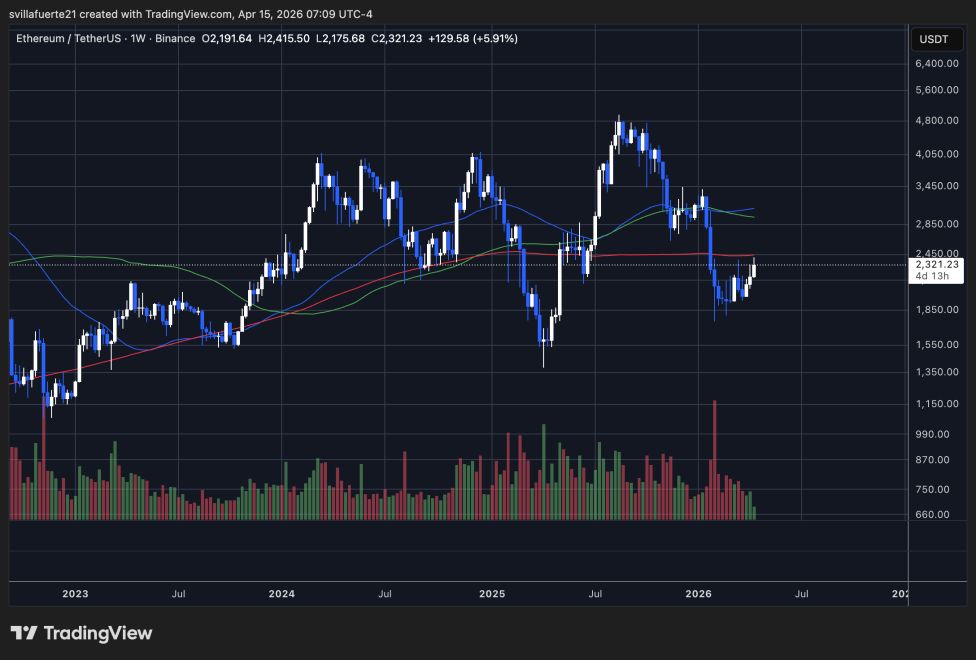
That February 2026 capitulation marked a structural reset, with elevated volume confirming forced selling or large-scale de-risking. Since then, ETH has staged a recovery, now trading around $2,300–$2,400 — a level that sits directly at a key pivot zone. This area previously acted as support during mid-2024 and early 2025, and is now being retested as resistance.
From a trend perspective, ETH remains below the 200-week moving average (red), which is flattening, while the 100-week (green) and 50-week (blue) are converging just above the current price. This compression suggests a decision point is approaching, where the market must either reclaim these levels or face renewed downside pressure.
Volume has declined notably since the capitulation spike, indicating that the recovery is not driven by aggressive inflows but rather by reduced selling.
Holding above $2,400 would signal structural improvement. Rejection here would likely reinforce the broader range-bound regime.
Featured image from ChatGPT, chart from TradingView.com