
Bitcoin has pushed back above $70,000 and is now testing resistance near $75,000, riding a wave of risk appetite that has sent equities sharply higher across global markets. The move looks straightforward on the surface — risk is on, assets are rallying, and Bitcoin is participating. But an XWIN Research Japan analysis argues that what is happening beneath the surface is considerably more interesting than a simple risk-on trade.
The report begins with a warning dressed as reassurance. The VIX has declined back to pre-conflict levels, suggesting that fear has left the market. Yet equity and bond correlations have turned positive again — meaning stocks and bonds are moving in the same direction simultaneously.
That dynamic, last seen in 2022, is the specific condition that breaks the traditional 60/40 portfolio. When the two assets that are supposed to offset each other start behaving as one, diversification stops working, and portfolio risk rises quietly while the surface looks calm.
That structural failure is redirecting attention toward alternatives — gold, commodities, and increasingly, Bitcoin. What the analysis flags as particularly notable is that Bitcoin has been holding its own price dynamics even during periods of declining fear. It is not simply tracking equities up or down. It appears to be responding to a different set of drivers entirely.
That distinction, if it holds, changes what Bitcoin is in a portfolio — and potentially what it is worth.
Bitcoin Is No Longer Playing by the Old Rules
The Coinbase Premium Index adds a layer to the analysis that is difficult to dismiss. When that indicator stays positive — meaning Ethereum and Bitcoin are trading at a premium on Coinbase relative to Binance — it reflects underlying spot demand from US investors specifically. That is not the fingerprint of traders chasing a momentum move. It looks more like deliberate, portfolio-level allocation from participants who are choosing Bitcoin as a strategic position rather than a short-term bet.
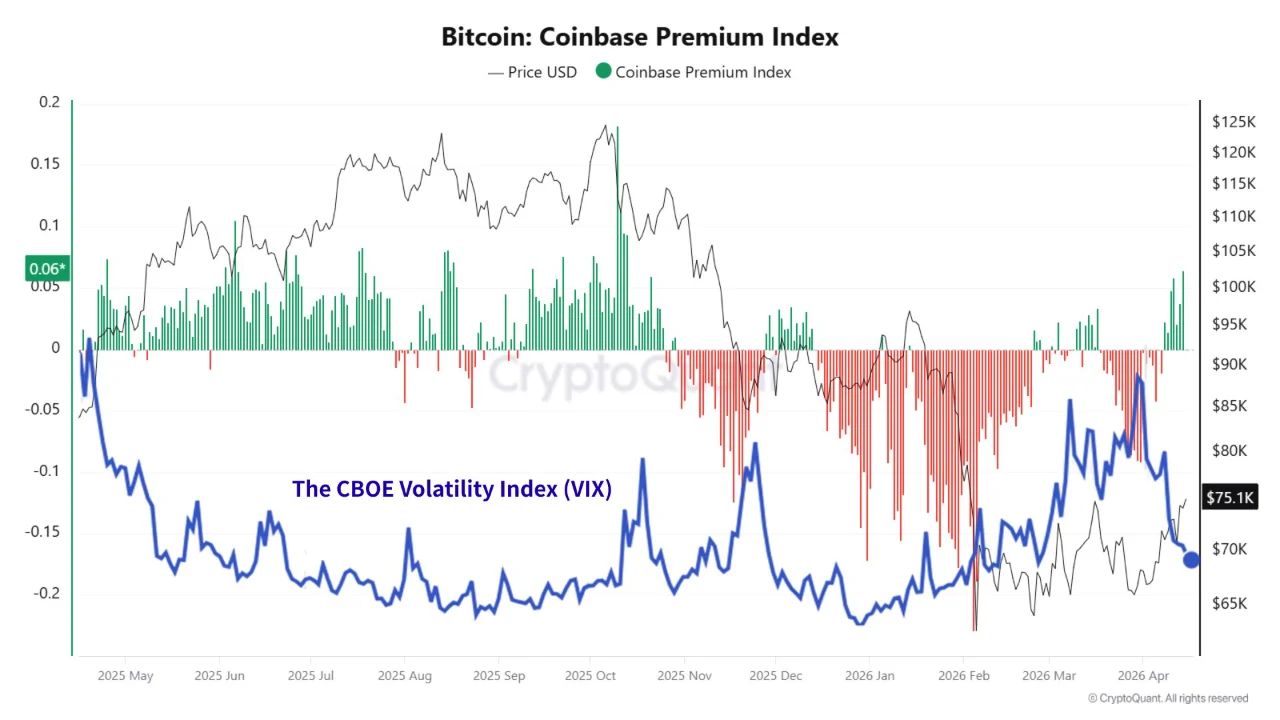
What reinforces that reading is Bitcoin’s behavior during risk-off episodes. When the VIX spikes and fear spreads through traditional markets, Bitcoin does not consistently sell off the way equities do. That inconsistency is exactly what you would expect from an asset that is being driven by factors separate from broader market sentiment — and it is precisely the property that makes a genuine diversifier valuable.
The analysis frames the current environment carefully. This is not a low-risk market. The VIX may look calm, but stocks and bonds are moving together, the 60/40 framework is quietly failing, and investors are searching for something that actually behaves differently under stress. Bitcoin, the report suggests, is increasingly fitting that description.
The thesis is not settled. But for the first time in Bitcoin’s history, the data is making a serious case for it — and the test of whether that case holds is happening right now, in real markets, with real money.
Bitcoin Tests $75K Resistance as Weekly Structure Enters a Critical Phase
Bitcoin is attempting to reclaim momentum on the weekly timeframe after a sharp correction from the $120,000–$130,000 region, which marked a clear local top in late 2025. The subsequent decline into early 2026 drove prices toward the $60,000–$65,000 range, where buyers stepped in aggressively, forming a strong reaction low with elevated volume.
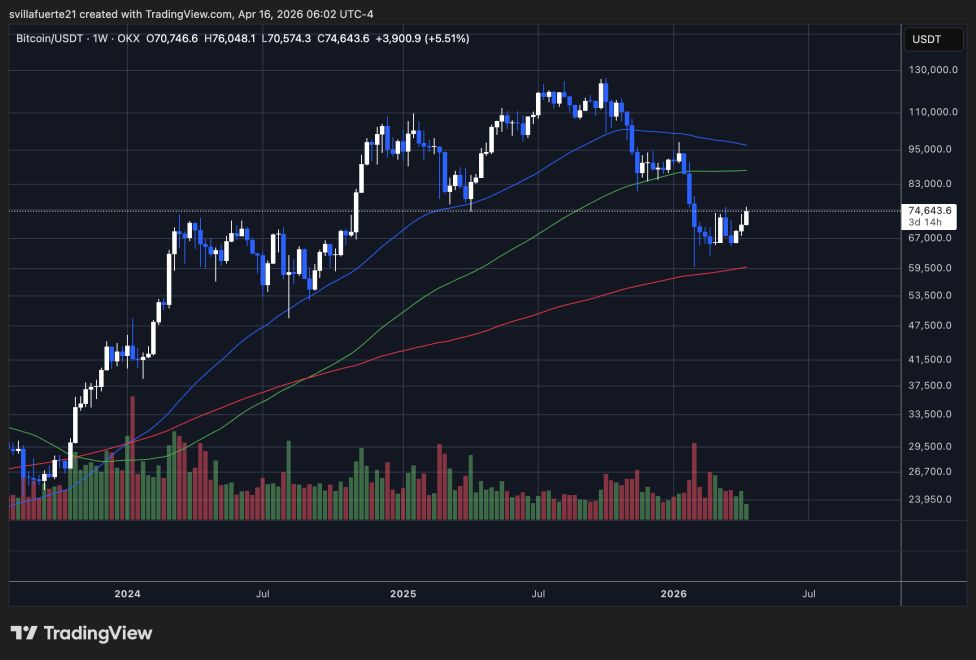
Since that capitulation phase, BTC has been building a recovery structure, now trading around $74,000 and approaching a key resistance zone. This level aligns with prior support during the mid-cycle consolidation and is now acting as overhead supply. The market is effectively testing whether that former support can be reclaimed as a new base.
From a trend perspective, Bitcoin remains in a transitional phase. Price is still below the 50-week moving average (blue), which has started to flatten, while the 100-week (green) is being tested from below. The 200-week (red) remains well below price and continues to slope upward, confirming that the long-term trend is intact despite recent weakness.
Volume has moderated significantly since the sell-off, suggesting that the recovery is not driven by aggressive speculative inflows but by gradual reaccumulation.
A sustained move above $75,000 would confirm structural strength. Failure here would likely keep Bitcoin range-bound between $65,000 and $75,000.
Featured image from ChatGPT, chart from TradingView.com