

NVDA
#1
NVIDIA Corporation - Common Stock
229.2 8 USD
-0.01%
Market Price
セクター: 技術
ベース: USD
利益通貨: USD
日中レンジ
1年のレンジ
1日の変化
-0.52%
月次変化
+8.62%
6か月変化
+23.26%
1年の変化
+21.98%
以前の終値
230.4 8
Open
233.8 8
安値
229.1 1
高値
233.8 9
Financials
2024
Quarterly report, Q1 FY2025
NVIDIA CORP quarterly report, Q1 FY2025
10-Q
Institutional holdings, Q1 FY2024
NVIDIA CORP institutional holdings, Q1 FY2024
13F-HR
INFORMATION TABLE, Q1 FY2024
NVIDIA CORP INFORMATION TABLE, Q1 FY2024
INFORMATION TABLE
Current report, Q1 FY2024
NVIDIA CORP current report, Q1 FY2024
8-K
Current report, Q1 FY2024
NVIDIA CORP current report, Q1 FY2024
8-K
Annual report, FY2024
NVIDIA CORP annual report, FY2024
10-K
2023
Institutional holdings, Q4 FY2023
NVIDIA CORP institutional holdings, Q4 FY2023
13F-HR
INFORMATION TABLE, Q4 FY2023
NVIDIA CORP INFORMATION TABLE, Q4 FY2023
INFORMATION TABLE
Current report, Q4 FY2023
NVIDIA CORP current report, Q4 FY2023
8-K
Quarterly report, Q3 FY2024
NVIDIA CORP quarterly report, Q3 FY2024
10-Q
ニュース
バーンスタインがAIインフラのコストを分析:1ギガワット当たりの投資額は最大395億ドル
ホワイトハウスが60億ドル超の科学計画を発表、テック企業は24億ドルの拠出を約束
7,000万人の子どもたちがトランプ口座を手に入れた。より大きな勝者はステート・ストリートかもしれない
NVIDIA、今後5年間で10億ドルを投じ米国の科学発展を推進すると約束
SecuritizeがSolanaでトークン化米国株をローンチ、NYSEデジタルプラットフォームへの上場を計画
ロボットデータのスタートアップMecka AIが6000万ドルのシリーズB資金調達を完了、セコイア・キャピタルが主導
株式市場は下落している:VIXは、投資家はまだ本当に怖がっていないと示している
アナリスト:エヌビディア株の新高値がAI関連ETFのブレイクアウト相場を後押しする可能性
NvidiaがAI関連取引を混雑させた。次に来るものを狙う3つのETFとは
NVIDIA支援のAI企業Firmus、IPOで55億ドル調達へ、評価額は約306億ドル
「AI株の神様」Leopold氏、NVIDIA・AMDなどのプットオプションを全決済、SanDiskとMicronが最大のロングポジションに
チャート&アイデア
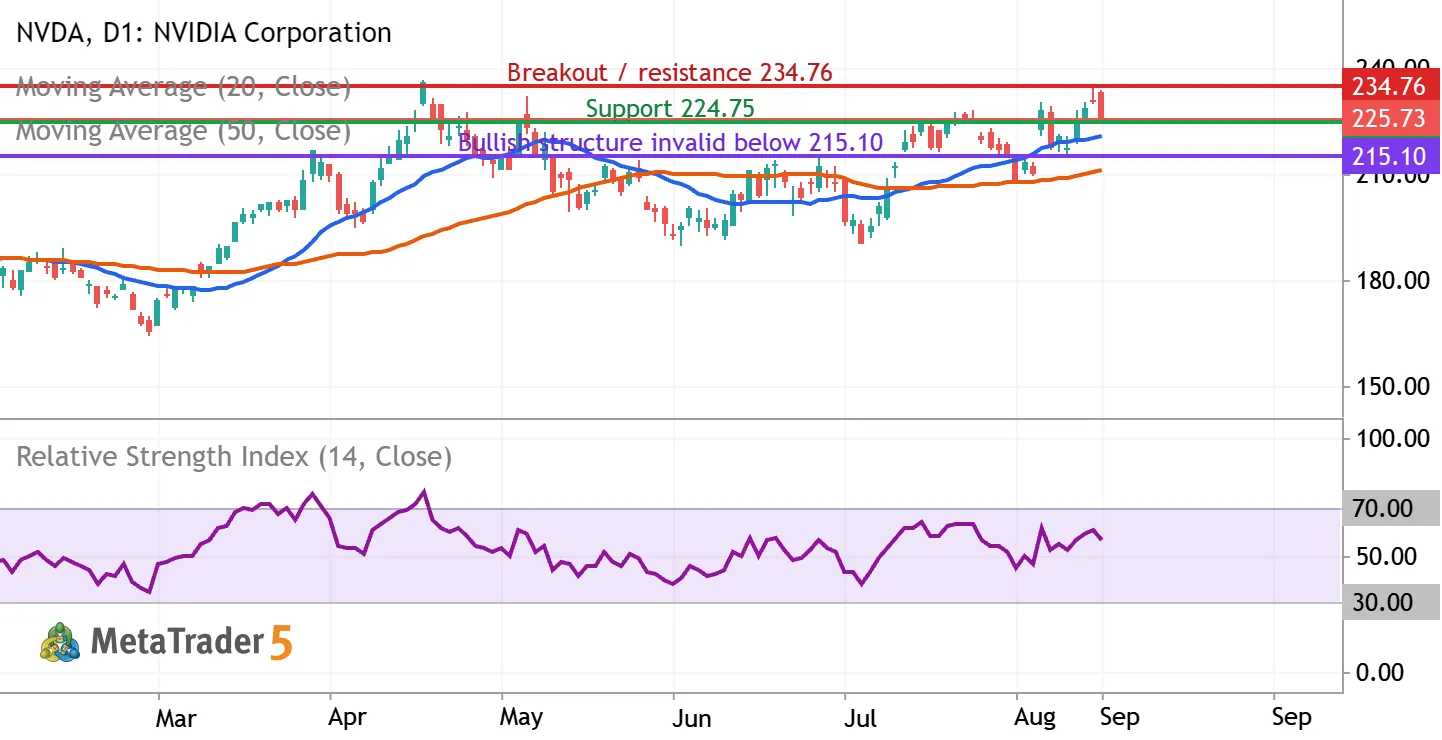
NVDA: testing $225 support as the uptrend meets $234.76 resistance
NVIDIA (NASDAQ: NVDA) | Daily chart | September 9, 2026 Bias: conditionally bullish over the next 2–6 weeks. Entry confirmation is still required. The latest completed regular session, September 8, closed at $225.73, down 2.01%, after reaching $233.71 intraday. The close near the session low signals selling pressure despite the broader recovery. What the indicators show The chart includes a blue 20-day simple moving average, an orange 50-day simple moving average, and purple RSI(14), all calculated from closing prices. At the latest completed candle, MetaTrader showed the averages near $220.48 and $211.22, with RSI near 56.19. Price remains above both rising averages, and the 20-day average is above the 50-day average. RSI above 50 supports positive momentum, but its reading below 70 is


The NVDA doesn’t have other trading ideas at this time
Browse ready-made trading ideas or select a symbol and create your own
Go to Charts and Trading Ideas