
 MQL5プロファイルを開く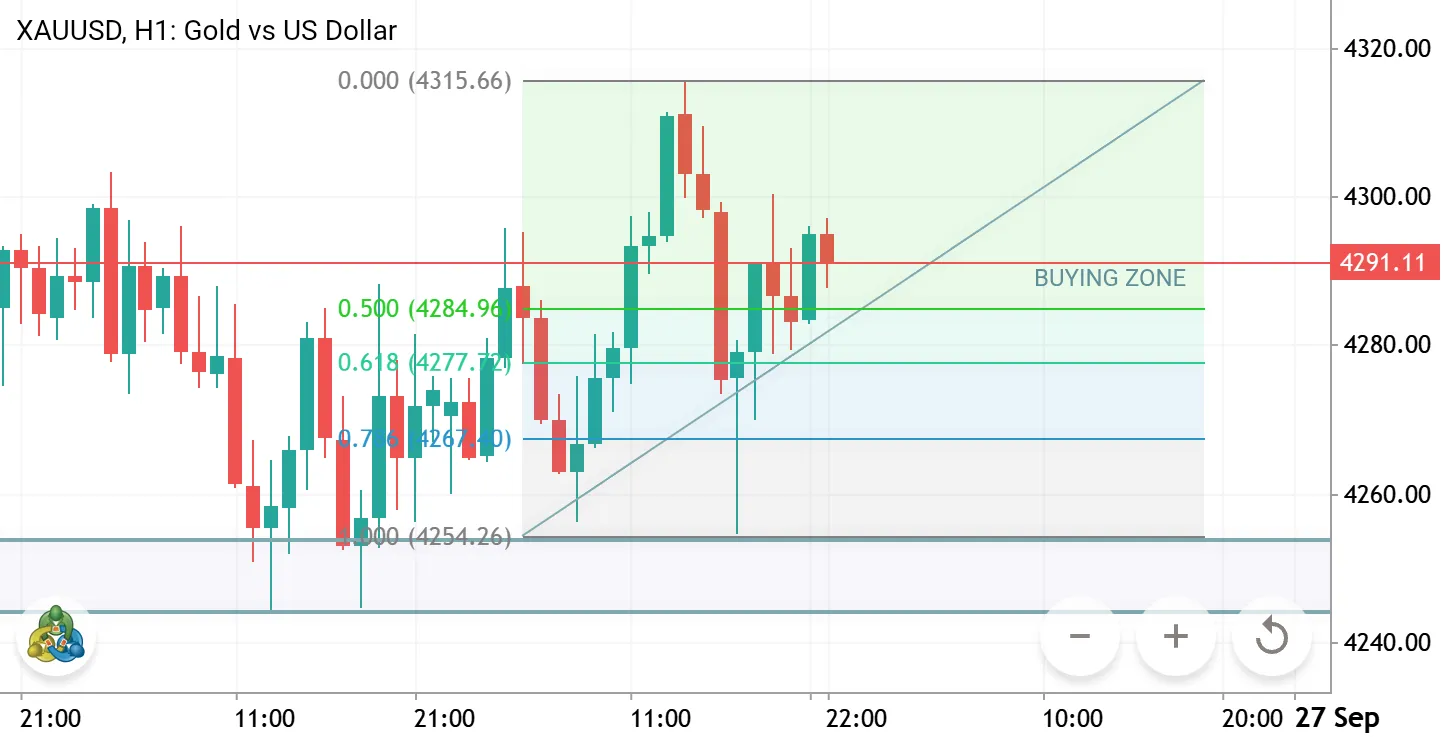
📊 XAUUSD (Gold) 1-Hour Chart Analysis • Current Price: 4291.11 • Trend: Market is testing the Buying Zone. • Strategy: Looking for a potential bounce from this level. Watch the price action closely for an entry!
📈 XAUUSD (GOLD) 1-HOUR CHART ANALYSIS 📈 🔹 Market Overview: The price is currently consolidating on the H1 timeframe, trading right around 4291.11 . It is highly compressed and testing a vital structural zone. [1, 2] 🔹 Key Technical Levels: Immediate Resistance: 4315.85 (Recent High / 0.00 Fibonacci Level) Current Zone: 4285.09 - 4291.11 ( BUYING ZONE ) Major Support: 4244.33 (Strong Floor / 1.000 Fibonacci Level) [1, 2] 🔹 Trading Strategy & Evidences: Price is reacting closely within the highlighted green Buying Zone . A clear ascending trendline is supporting the price action from below. Bias: Bullish continuity is expected as long as the market actively holds above the Fibonacci retracement levels. Look for structural confirmation on lower timeframes (like M5 or M15) before