
You are translating a WordPress post_content field from English to Spanish. Give me the response in a code block to make it easy to copy and paste.
Your job: Translate only visible natural-language text nodes into Spanish.
Do not change:
Any HTML tags Any attributes Any URLs Any shortcode syntax Any placeholders Any code snippets Any numbers unless they are part of translatable running text Any entity codes Any technical stringsCritical preservation rules:
The output must remain valid HTML. The HTML structure must be identical to the input. Every placeholder must survive byte-for-byte unchanged. Do not invent, summarize, omit, normalize, or improve anything. Do not convert HTML to Markdown. Do not add introductory or trailing text. Return only the translated post_content.Input HTML:
Bitcoin’s recent price behavior has been everything the bulls hoped for , and that may be precisely the problem. Since bottoming out around $63,000 in early April, Bitcoin has posted a sequence of higher highs and higher lows and has now reclaimed $80,000. The structure looks bullish. However, technical analysis shows that Bitcoin has now entered into deceptive territory.
Bitcoin’s Uptrend May Be Hiding A Compression Phase
Bitcoin’s price action is now forming an interesting but deceptive pattern. The pattern in question is a rising wedge that has been forming on Bitcoin’s daily chart since February. The setup was highlighted by crypto analyst Merlijn The Trader, who described Bitcoin’s current pattern as “the most deceptive pattern in crypto.” His chart places Bitcoin near the upper end of the wedge, with the $84,000 area acting as a key rejection zone.
A rising wedge is formed when price action grinds upward along two converging trendlines, printing higher highs and higher lows in a narrowing channel. The pattern resembles an upward price trend where the market constantly hits higher levels and never falls below prior price lows before bouncing back on the surface. However, a rising wedge is known to resolve more bearishly than bullishly.
The chart shared by Merlijn shows Bitcoin pushing upward inside this structure, with the upper wedge boundary sitting around $84,000. That area is the zone where bulls may face their biggest test.
That makes the next move around the $80,000 to $84,000 area very important. A clean move above the upper boundary would weaken the bearish wedge argument. A rejection around $84,000, followed by a breakdown under $80,000, would open up the path to lower price levels.
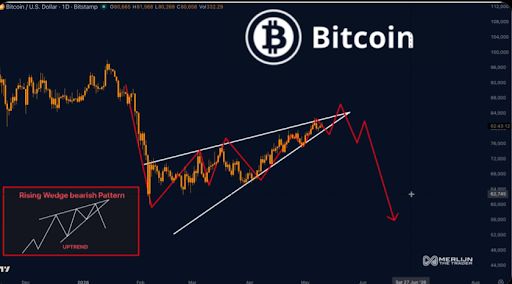
Bitcoin Price Chart. Source: @MerlijnTrader On X
Crash Below $60,000?
The $80,000 price level is now carrying both psychological and technical weight. Bitcoin recently reclaimed this level for the first time in months, helped by improving market sentiment.
Merlijn’s chart turns that same level into the breakdown trigger. According to the outlook, a break below $80,000 would confirm weakness inside the wedge and open the way for a move down to $56,000. This does not mean Bitcoin is guaranteed to fall there, but it shows where the bearish projection comes from if the wedge resolves to the downside.
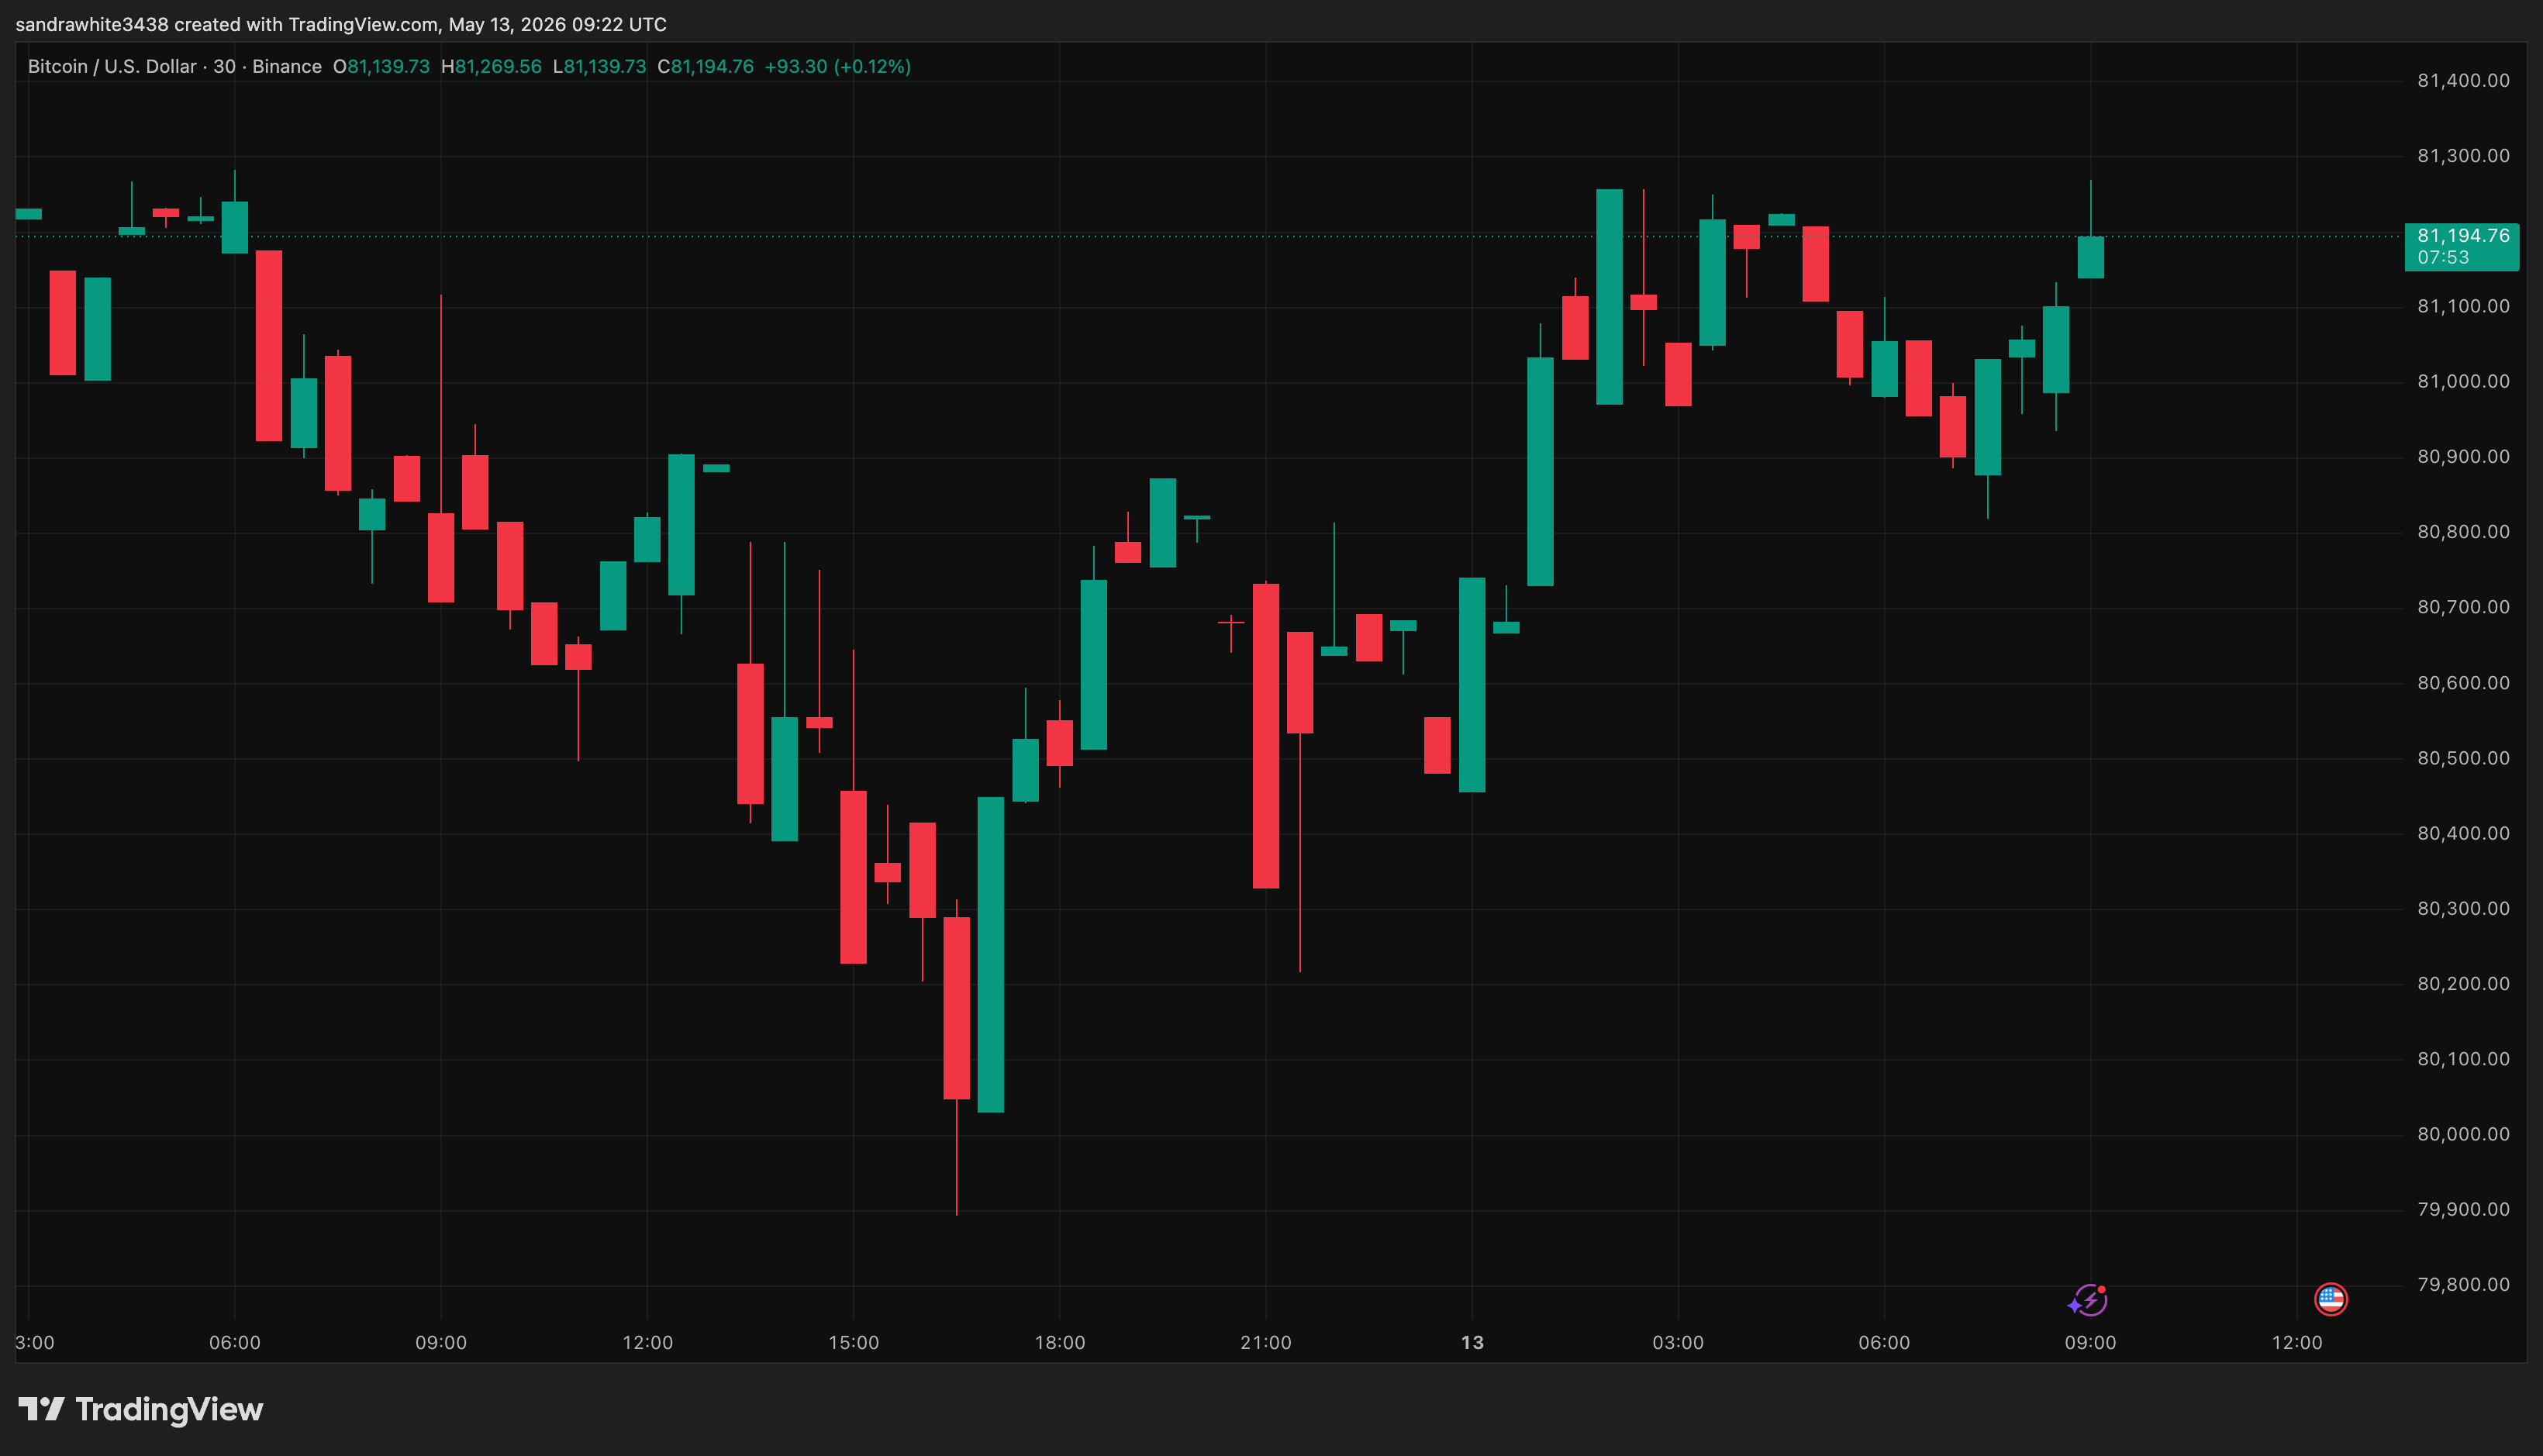
At the time of writing, Bitcoin is trading at $80,920 after moving between $79,879 and $81,227 over the past 24 hours. This narrow range shows that buyers are still active around the $80,000 level, preventing a clean breakdown below the zone for now.
The price action has also kept Bitcoin from showing any major sign of distribution, as support continues to hold near the lower end of the range. All that needs to happen now for bullish momentum is a weekly close above $84,000. However, a weekly close below $80,000 could shift the setup in favor of the bearish path.
0 Featured image created with Dall.E, chart from Tradingview.com 1 2 Bitcoin’s recent price behavior has been 3 4 5 everything the bulls hoped for 6 7 8 , and that may be precisely the problem. Since bottoming out around $63,000 in early April, Bitcoin has posted a sequence of higher highs and higher lows 9 0 1 and has now reclaimed 2 3 4 $80,000. 5 6 The structure looks bullish. However, technical analysis shows that Bitcoin has 7 8 9 now entered into 0 1 2 deceptive territory. 3 4 Bitcoin’s Uptrend May Be Hiding A Compression Phase 5 6 Bitcoin’s price action is now forming an interesting but deceptive pattern. The pattern in question is a rising wedge that has been forming on Bitcoin’s daily chart since February. 7 8 The setup 9 0 1 was highlighted by 2 3 4 crypto analyst Merlijn The Trader, who described Bitcoin’s current pattern as “the most deceptive pattern in crypto.” His chart places Bitcoin near the upper end of the wedge, with the $84,000 area acting as a key rejection zone. 5 6 Related Reading: 7 XRP’s Current Predicament Is Only Temporary; These Factors Will Drive It To $18 8 9 0 A rising wedge is formed when price action grinds upward along two converging trendlines, printing higher highs and higher lows in a narrowing channel. The pattern resembles an upward price trend where the market constantly hits higher levels and never falls below prior price lows before bouncing back on the surface. However, a rising wedge is known to resolve more bearishly than bullishly. 1
2 The chart shared by Merlijn shows Bitcoin pushing upward inside this structure, with the upper wedge boundary sitting around $84,000. That area is the zone where bulls may face their biggest test. 3
4 That makes the next move around the $80,000 to $84,000 5 6 7 area very important. 8 9 0 A clean move above the upper boundary would weaken the bearish wedge argument. A rejection around $84,000, followed by a breakdown under $80,000, would open up the path to lower price levels. 1
2 3 4 5 Bitcoin Price Chart. Source: @MerlijnTrader On X 6 7 8
9 Crash Below $60,000? 0 1 The $80,000 price level is now carrying both psychological and technical weight. Bitcoin recently reclaimed this level for the first time in months, helped by 2 3 4 improving market sentiment. 5 6
7 Merlijn’s chart turns that same level into the breakdown trigger. According to the outlook, a break below $80,000 would confirm weakness inside the wedge and open the way for a move down to $56,000. This does not mean Bitcoin is guaranteed to fall there, but it shows where the bearish projection comes from if the wedge resolves to the downside. 8 9 Related Reading: 0 Pundit Predicts When The XRP Price Will Rally To $12 1 2 3 At the time of writing, Bitcoin is trading at $80,920 after moving between $79,879 and $81,227 over the past 24 hours. This narrow range shows that buyers are still active around the $80,000 level, 4 5 6 preventing a clean breakdown 7 8 9 below the zone for now. 0
1 The price action has also kept Bitcoin from showing 2 3 4 any major sign of distribution, 5 6 7 as support continues to hold near the lower end of the range. All that needs to happen now for bullish momentum is a weekly close above $84,000. However, a weekly close below $80,000 could shift the setup in favor of the bearish path. 8
9 BTC price moving upward again | Source: 0 BTCUSD on Tradingview.com 12 Featured image created with Dall.E, chart from Tradingview.com 3