
Bitcoin has lost the $78,000 level as selling pressure intensifies and the market faces a wave of uncertainty that has reversed weeks of carefully built recovery momentum. The decline is not gentle — and a CryptoQuant analysis tracking Binance order flow has identified the specific mechanics behind the move that separate this sell-off from routine market volatility.
The data begins with a finding that immediately reframes the Bitcoin weakness as part of something broader. The selling pressure that drove Bitcoin below $77,000 was not isolated to a single asset or a single moment. It was aggressive, it was large-scale, and it appeared across multiple assets in a compressed timeframe that points to coordinated de-risking rather than organic price discovery.
For Bitcoin specifically, Binance Taker Sell Volume — which measures aggressive sellers choosing to exit immediately at market prices rather than waiting with limit orders — crossed the $1 billion threshold twice in the latest market window. The first spike arrived on May 15, when aggressive sell volume reached approximately $1.5 billion in a single session. The second came as Bitcoin broke below $77,000 for the first time since the beginning of May, with taker sell volume surging above $1.1 billion.
Two separate billion-dollar sell spikes in a compressed window describe a market under genuine, organized pressure — not a market drifting lower on thin volume and weak sentiment.
Two Assets, Two Billion-Dollar Sell Spike: One Market Moving Together
The CryptoQuant analysis extends the picture beyond Bitcoin to confirm that the selling was not asset-specific. Ethereum’s Binance Taker Sell Volume climbed above $1.1 billion as ETH moved toward levels below $2,100 — matching the scale and the timing of the Bitcoin sell spikes with a precision that removes coincidence as an explanation. Two of the largest crypto assets by market capitalization faced billion-dollar aggressive selling events on the same venue within the same market window.
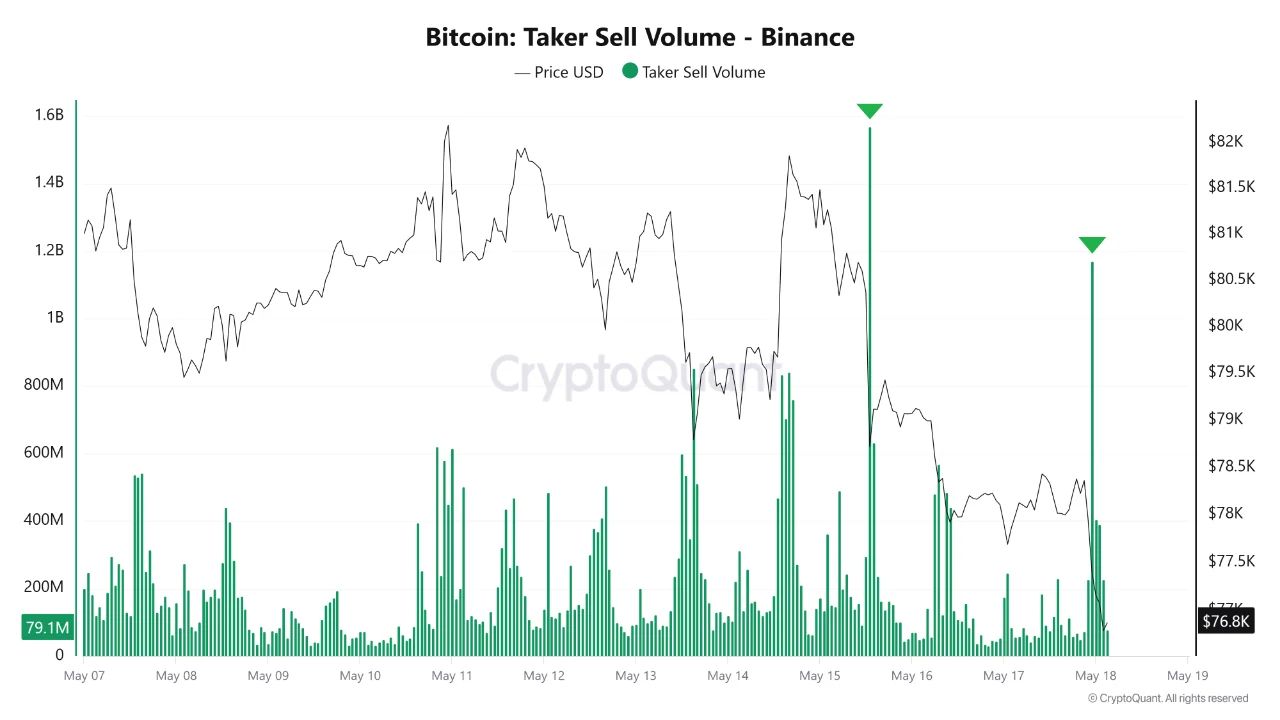
The cross-asset synchronization is the signal that matters most. Taker Sell Volume measures participants who choose to exit immediately — hitting available bids rather than placing limit orders and waiting for buyers to arrive. When this metric spikes during a price decline, it reflects urgency: sellers who needed or chose to exit regardless of the price they received. That behavior, appearing simultaneously across Bitcoin and Ethereum, points to forced de-risking at institutional scale rather than organic retail selling responding to price weakness.
The CryptoQuant assessment is honest about what the data confirms and what it does not. Synchronized billion-dollar sell spikes establish that sellers were clearly in control during the move, not that a deeper downtrend has been confirmed. The distinction matters for how the recovery should be evaluated.
The conditions for bullish momentum returning are specific. Aggressive sell volume needs to cool. Price needs to stabilize above key support levels while that cooling occurs. Until both conditions appear simultaneously, every bounce in the current environment faces the same supply structure that produced two separate billion-dollar sell events within a compressed window — and bounces that meet that kind of overhead tend to resolve the same way the previous attempts have.
Bitcoin Breaks Below Key Support As Selling Pressure Accelerates
Bitcoin is trading near $76,800 after losing the critical $78,000 level, a breakdown that significantly weakens the recovery structure that had been developing since the February capitulation event. The daily chart shows BTC now trading back below the 100-day moving average while continuing to face strong rejection beneath the descending 200-day moving average near the $82,000 region.
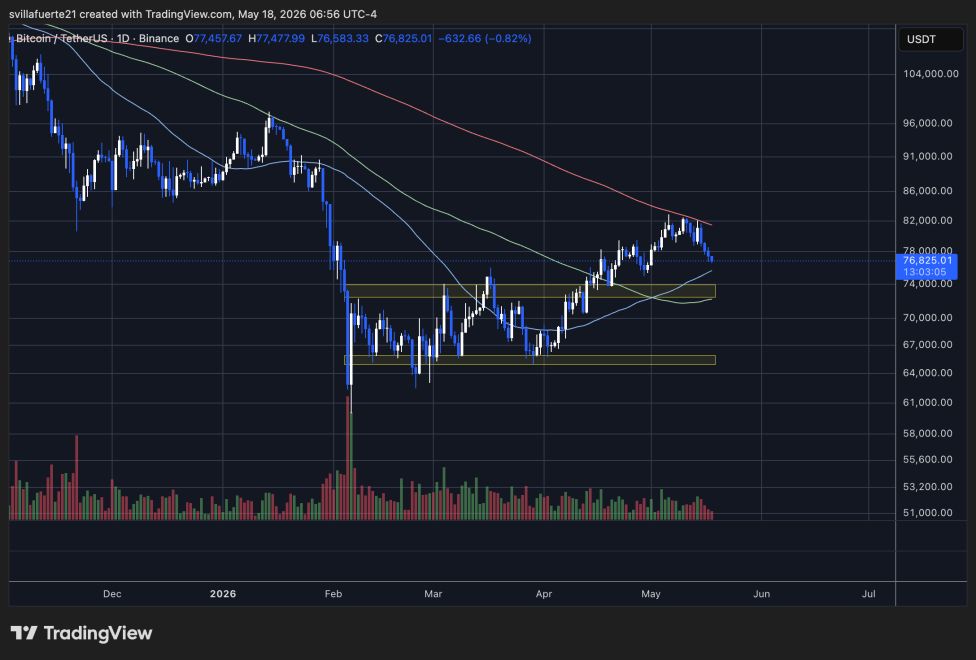
The recent rally carried Bitcoin from the low-$60,000 range toward local highs above $81,000, but momentum began fading once the price approached long-term resistance. Multiple failed breakout attempts created a lower-high structure near the top of the range, signaling weakening buyer conviction before the latest selloff accelerated.
Importantly, the decline is now pushing BTC back toward the highlighted demand zone between $72,000 and $74,000, an area that previously acted as the foundation for the April recovery. Losing that region could expose Bitcoin to a deeper retracement toward the broader support range near $64,000-$65,000, where buyers aggressively stepped in after February’s crash.
Volume during the latest decline has remained elevated, confirming that the move lower is being driven by active selling rather than passive lack of demand. Combined with the recent surge in Binance taker sell volume, the chart reflects a market currently dominated by defensive positioning and short-term de-risking from larger participants.
Featured image from ChatGPT, chart from TradingView.com