
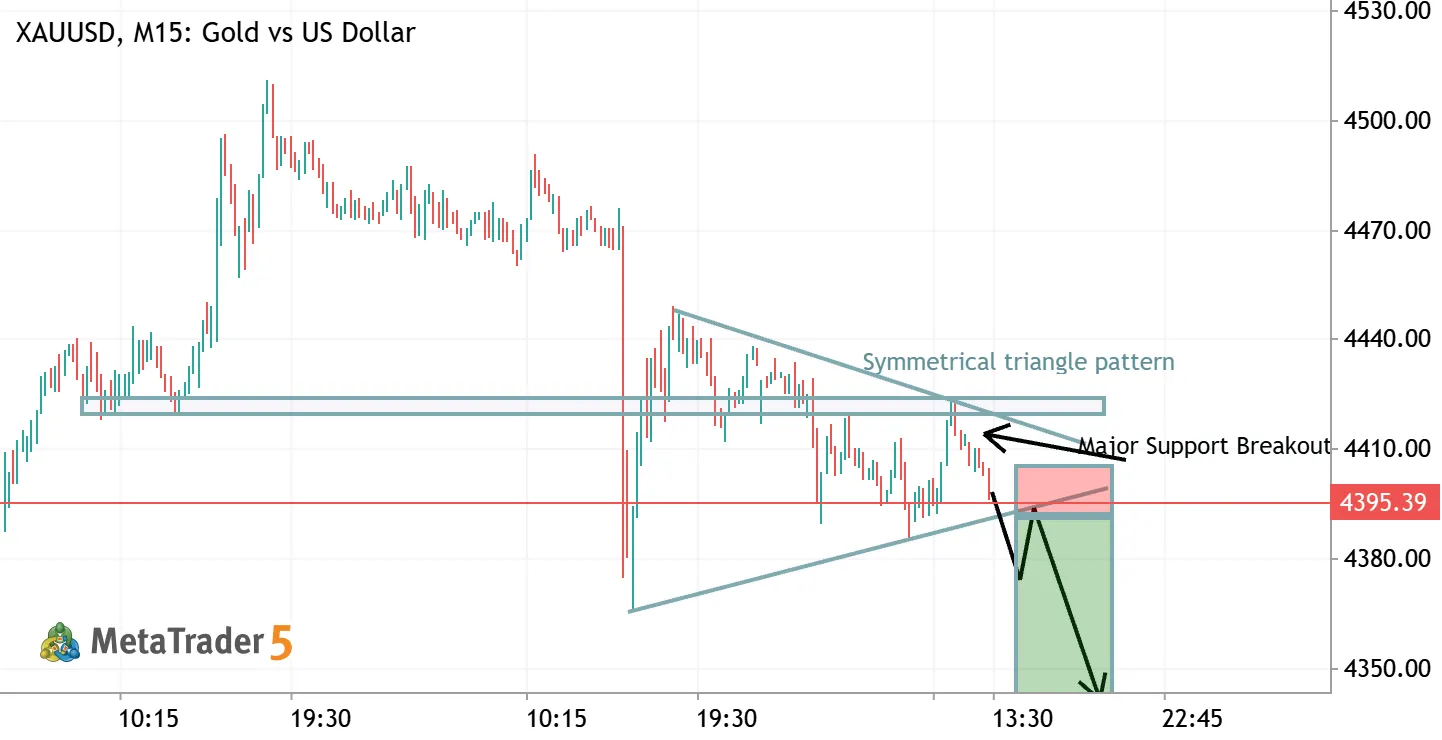
Gold is showing a clean technical continuation pattern on the 15-minute timeframe following a period of consolidation. Below is a breakdown of the structural setup and key levels to monitor:
Technical Analysis
- Pattern Breakout: Price has been coiling inside a Symmetrical Triangle Pattern following a sharp drop. It recently broke through lower support near the $4,395 level.
- Support Flip: The region between $4,415 – $4,425 previously served as major support. With the recent breakdown below the triangle's rising boundary line, this area now reinforces a strong overhead resistance zone.
- Price Projection: The projected path indicates a retest of the broken lower trendline/resistance zone near $4,395 before a potential continuation lower toward the $4,350–$4,360 target zone.
Potential Short Execution Logic
- Entry Zone: On a retest/pullback around $4,395 – $4,400.
- Stop Loss: Placed above the recent lower high / breakdown point around $4,410.
- Take Profit Target: Aiming for liquidity down at $4,350 – $4,360.
Algorithmic & EA Considerations
For traders utilizing MT5 Expert Advisors or automated breakout scripts:
- Breakout Confirmation: Filter trades by requiring an M15 close strictly below the triangle support line before triggering sell-stop orders.
- Retest Strategy: Set limit orders at the broken trendline ($4,395 area) to optimize risk-to-reward ratios rather than selling at market during the initial breakout candle.
How are you approaching Gold for today's session—trading the retest or waiting for a deeper pull back to the $4,420 resistance box?
Not a financial advice. This is only for educational purpose

 Perfil no MQL5
Novo comentário