

AMZN
#5
Amazon.com, Inc. - Common Stock
271.5 8 USD
+0.15%
Setor: Consumo cíclico de demanda
Base: USD
Moeda do lucro: USD
Faixa diária
Faixa anual
Mudança diária
+15.32%
Mudança mensal
+11.39%
Mudança em 6 meses
+13.77%
Mudança anual
+22.29%
Fechamento anterior
235.5 0
Open
271.4 9
Mínimo
271.4 7
High
271.5 8
Volume
845
Financials
2026
Current report, Q3 FY2026
AMAZON COM INC current report, Q3 FY2026
8-K
Current report, Q3 FY2026
AMAZON COM INC current report, Q3 FY2026
8-K
Quarterly report, Q2 FY2026
AMAZON COM INC quarterly report, Q2 FY2026
10-Q
Current report, Q2 FY2026
AMAZON COM INC current report, Q2 FY2026
8-K
Current report, Q2 FY2026
AMAZON COM INC current report, Q2 FY2026
8-K
Current report, Q2 FY2026
AMAZON COM INC current report, Q2 FY2026
8-K
Current report, Q2 FY2026
AMAZON COM INC current report, Q2 FY2026
8-K
Current report, Q2 FY2026
AMAZON COM INC current report, Q2 FY2026
8-K
Current report, Q2 FY2026
AMAZON COM INC current report, Q2 FY2026
8-K
Institutional holdings, Q1 FY2026
AMAZON COM INC institutional holdings, Q1 FY2026
13F-HR
Notícias
Morgan Stanley prevê gastos com nuvem de US$ 1,2 trilhão em 2027
Citi recomenda compra de 3 ações de chips após queda do setor
Futuros da bolsa canadense recuam após quatro meses consecutivos de alta
X-energy investe US$ 8 milhões para dobrar capacidade de produção de grafite
Canaccord vê aumento de gastos com IA em forte temporada de balanços
Histórico sugere que a volatilidade rotacional deve diminuir nas próximas semanas, diz Goldman Sachs
Após cinco ganhos de 50%+ em julho, nova lista de ações da IA para agosto já está disponível
Ibovespa e dólar hoje: Santander dispara com OPA e balanços impulsionam NY
E.U.A. - Ações fecharam o pregão em alta e o Índice Dow Jones Industrial Average avançou 0,53%
Wall Street fecha em alta, com Amazon acalmando temores em relação à IA
Wall Street fecha em alta com tecnologia, mas Nasdaq derrete 3% e tem 2º mês de perdas
Ações da semana no Investing.com
Gráficos e ideias
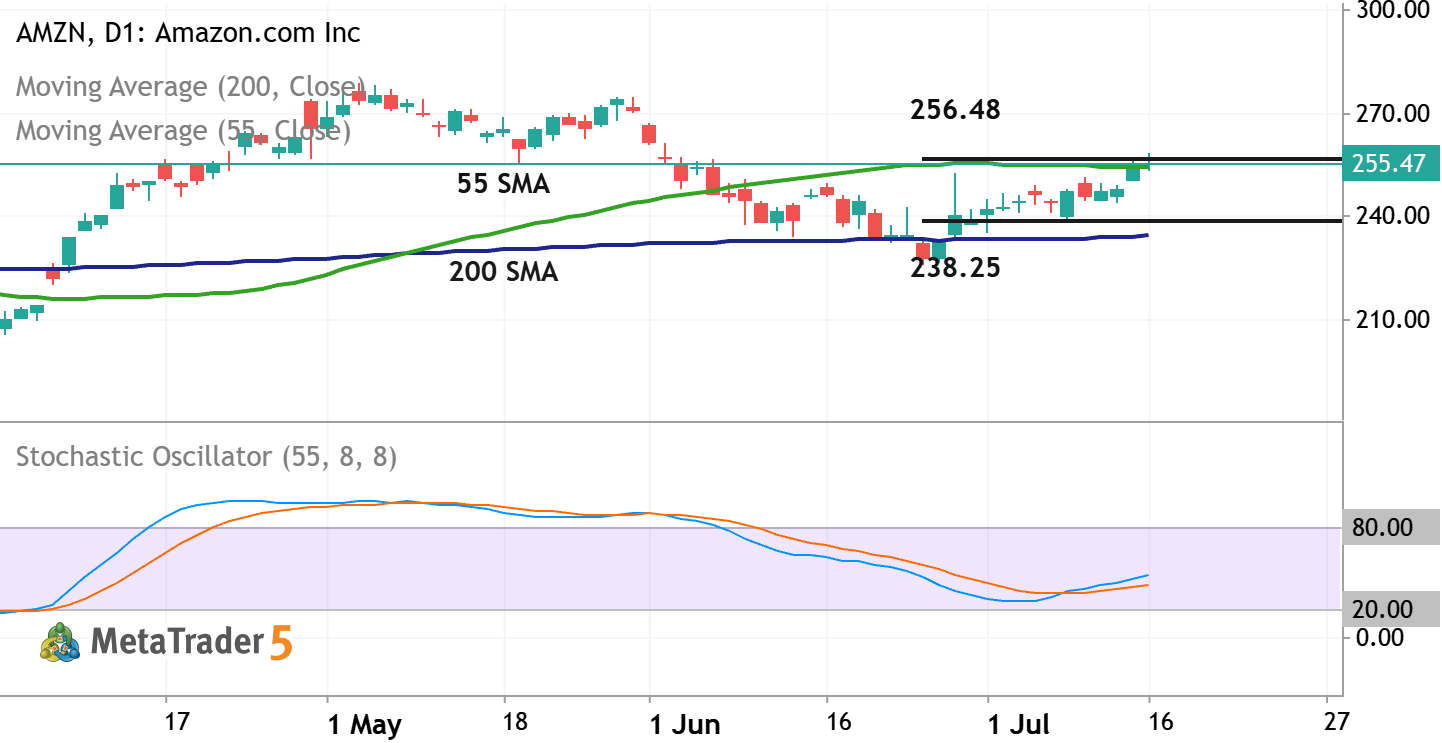
AMZN - Daily Trading Forecast
Daily price is located above 200 SMA in the bullish area of the chart. The Stochastic oscillator is showing the uptrend to be started by crossing the 50 level to above, and the price is trying to break the resistance level at 256.48 together with 55 SMA to above for the strong bullish trend to be continuing. If the price breaks resistance at 256.48 together with 55 SMA to above so the primary bullish market condition will be continuing for daily price. If the price crosses support level at 238.25 together with 200 SMA to below so the primary bearish reversal will be started. Alternatively, the price will be on secondary ranging above 200 SMA to be inside s/r levels waiting for direction of the strong trend tioo be started. Trading Summary : bullish ranging for direction.
0 
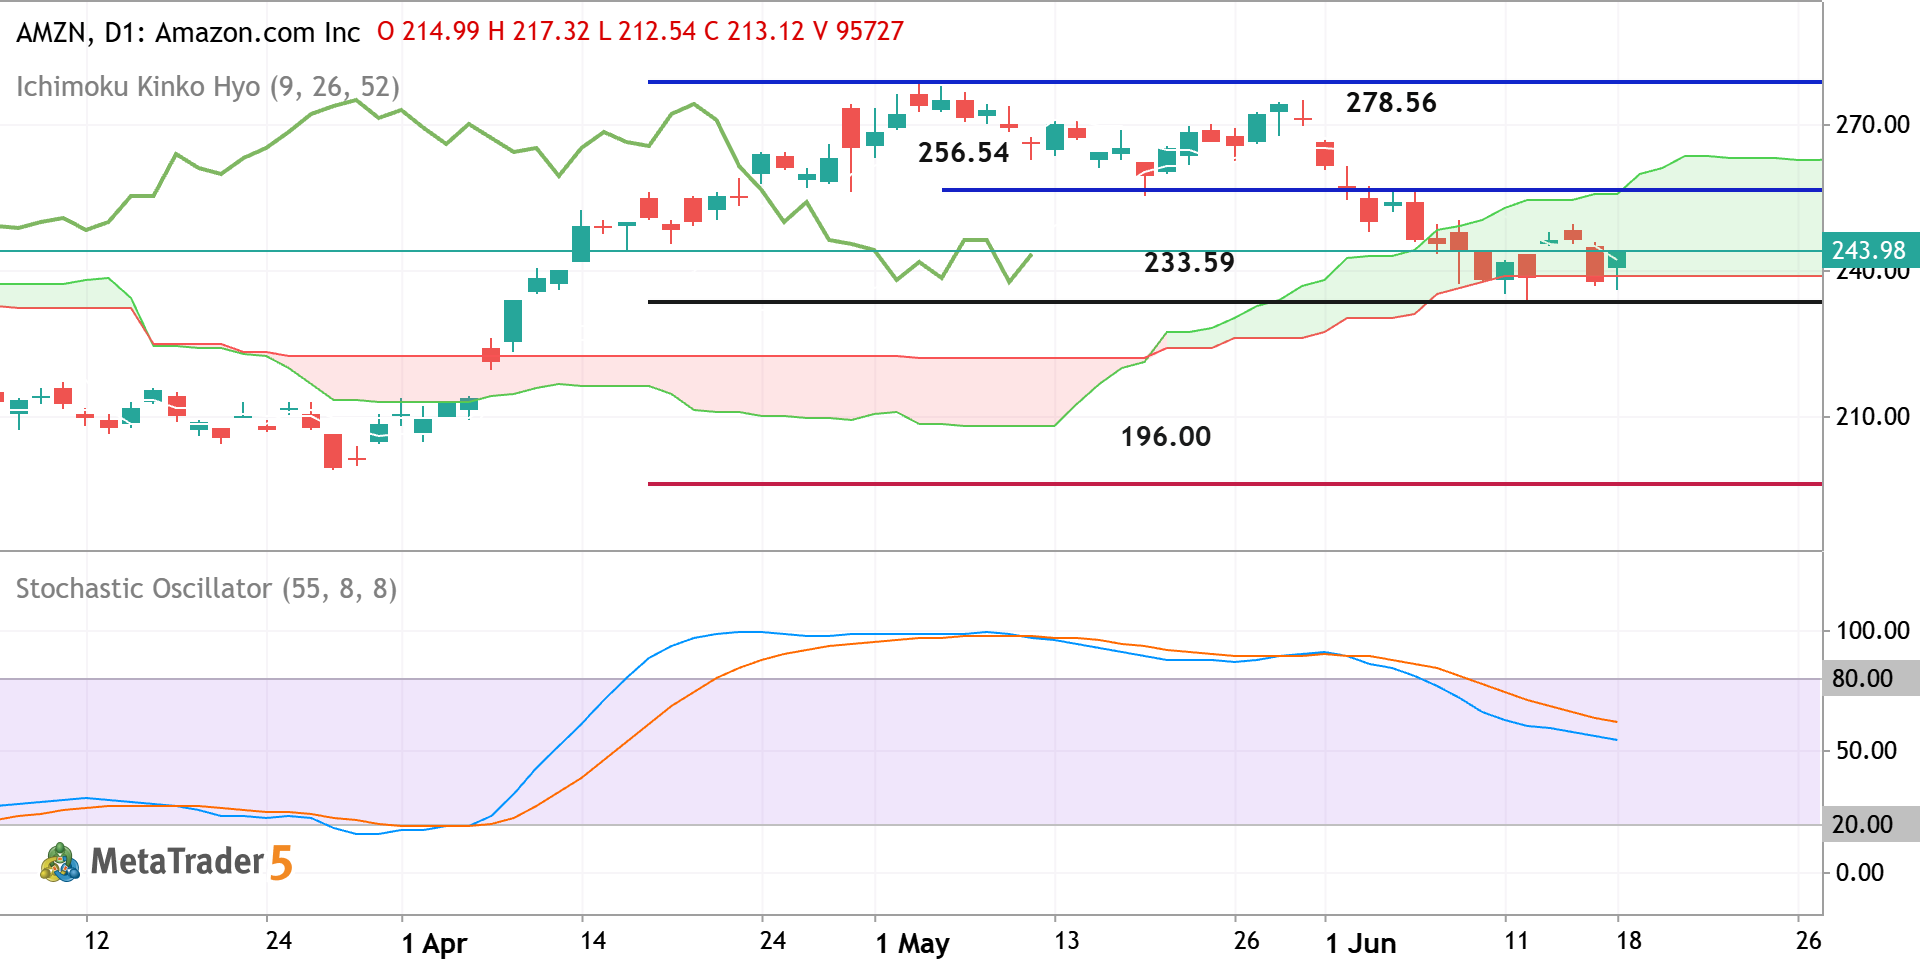
AMZN - Breakdown with the Possible Bearish Reversal
Daily price is located near and inside Ichimoku cloud for trying to break the support level at 233.59 to below for the primary bearish reversal to be started. Chinkou Span line of Ichimoku indicator broke the historical price to below for the strong breakdown to be started for the possible bearish reversal of the daily price movement. If the price crosses the 233.59 support ot below so we may see the primary bearish reversal with 196.00 as a possible target. If the price breaks the resistance at 256.54 to above so the primary bullish trend will be resumed with 278.56 target to re-enter, Alternatively, the price will be on secondary ranging to be inside and near the Ichimoku cloud waiting for direction. Trading Summary : breakdown with the possible bearish reversal
1 
The AMZN doesn’t have other trading ideas at this time
Browse ready-made trading ideas or select a symbol and create your own
Go to Charts and Trading Ideas