

XOM
#17
ExxonMobil Holdings Corporation Common Stock
164.5 6 USD
+0.02%
Market Price
Setor: Energia
Base: USD
Moeda do lucro: USD
Faixa diária
Faixa anual
Mudança diária
+2.22%
Mudança mensal
+7.23%
Mudança em 6 meses
+5.87%
Mudança anual
+44.52%
Fechamento anterior
160.9 8
Open
164.4 9
Mínimo
164.2 0
Máximo
164.7 0
Volume
3 741
Financials
Valor Q2, 26 Current
Key stats
Valuation ratios
Profitability ratios
Liquidity ratios
Solvency ratios
Per share metrics
Notícias
Acordo petrolífero de Trump com Venezuela gera preocupações em alguns produtores, dizem fontes
Por que as ações da ConocoPhillips estão subindo hoje?
Summit Midstream toma decisão de investimento em expansão de gasoduto
Ações de energia disparam com novos ataques entre EUA e Irã
Pentágono planeja adquirir participação de 35% em empreendimento petrolífero na Venezuela
Margens de gasolina no noroeste europeu atingem maior nível desde 2022
Bacia Permiana entra em novo ciclo de crescimento do gás natural
Exxon Mobil e LyondellBasell disputam ativos químicos da Shell nos EUA
Margens de gasolina no noroeste europeu sobem com forte demanda
Exxon alerta para pico de produção em Tengiz e mira Kashagan no Cazaquistão
Margens de gasolina no noroeste europeu sobem com oferta mais restrita
Gráficos e ideias
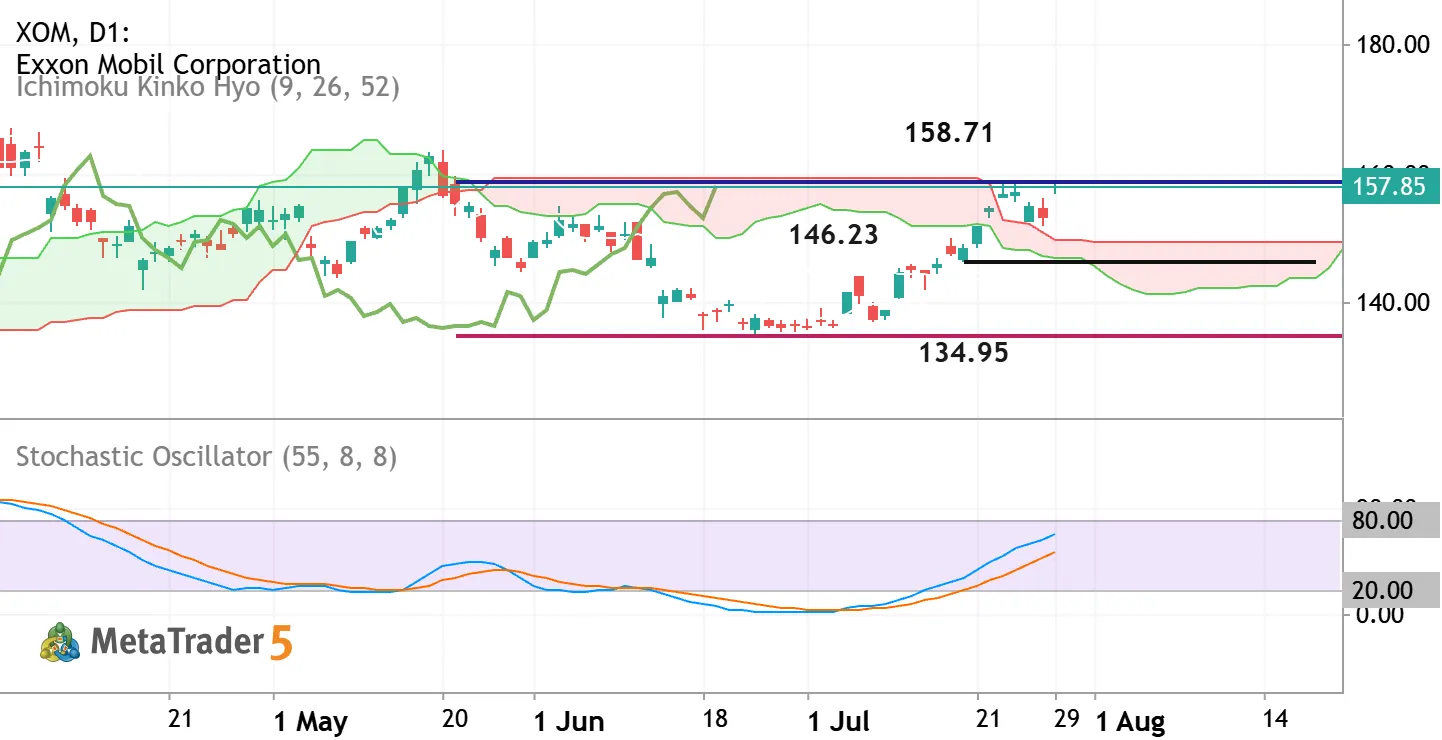
XOM - Daily Trading Forecast
The daily price is located near and above Ichimoku cloud in the bullish area of the chart: Chinkou Span line of Ichimoku indicator already broke the historical price to above for the good breakout to be started, and the price crosses the Ichimoku cloud to above as well for the daily primary bullush reversal. If the price breaks resistance level at 158.71 so the strong bullish trend may be continuing. If the price crosses support level at 146.23 to 134.95 as the nearest possible target so primary bearish trend will be resumed. Alternatively, the price will be on secondary ranging to be near and inside Ichimoku cloud and within s/r channel waiting for direction of the strong trend to be started. Trading Summary : breakout with the possible daily bullish reversal


The XOM doesn’t have other trading ideas at this time
Browse ready-made trading ideas or select a symbol and create your own
Go to Charts and Trading Ideas