
Sharing technical analysis and market insights
Focused on price action & smart money concepts
For educational purposes only
Gráficos e ideias
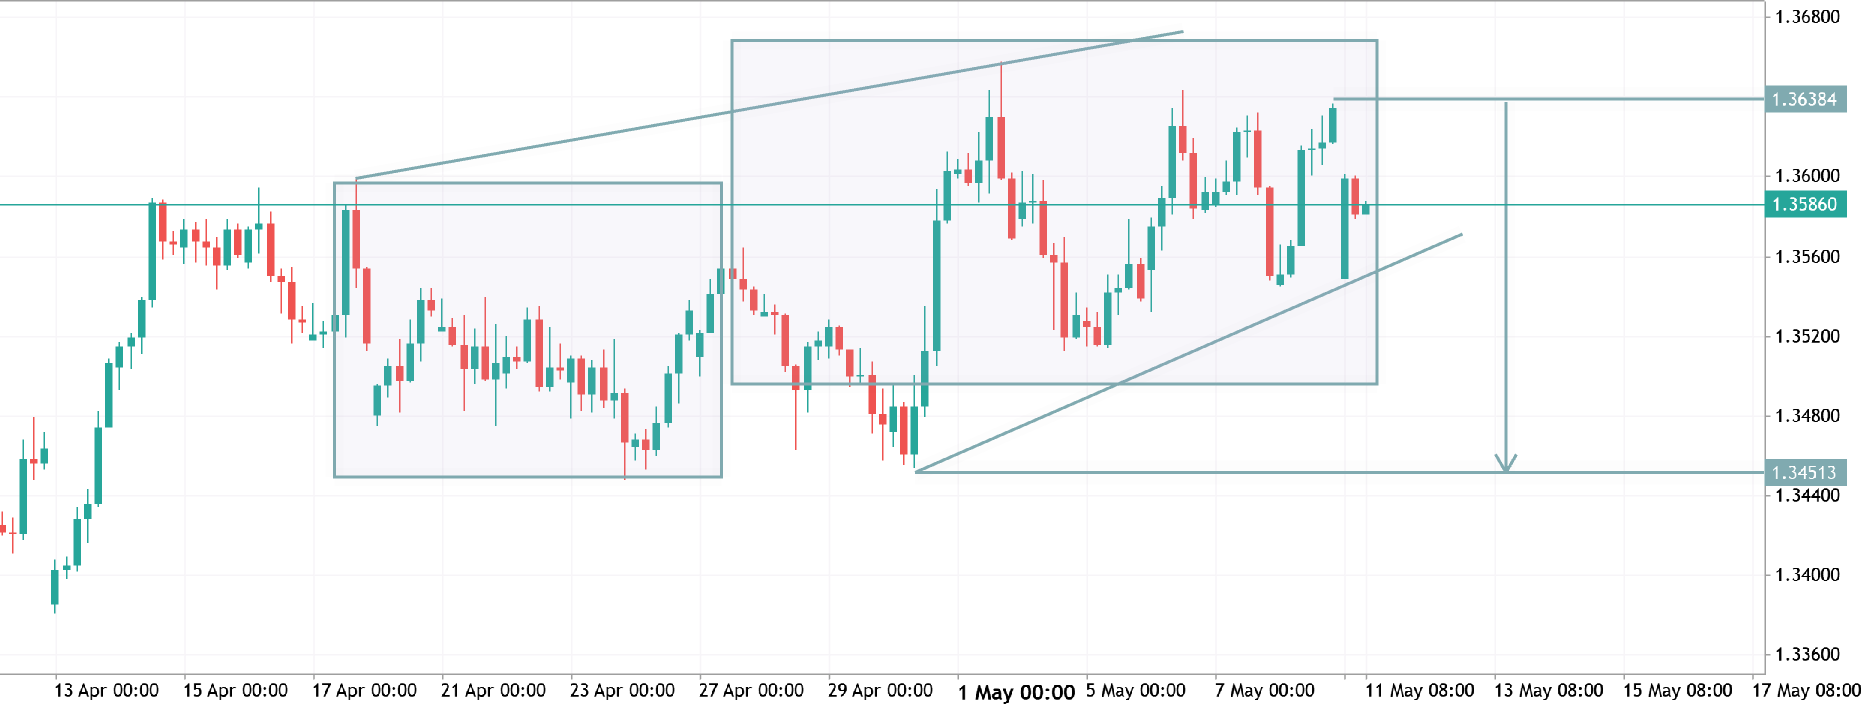
gbpusd h4 analysis
GBPUSD H4 is respecting the rising channel but showing weakness near resistance. A breakdown below the trendline could trigger a bearish move toward the 1.3450 support zone. Buyers need a strong breakout to keep the bullish momentum alive. 📊
2026.05.11 05:24 0 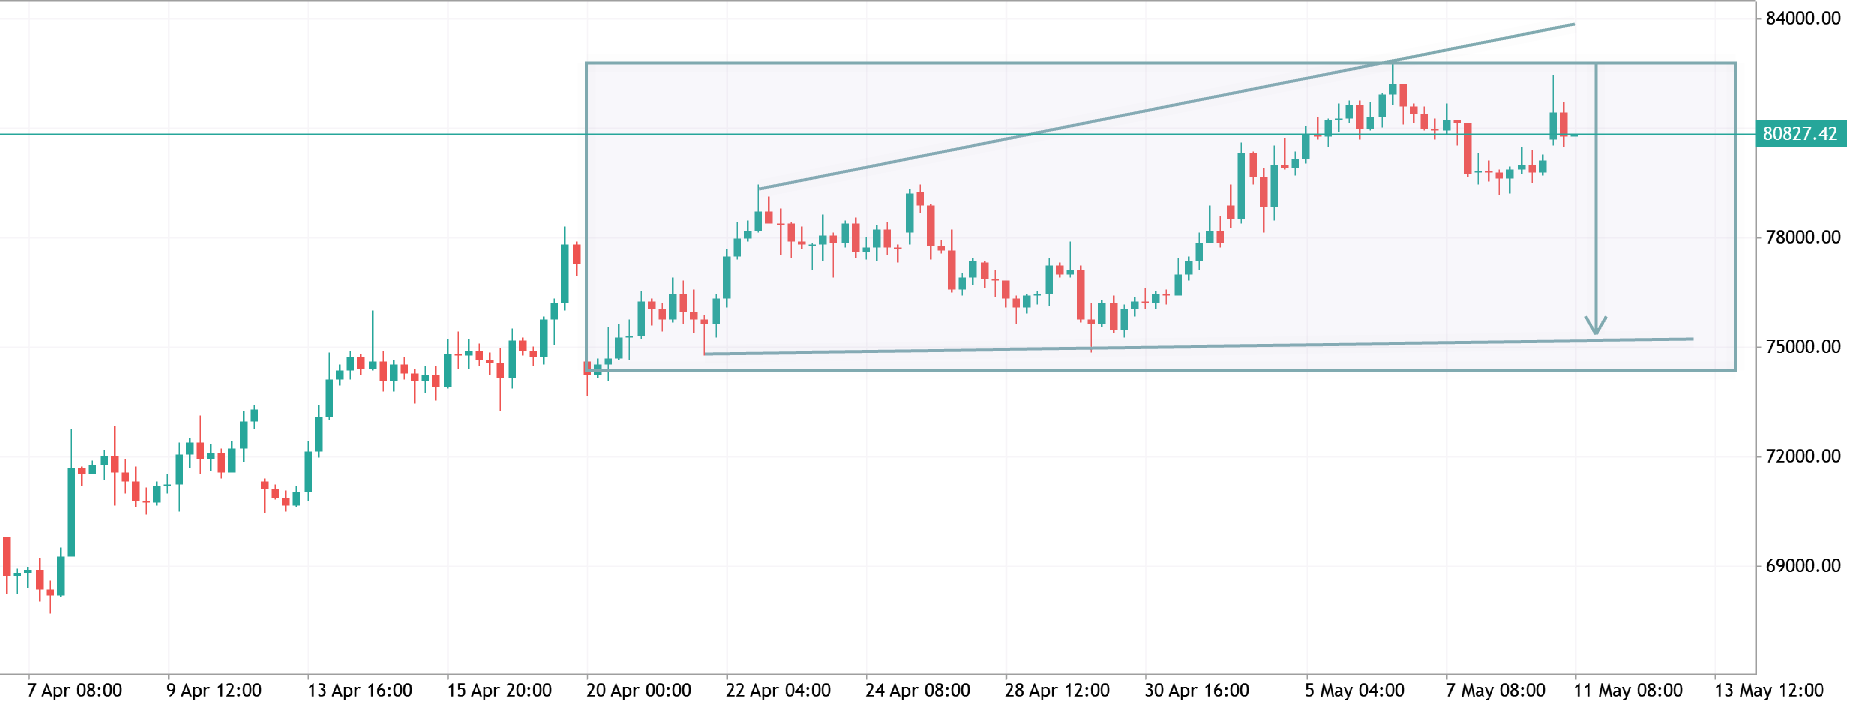
btcusd h4 analyisi
BTC looks weak near upper channel resistance on H4. Price rejected from the supply zone and a bearish move toward 75K support is still possible. As long as price stays below resistance, sellers remain in control. 📉
2026.05.11 05:12 0 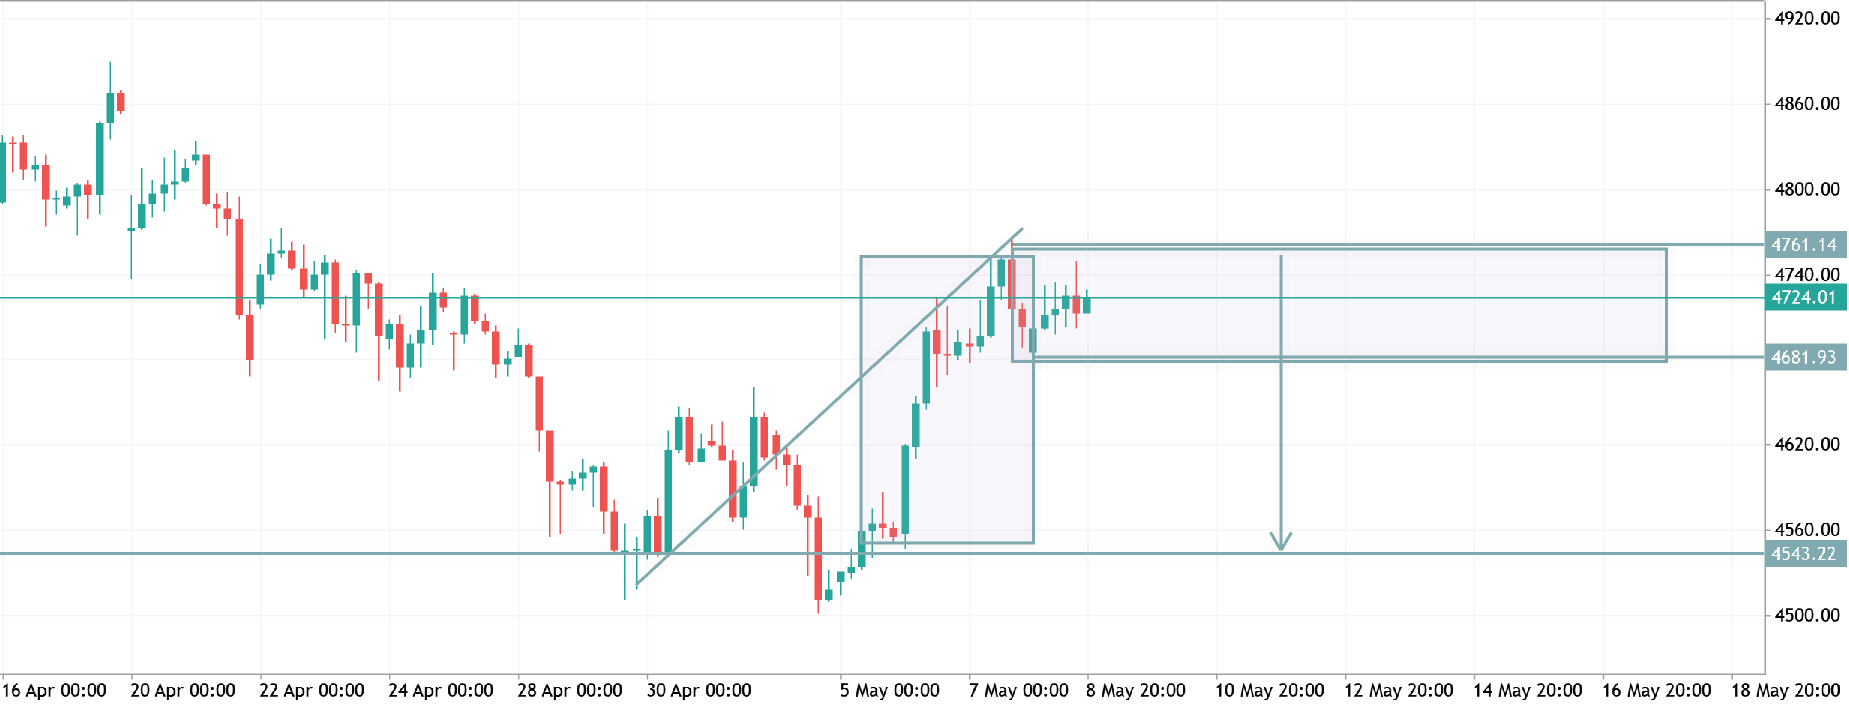
xauusd h4 analysis
XAUUSD H4 Analysis: Price is consolidating below a key resistance zone around 4740–4760 after a strong bullish impulse. Rejection from the supply area suggests a possible bearish correction toward 4580–4540 if sellers maintain control. A clean breakout above resistance could continue the bullish trend. Trade with confirmation and proper risk management.
2026.05.10 11:11 6 
btcusd h1 analysis
BTCUSD H1 Outlook 📉 Price is trading inside a bearish structure below the descending trendline. Key support around 79.5K is holding for now — a breakout above resistance may start a bullish correction toward 81K+, while failure to break could extend the bearish move. 🚀
2026.05.08 08:26 6 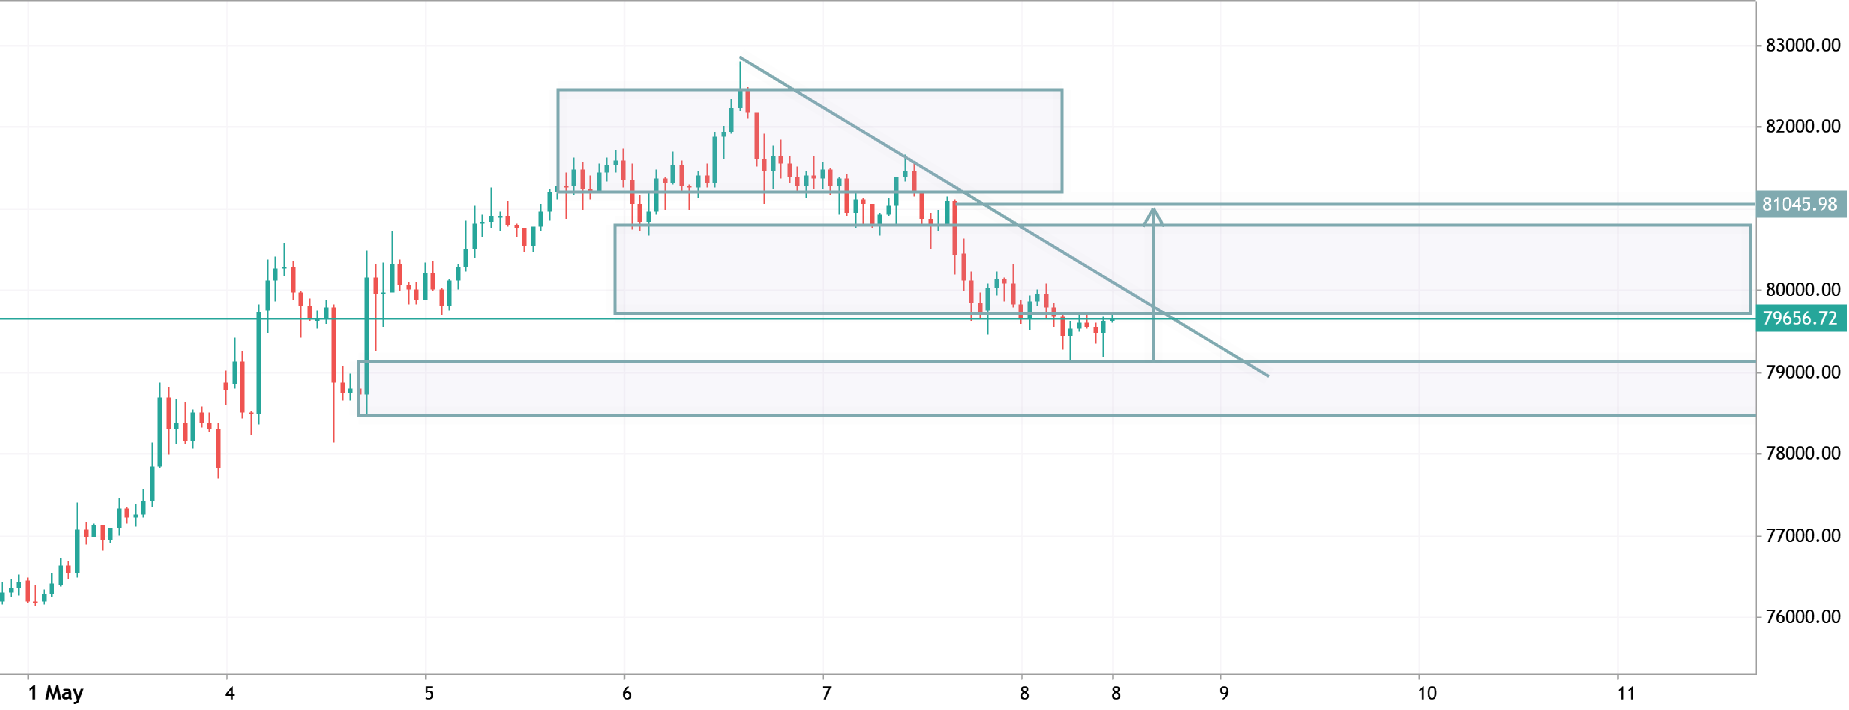
btcusd h1 analysis
BTCUSD H1 Outlook 📉 Price is trading inside a bearish structure below the descending trendline. Key support around 79.5K is holding for now — a breakout above resistance may start a bullish correction toward 81K+, while failure to break could extend the bearish move. 🚀
2026.05.08 08:25 0 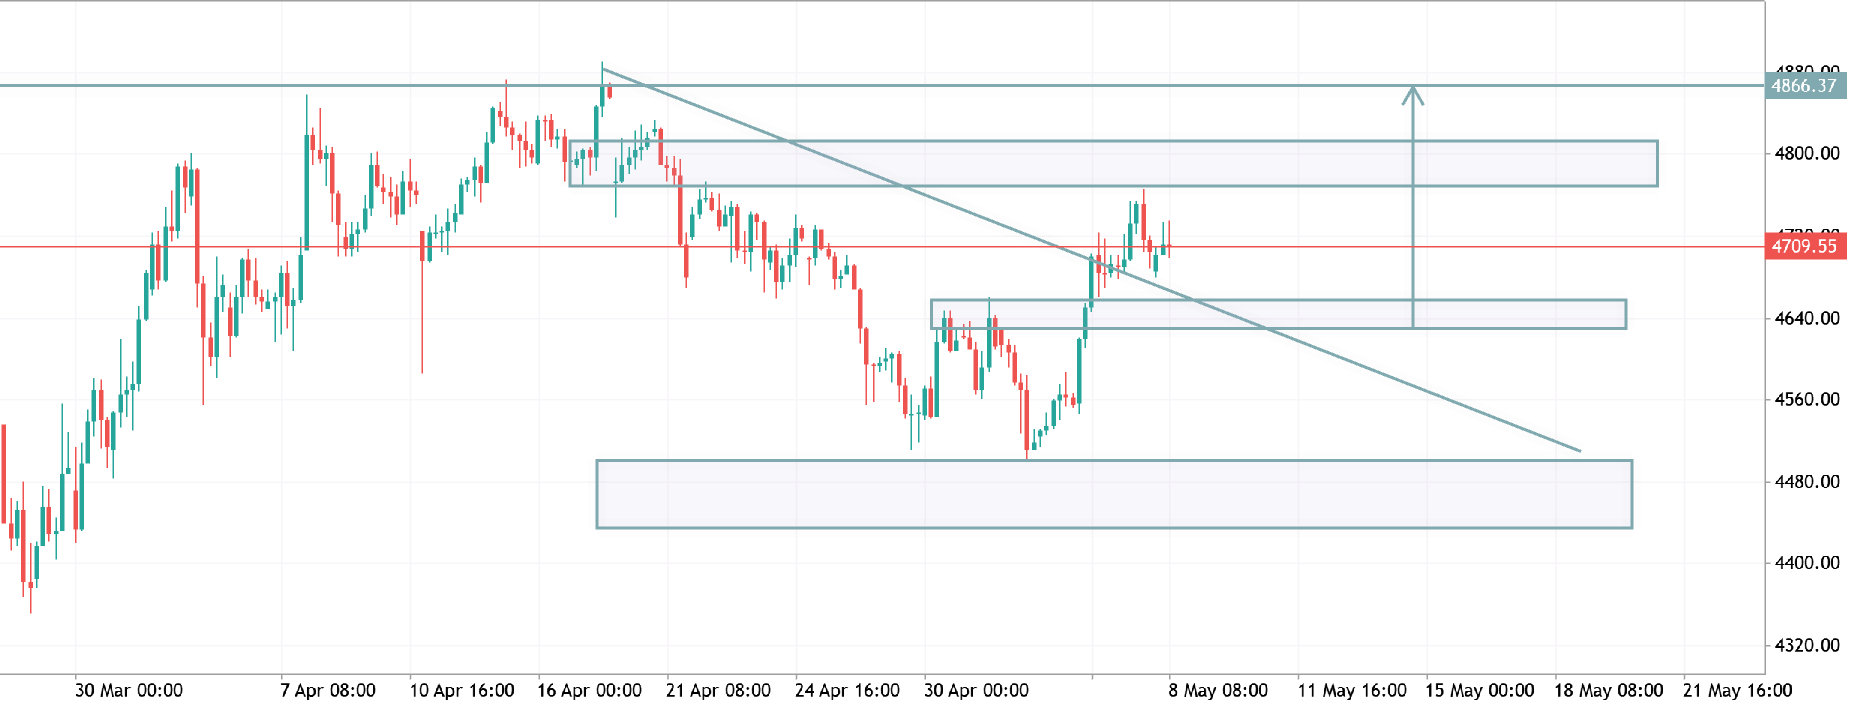
xauusd h4 analysis
XAUUSD H4 Analysis 📈 Price is respecting the descending trendline and showing strong bullish recovery from support. A clean breakout above 4740 could push the market toward 4800+ resistance zones. Buyers remain in control while price holds above the trendline support. 🔥
2026.05.08 08:08 0 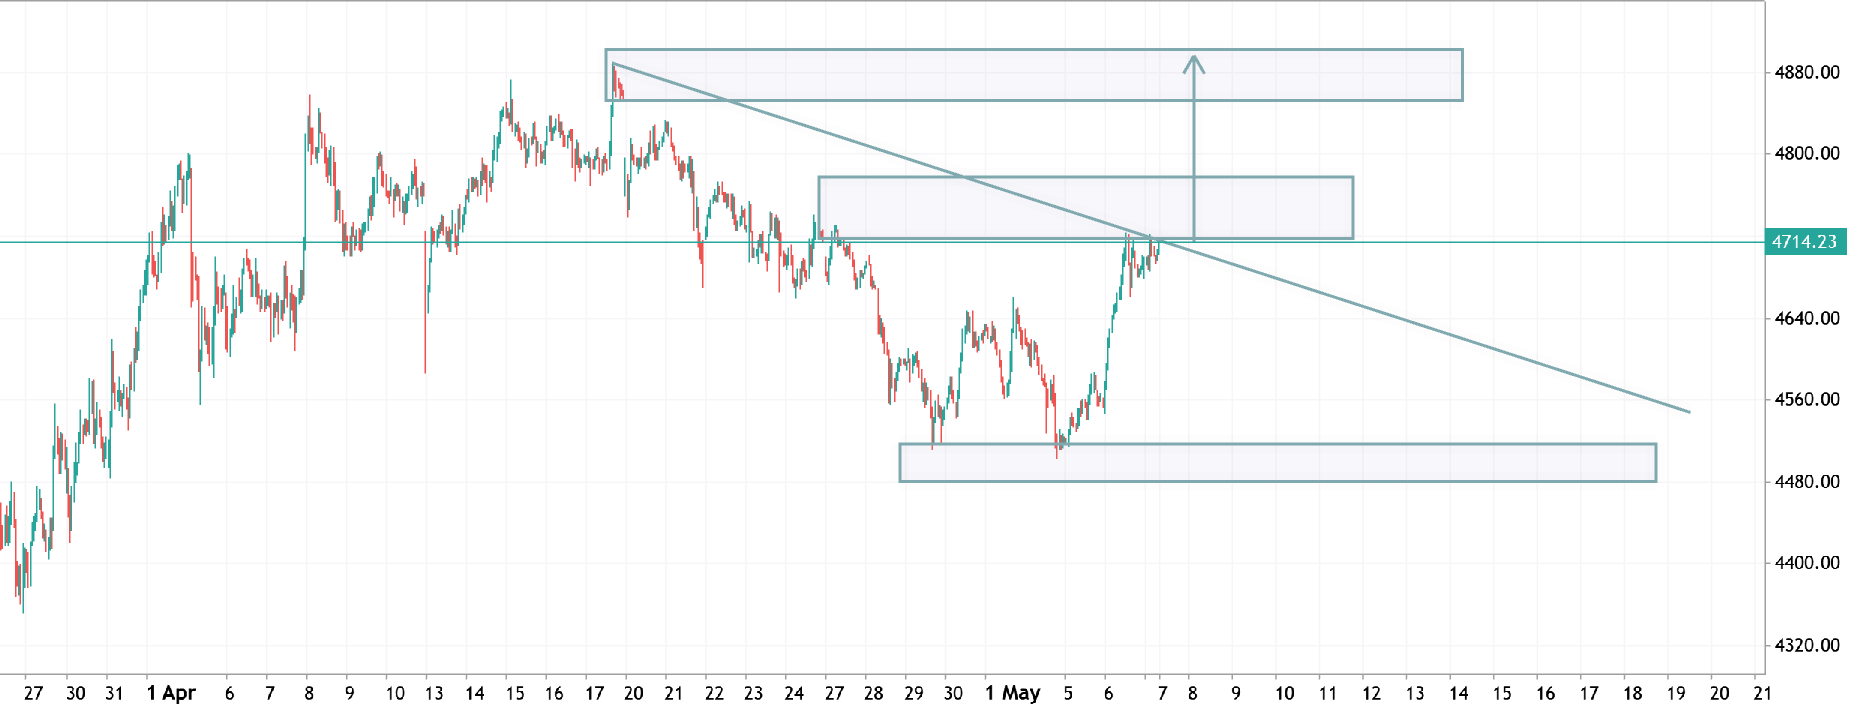
xauusd h1 analysis
XAUUSD H1 Analysis 📊
Gold is reacting from a strong support zone after a clear downtrend. Price is now testing the descending trendline resistance around 4710–4720.
A successful breakout and retest could push the market toward the 4780–4820 supply zone. Failure to break above may continue bearish pressure toward 4480 support again.
🔹 Bias: Bullish above trendline 🔹 Key Resistance: 4780 – 4820 🔹 Key Support: 4480 🔹 Watch for breakout confirmation before entry.
2026.05.07 06:42 0 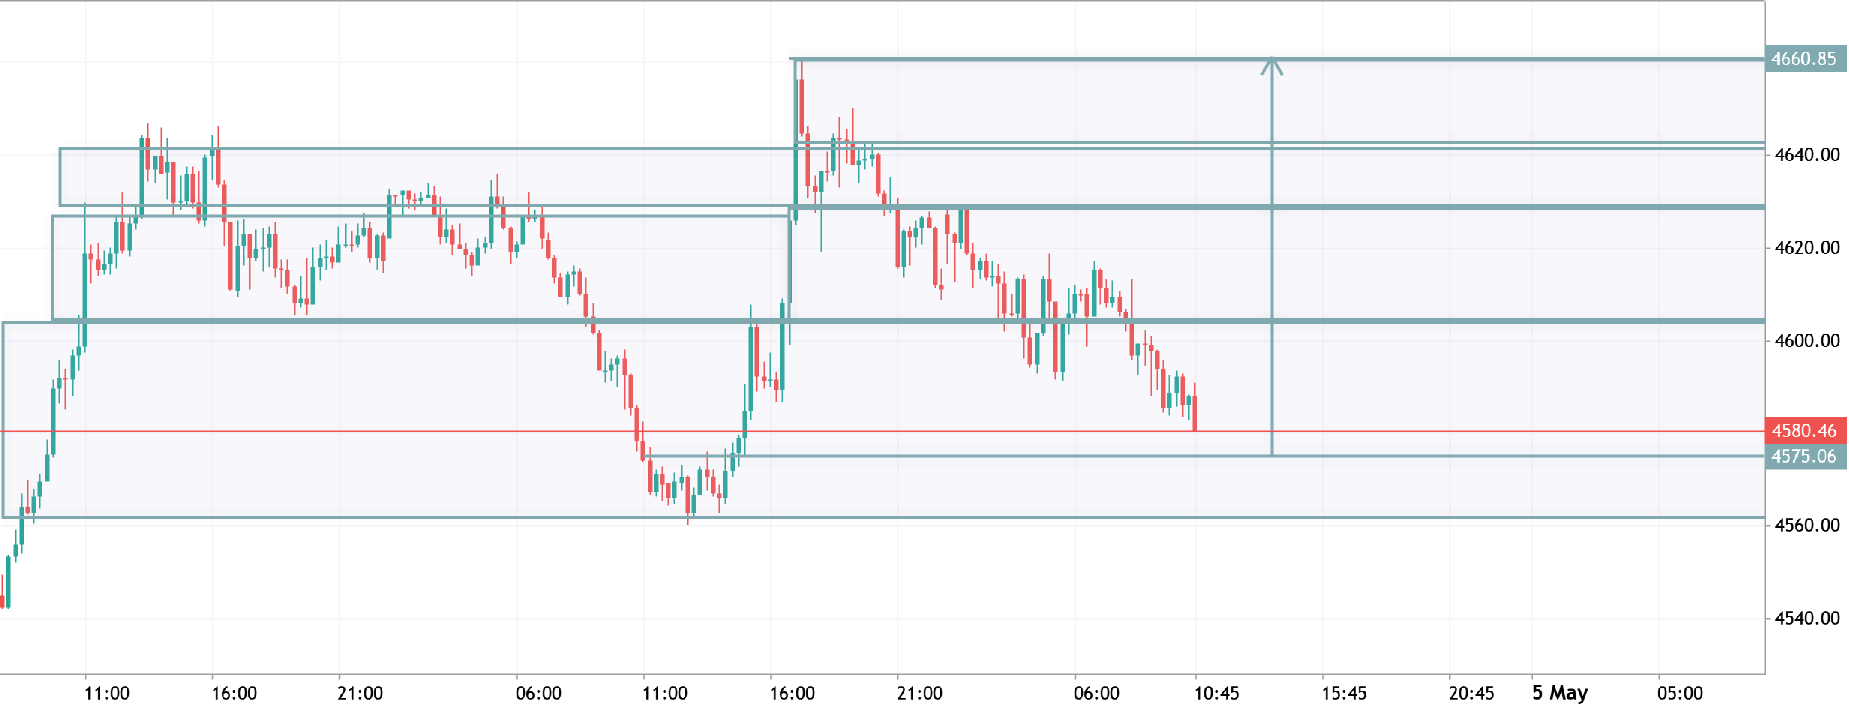
xauusd m15 analysis
XAUUSD M15 is showing a bearish intraday structure after failing to hold above the 4620–4640 resistance zone. Price is now approaching key support near 4575. A breakout below this level could trigger further downside momentum, while a rebound may offer short-term recovery toward 4600+. Trade with confirmation and proper risk management.
2026.05.04 08:08 0 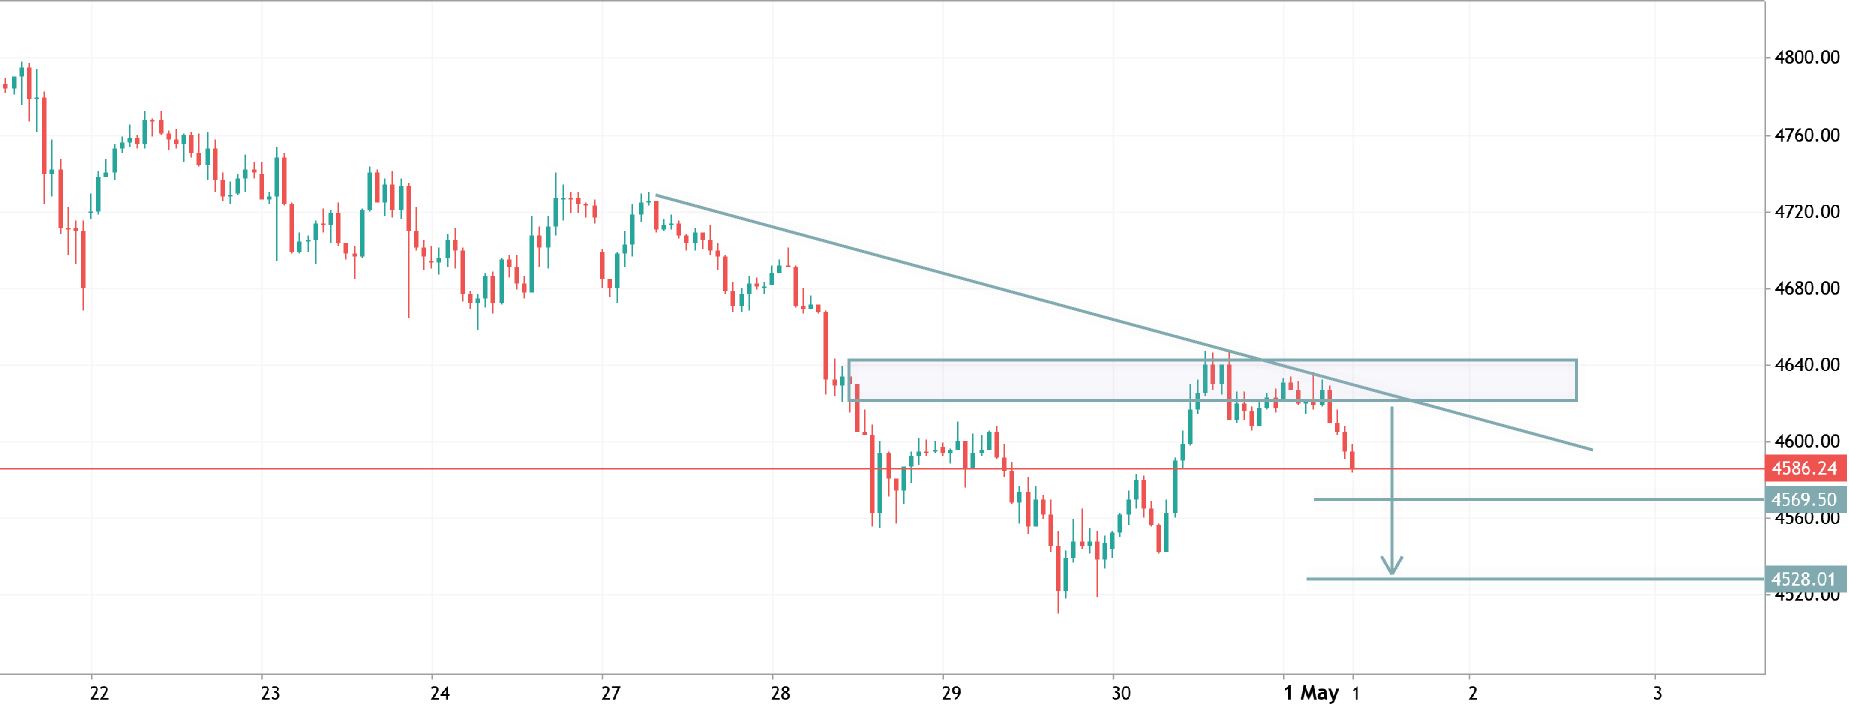
xauusd h1 analysis
XAUUSD H1 Analysis 📉
Price rejected the key supply zone around 4620–4630 and continues trading below the descending trendline. Bearish momentum remains active while support at 4560 is under pressure. A clean breakdown could push price toward the 4528 area in the short term. Sellers stay in control unless buyers reclaim the trendline resistance.
2026.05.01 07:51 0 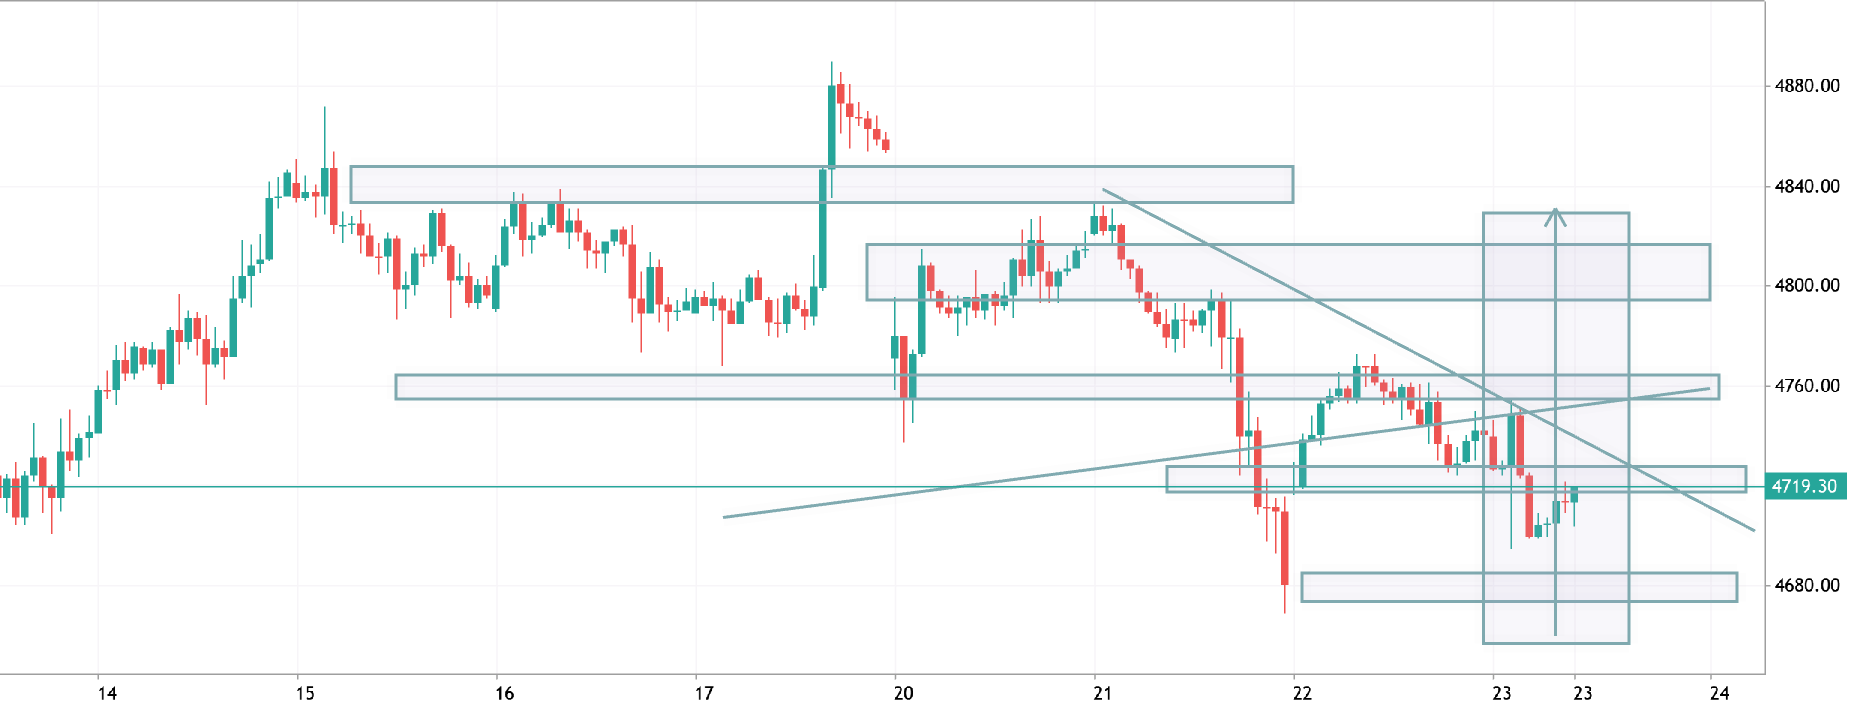
xauusd h1 analysis
XAUUSD H1 Analysis
Price is trading inside a descending structure with clear lower highs and lower lows, showing short-term bearish pressure. Currently reacting from a demand zone near 4710–4720, but still below key resistance.
🔹 Bearish scenario: Rejection from 4745–4760 zone can push price lower toward 4680–4660. 🔹 Bullish scenario: Break and hold above 4760 opens upside toward 4800.
Overall bias remains sell on rallies unless structure breaks.
2026.04.23 07:55 0 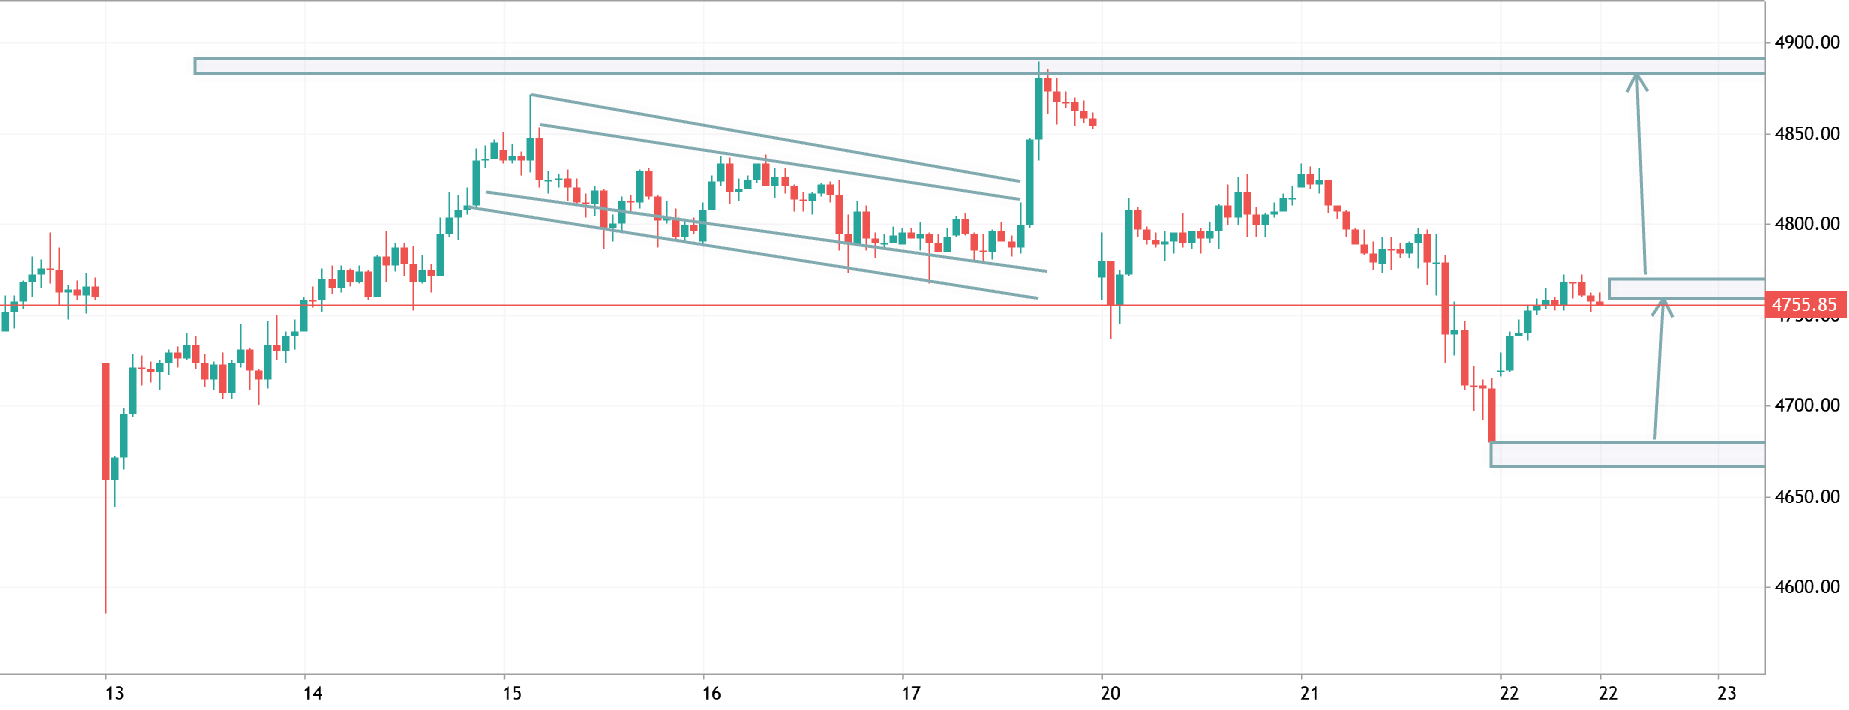
xauusd h1 analysis
XAUUSD H1 Analysis
Price bounced strongly from the 4680 demand zone and is now testing minor resistance around 4760. Momentum is shifting bullish after a sharp rejection from lows.
If price holds above 4760, expect continuation toward 4840–4880 supply zone. However, rejection here could lead to a retest of 4700–4680 support.
Bias: Bullish above 4760 Key Levels: 4760 resistance flip | 4680 support
2026.04.22 09:42 0 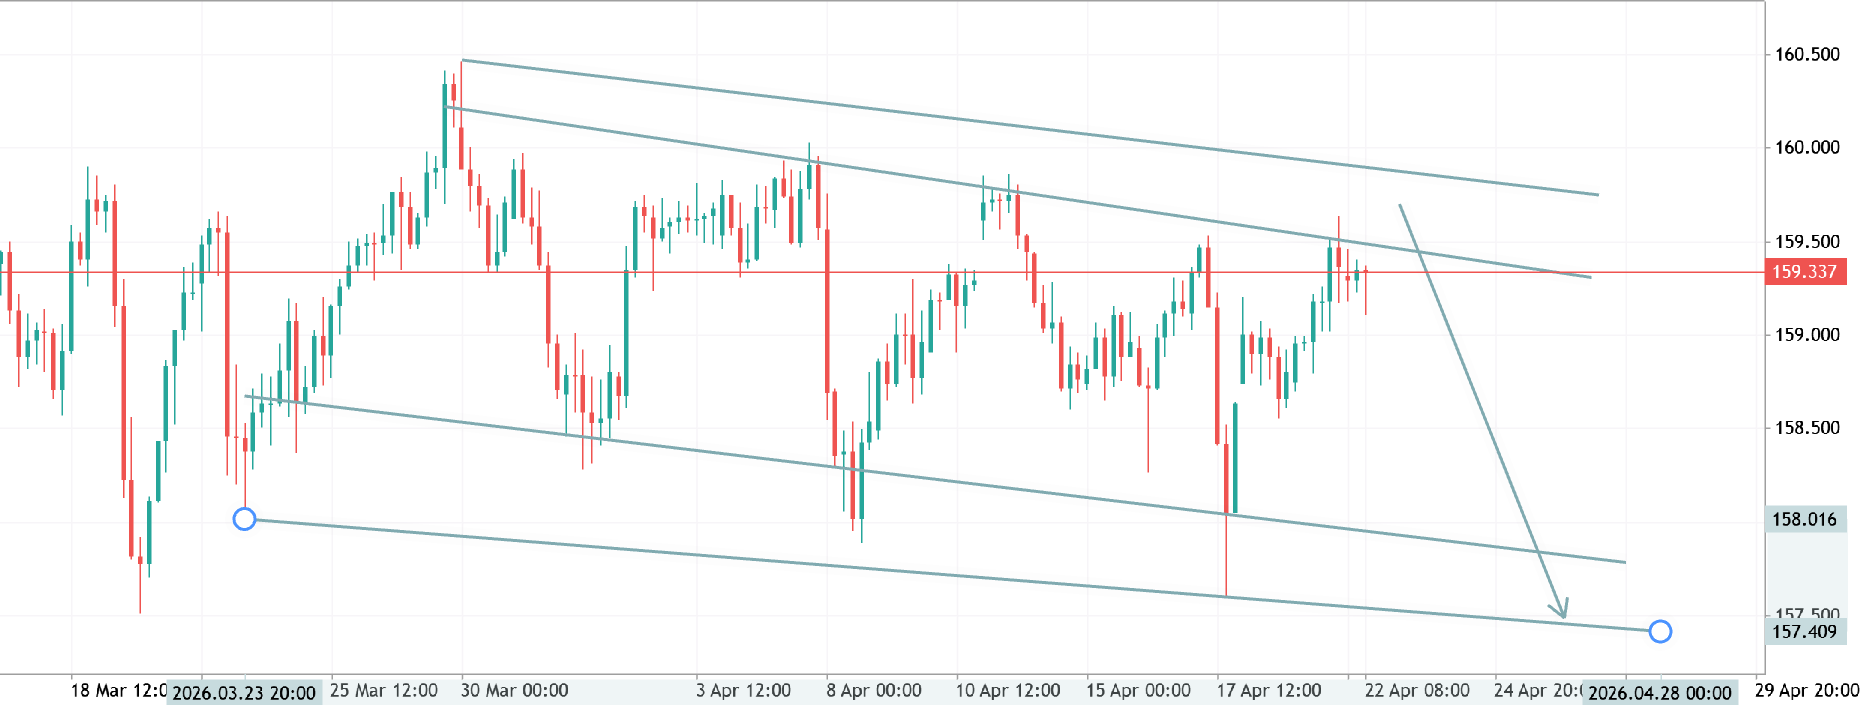
usdjpy h4 analysis
USDJPY H4 Analysis Price is respecting a descending channel and currently testing key resistance around 1593–1595. Rejection from this zone suggests bearish pressure remains intact. As long as price stays below the trendline, expect a downside move toward 1580 and potentially 1570. A clean breakout above 1595 would invalidate the bearish setup and open room for higher levels. Bias: Bearish below resistance Key Levels: 1595 resistance | 1580–1570 support
2026.04.22 08:55 0