Gráficos e ideias
Trading Ideas for 2026: GBPUSD - Technical Forecast and Levels
Weekly price is above 200 SMA on the bullish area of the chart. 100 SMA together with 55 SMS are indicator for the price the ranging market condition for trying to the primary bullish trend to be resumed. Ascending triangle pattern was formed, and if the price breaks resistance at 1.3534 to above so the bullish trend will be resumed. Alternatively, the price will be on secondary ranging within the primary bullish market condition. Recommendation: wait for the price to break 1.3534 resistance for possible buy position; otherwise - ranging.
2026.01.08 10:38 3
Trading Ideas for 2026: XAGUSD - Technical Forecast and Levels
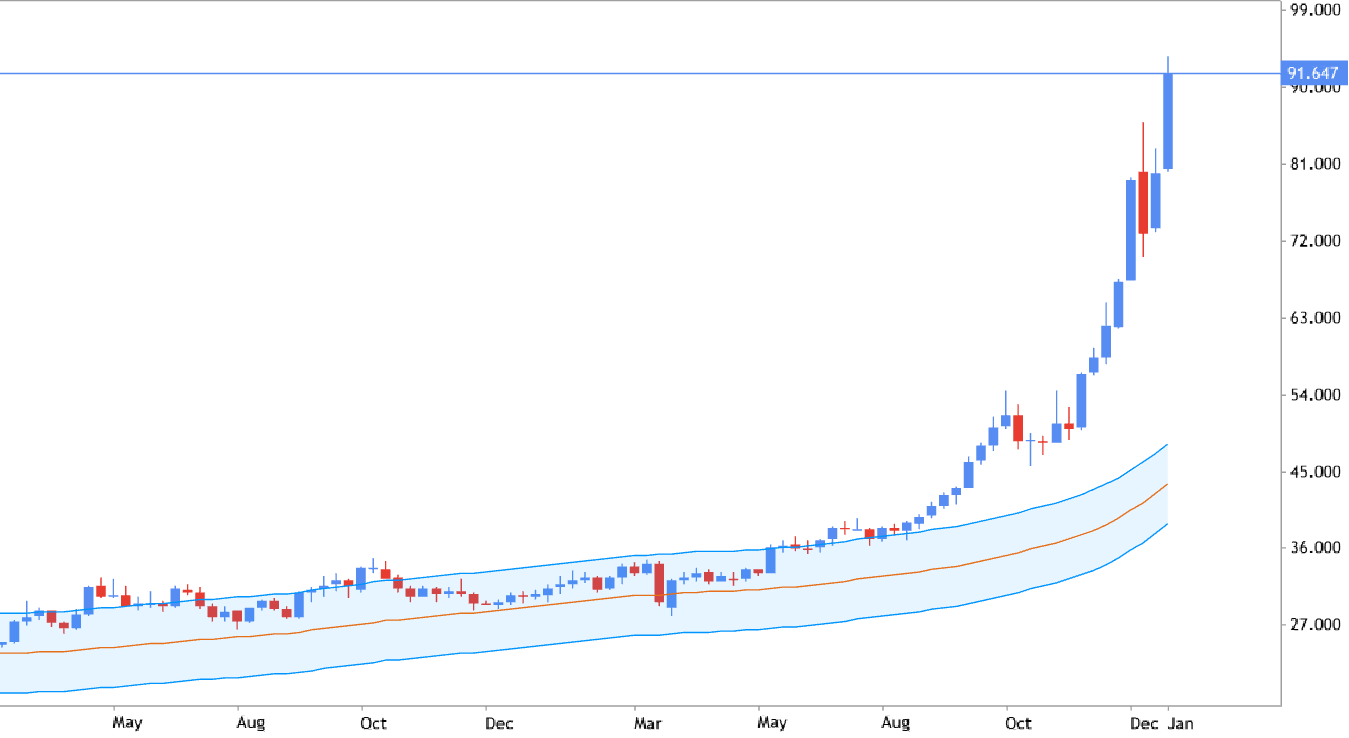
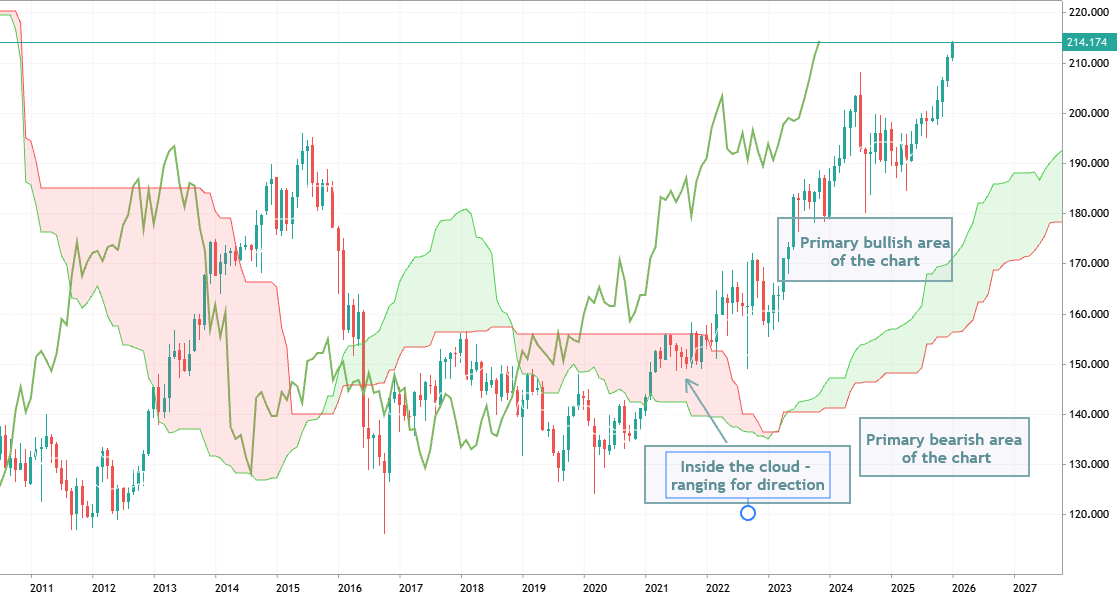
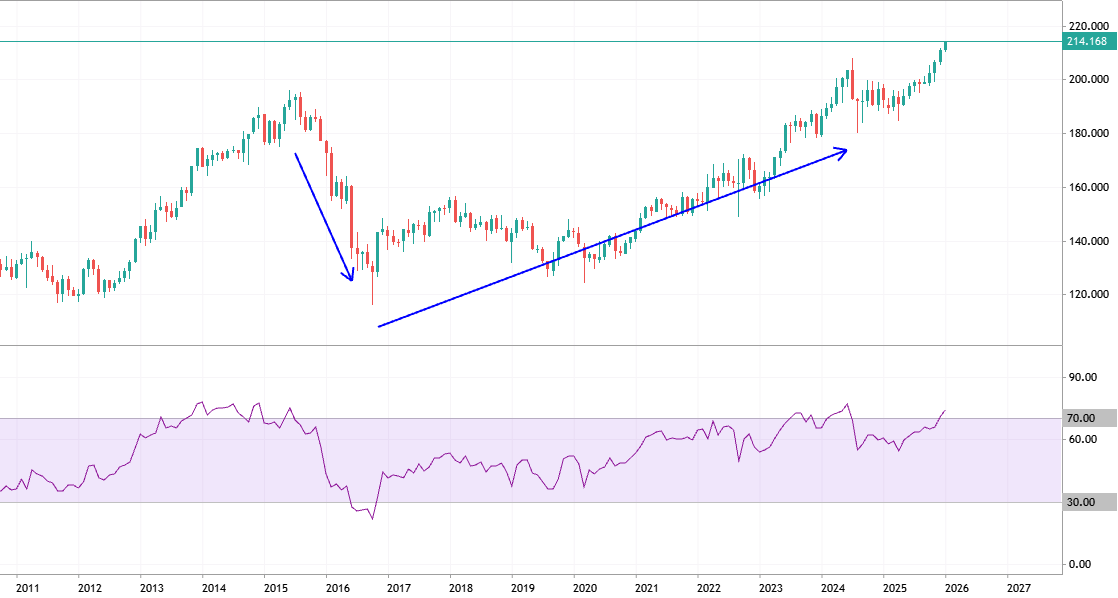
W1 price is located far above Ichimoku cloud in the bullish area of the chart. The price was bounced from support level at 48,38 to above to the 83,98 level as the next possible target. Stochastic indicator is on overbought market condition so the strong bullish trend may be continuing with good fundamental news events only as a breakout for example. - If the price breaks resistance at 83,98 to above on close weekly bar so the strong bullish trend will be continuing. - Alternatively, the price will be on ranging up to the secondary correction with 48,38 as a next possible target for example. Recommendation: ranging; watch the price with watch the price resistance at 83,98 for possible buy position for breakout on strong fundamental news events, otherwise - ranging or correction as the counter trend.
2026.01.08 10:29 2
Trading Ideas for 2026: XAU/USD - Technical Forecast and Levels
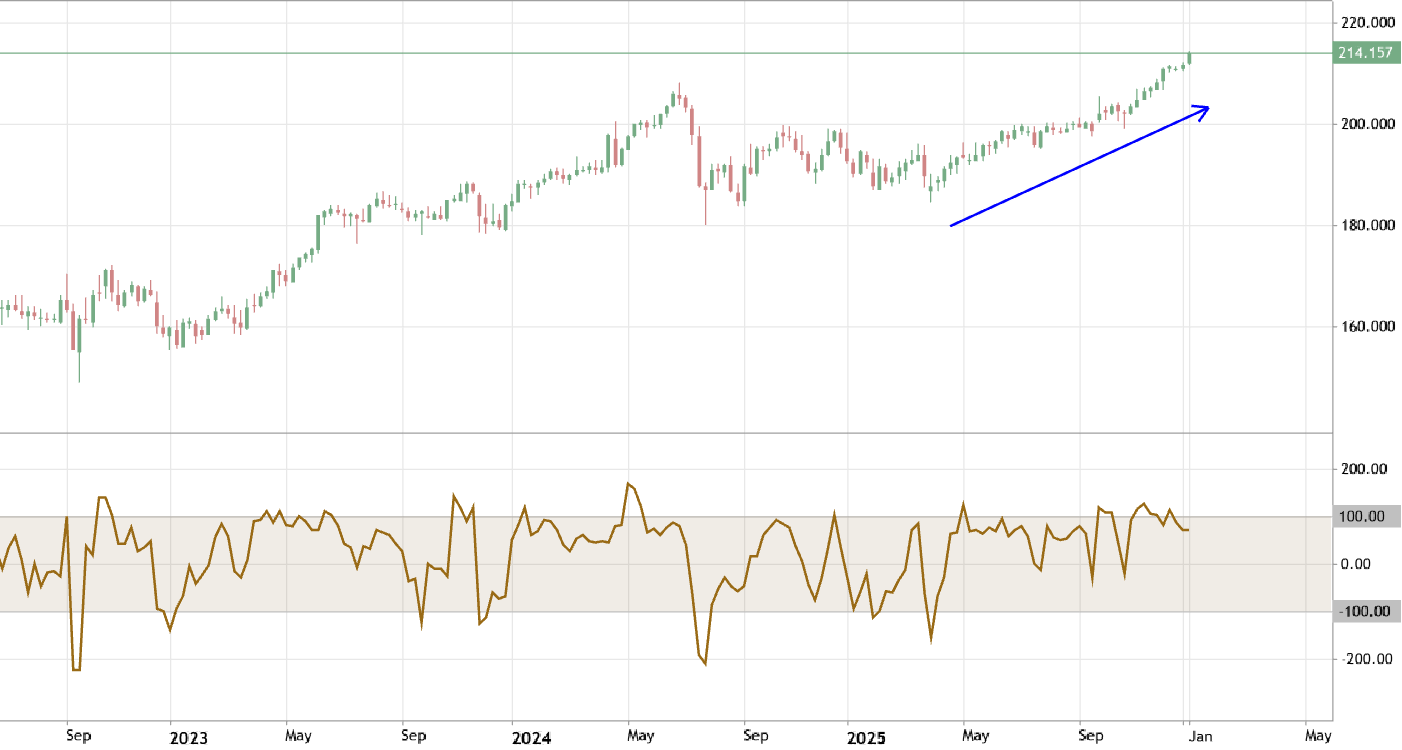
Weekly price is on ranging to be near and below the resistance level at 4550 for the primary bullish trend to be continue or to the secondary ranging-to-correction to be started. - if the price breaks resistance level at 4550 on weekly close bar to above so the strong primary bullish trend will be continuing; - if the price breaks 3997 support to below so the secondary correction within the bullish trend will be started; - if not so the price will be on ranging within 3997/4550 support/resistance channel. Recommendation: ranging with overbought condition; watch the price with s/r levels on close weekly bar for possible buy or sell.
2026.01.07 04:43 4
Trading Ideas for 2026: EUR/USD - Technical Forecast and Levels
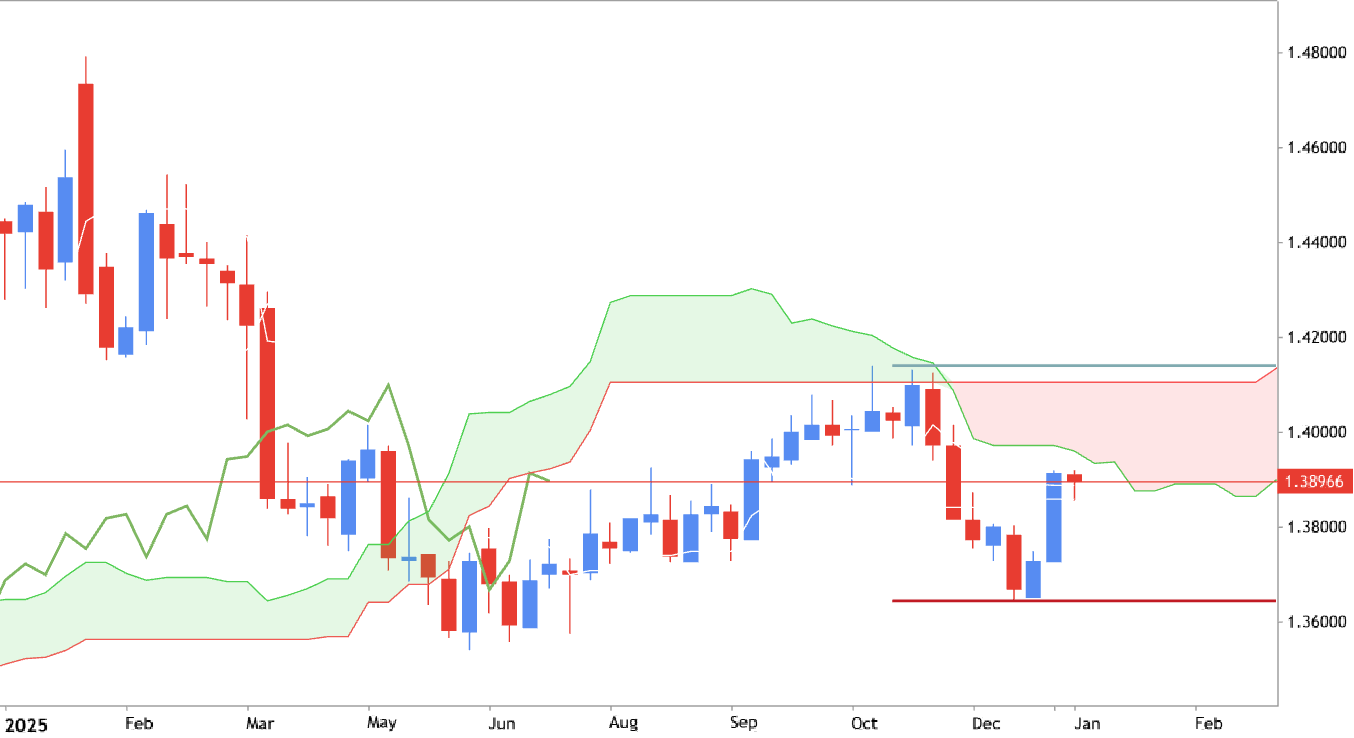
Weekly price is located above Ichimoku cloud in the primary bullish area of the chart. The price was bounced from 1.1808 resistance level to below for the ranging to the secondary correction to be started. - if the price breaks resistance level at 1.1808 on weekly close bar to above so the bullish trend will be continuing; - if the price breaks 1.1490 support to below so we ay see the the primary bearish reversal to be started; - if not so the price will be on ranging within wide support/resistance channel waiting for the direction of the strong trend. Recommendation: watch the close weekly price to break resistance at 1.1808 to above for possible buy position with 1.1918 as re-enter; otherwise - ranging.
2026.01.06 10:10 3
Trading Ideas for 2026: GBP/USD - Technical Forecast and Levels
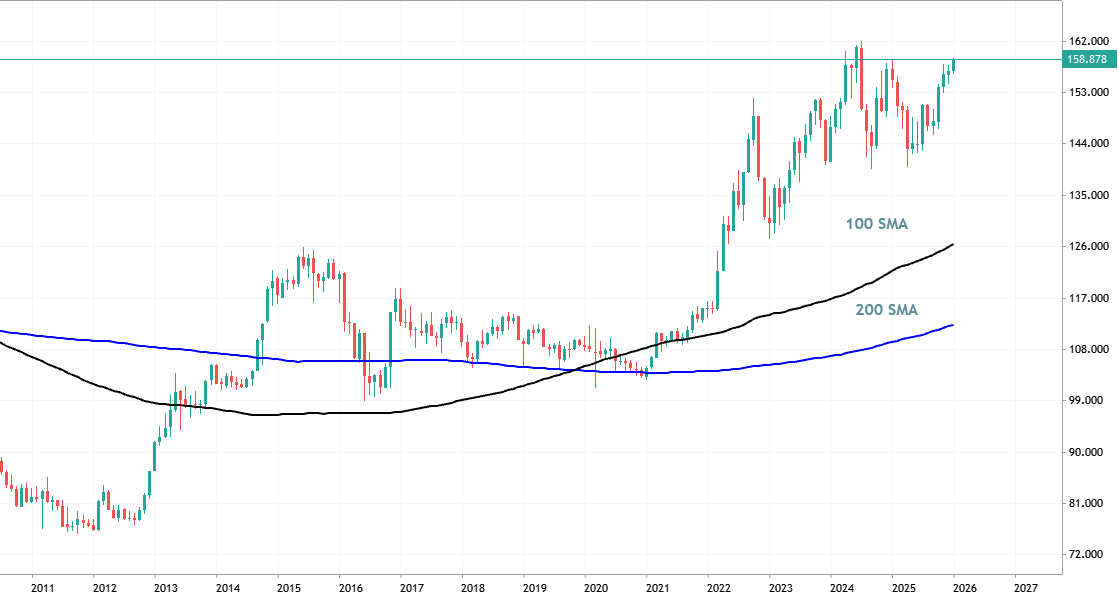
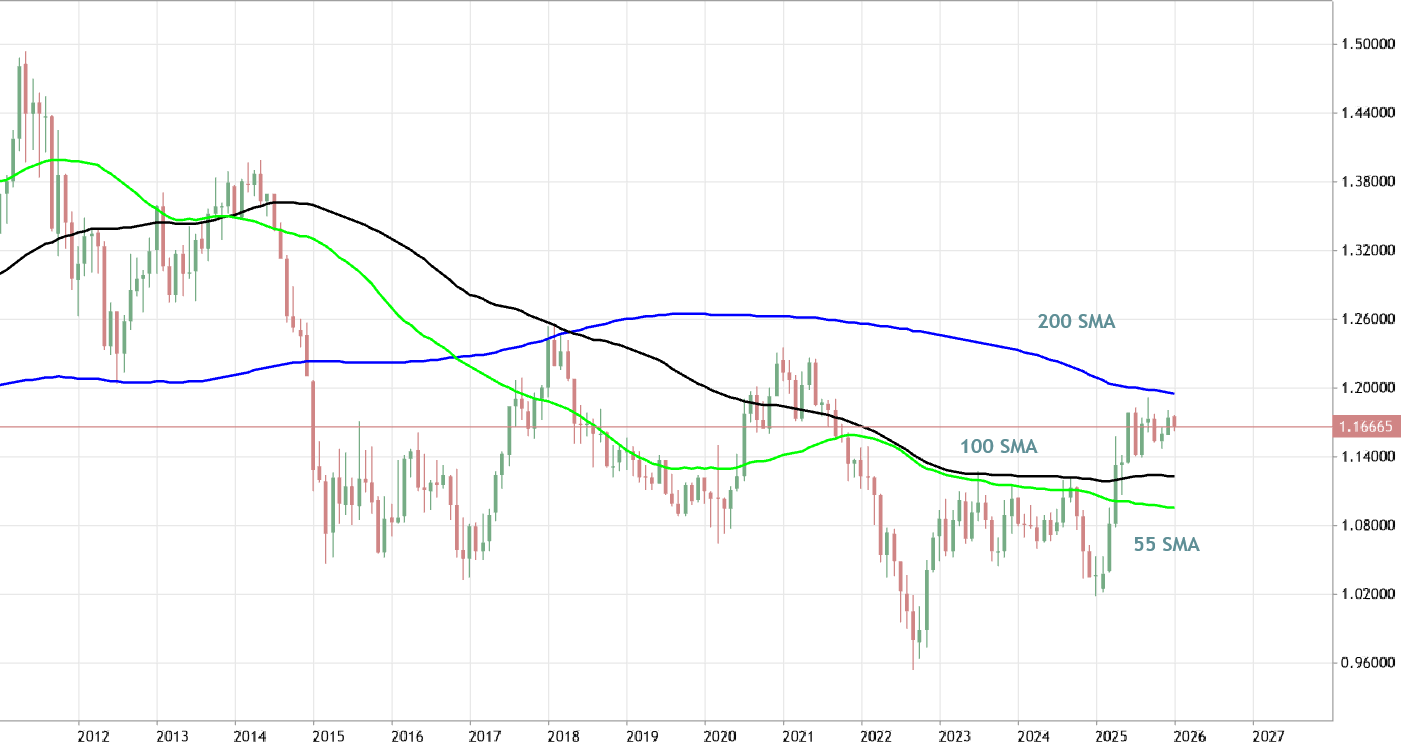
Weekly price is located to be above 200 SMA and 100 SMA as well in the bullish area of the chart. The price was bounced from 55 SMA to above for the primary bullish trend to be started. For now, the price is trying to break the symmetric triangle pattern to above together with resistance at 1.3438 on the weekly close bar. Alternatively, the price will be on secondary ranging within s/r levels waiting for direction of the strong trend to be started. Recommendation: watch the weekly price to break the resistance level on close bar, otherwise - ranging for direction.
XAUUSD: end of the year trading ideas
Daily price is located far above Ichimoku cloud in the bullish area of the chart. Chinkou Span line of Ichimoku indicator crossed the historical data to above for the good strong daily breakout. For now - the price is testing the bullish triangle pattern to above with the resistance level at 4353.6 for the trend to be continuing. Alternatively, if the price breaks support at 4169.7 to below so the secondary correction within the primary bullish trend will be started. Otherwise, the price will be inside s/r channel waiting for direction. Recommendation: watch the price to be crossed the resistance level for possible buy trade.
2025.12.18 15:34 2
ADX - traditional general approach
The Average Direction Index takes a different method when it comes to analyzing trends. It won’t tell you whether price is trending up or down, but it will tell you if price is trending or is ranging. This makes it the perfect filter for either a range or trend strategy by making sure you are trading based on current market conditions.
2025.12.18 13:38 0
MACD - traditional general approach
The Moving Average Convergence/Divergence tracks the difference between two EMA lines, the 12 EMA and 26 EMA. The difference between the two EMAs is then drawn on a sub-chart (called the MACD line) with a 9 EMA drawn directly on top of it (called the Signal line). Traders then look to buy when the MACD line crosses above the signal line and look to sell when the MACD line crosses below the signal line.
2025.12.18 13:13 0
USDJPY: end of the year trading ideas
The daily price is on secondary ranging within the primary bullish market condition: the p[rice is ranging within 154.35/156.95 support/resistance channel for waiting for the direction of the bullish tred to be continuing if the resistance at 156.95 is broken, or to the primary bearish reversal to be started for 154.35 support to be broken to below on daily close bar. Recommendation: watch the daily price 154.35/156.95 s/r channel to be broken for possible buy or sell position in the short or medium term situation for example.
2025.12.18 09:58 2
Trading Ideas for 2026: USD/JPY - Technical Forecast and Levels
Weekly price broke Ichimoku cloud to above for the good weekly breakout. The price was bounced from resistance line at 157.96 to below for the secondary ranging within 150.27/157.96 s/r channel to be started. - if the price breaks resistance level at 157.96 on weekly close bar to above so the strong primary bullish trend will be continuing up to the beginning or in the middle of 2026; - if the price breaks 150.27 support to below so the primary bearish reversal will be started with the secondary ranging market condition; - if not so the price will be on ranging within 150.27/157.96 support/resistance channel. Recommendation: watch the price with s/r levels for possible buy or sell on lower timeframe in 2026 for example.
2025.12.18 09:44 3
USDCHF: end of the year trading ideas
Daily price broke Ichimoku cloud to below for the good daily breakdown. The price is trying to cross the support level at 0.7923 to below for the primary bearish trend to be continuing. If the price is bounced from support level to above to be back to the bullish area so we should want about resistance level at 0.8085 for possible target to be near at 0.8124 resistance. Otherwise - the price will be on ranging within s/r channel waiting for direction. Recommendation: watch the price concerning 0.7923 support level for possible sell trade, otherwise - ranging for direction.
2025.12.17 12:59 2
EURUSD: end of the year trading ideas
The daily price is located near and above Ichimoku cloud in the bullish area of the chart. The price was bounced from 1.1804 resistance level to below for the secondary ranging to the possible correction to be started. If the price breaks the border of Ichimoku to below together with 1.1615 support so the primary daily bearish reversal will be started. If the price breaks the resistance level at 1.1804 to aboive so the primary bullish trend will be continuing. Otherwise - the secondary ranging market condition to be near or inside Ichimoku cloud waiting for the direction of the strong trend to be started. Recommendation: watch the price with 1.1615/1.1804 s/r levels for possible direction.
2025.12.17 12:42 2