XAU/USD (H1): Major Demand Sweep & Trendline Retest Setup XAUUSD Long Gold vs US Dollar

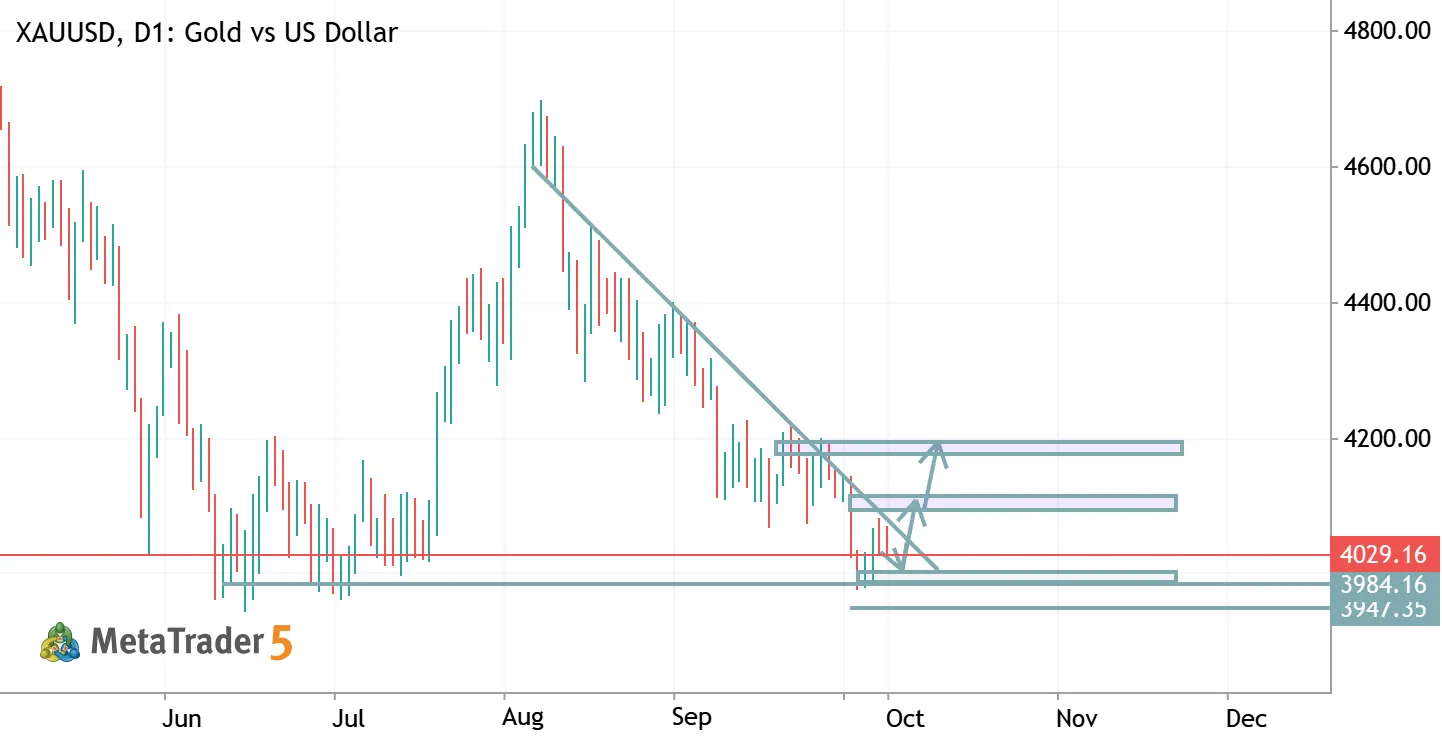
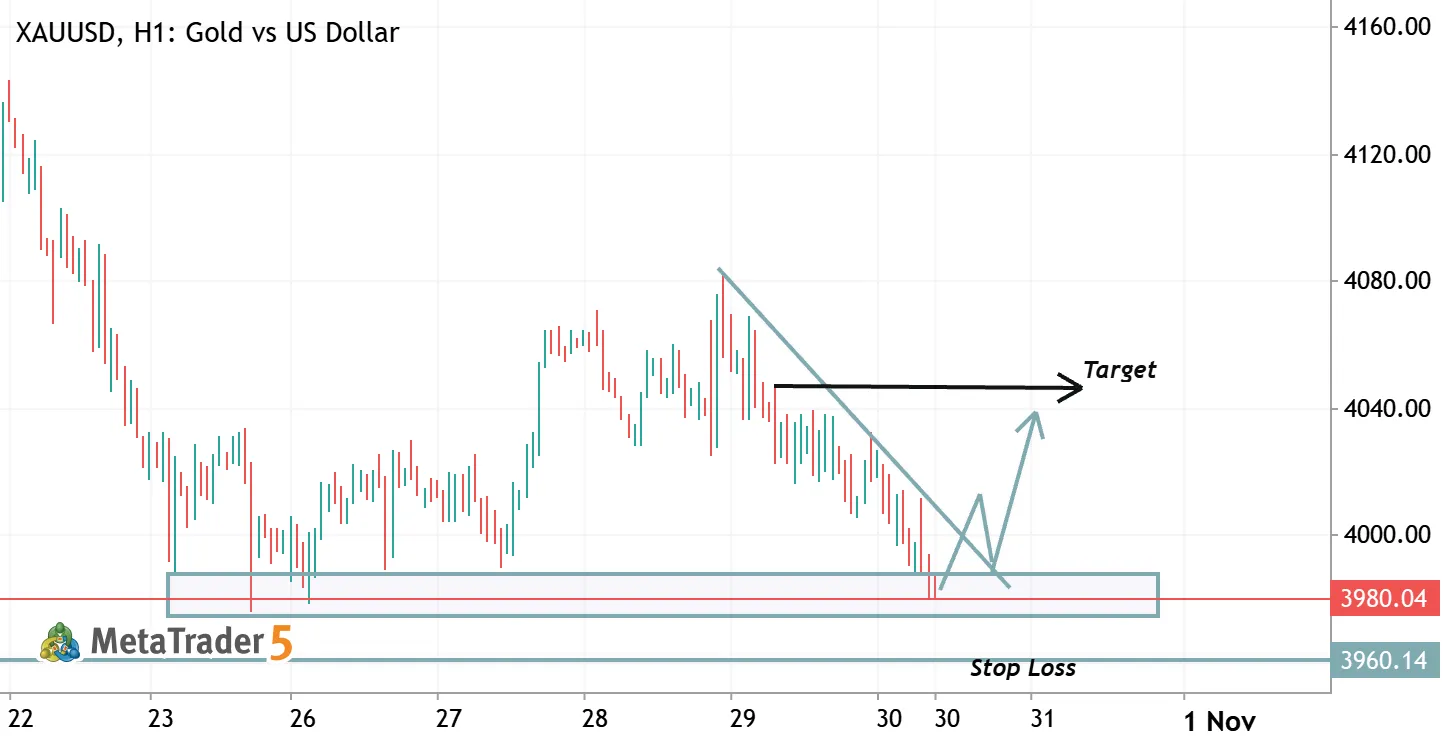
XAU/USD (H1): Major Demand Sweep & Trendline Retest Setup

XAU/USD (H1): Major Demand Sweep & Trendline Retest Setup 📈 Gold (XAU/USD) on the 1-Hour timeframe has completed a steep multi-day sell-off directly into a critical macro demand block, printing early signs of exhaustion and liquidity absorption around the sub-$4,000 zone . Structural Breakdown & Price Action Context Higher-Timeframe Demand Zone ($3,970 – $3,990): This broad horizontal base acted as primary support during the October 23–26 consolidation before the impulsive drive toward $4,080+ . The current tap into $3,980.27 serves as a direct test of historical demand and sell-side liquidity (SSL) . Descending Resistance Trendline: Since printing swing highs above $4,080 on October 29, price has respected a sharp descending trendline, driving steady lower highs . Liquidity Sweep

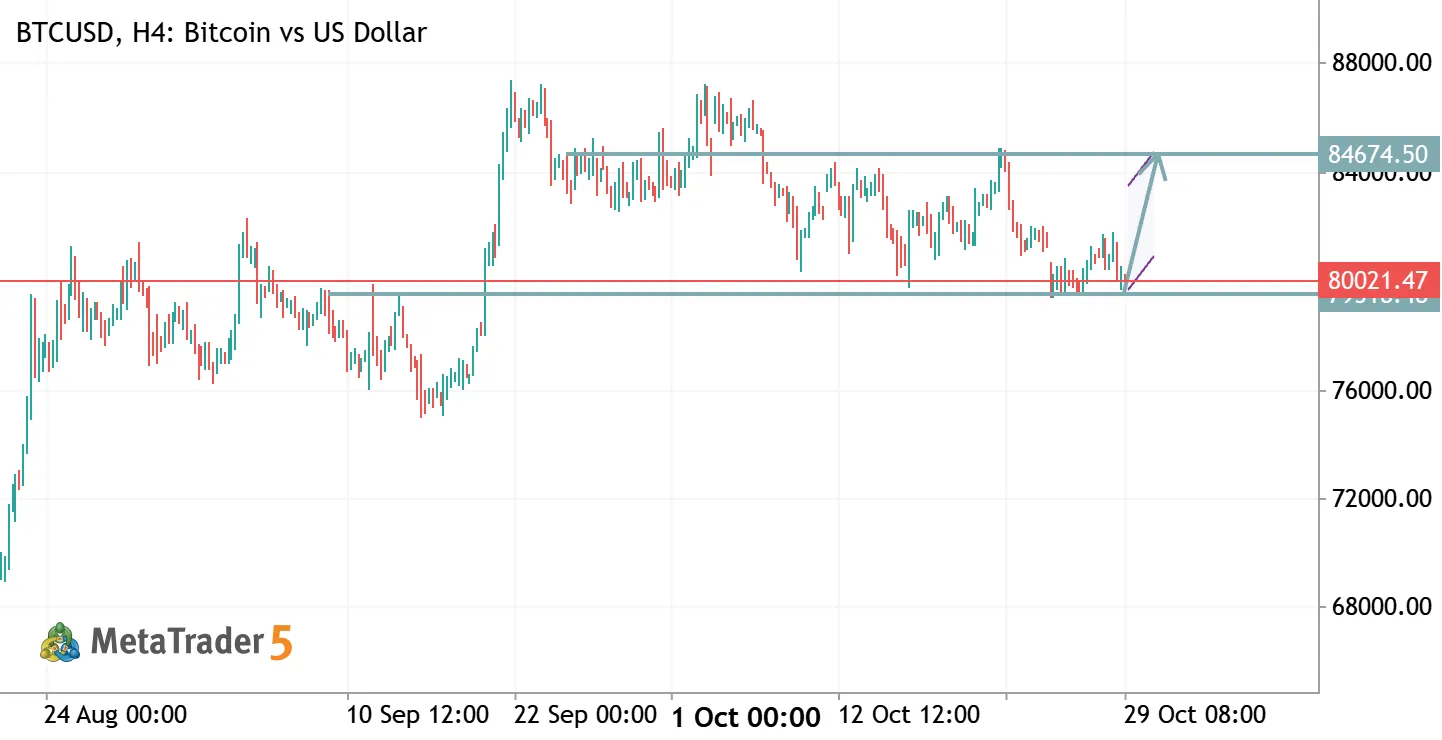
BTC/USD (H1): Bearish FVG Retest — Is a Clean Sweep to $76,000 Next? 📉 BTCUSD Short Bitcoin vs US Dollar

BTC/USD (H1): Bearish FVG Retest — Is a Clean Sweep to $76,000 Next? 📉

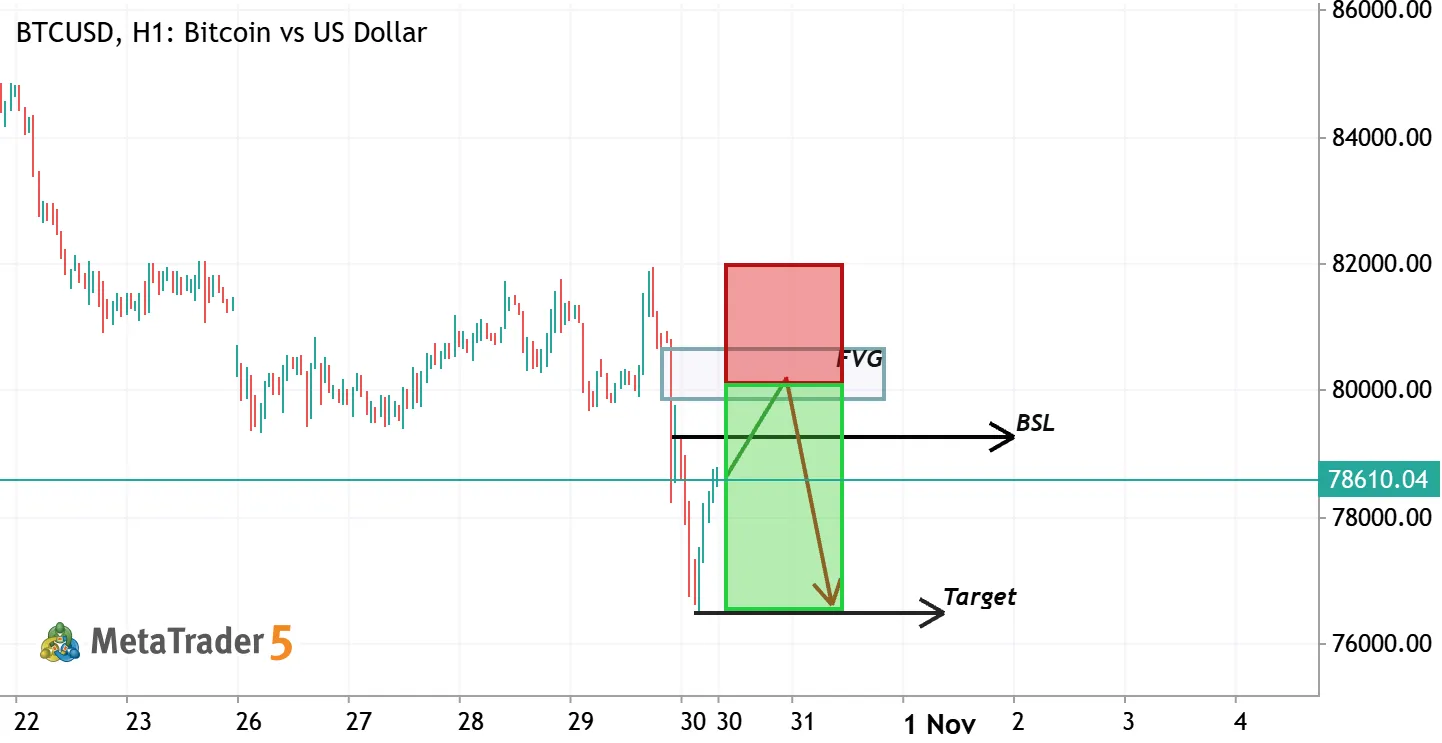
BTC/USD (H1): Bearish FVG Retest — Is a Clean Sweep to $76,000 Next? 📉 Bitcoin (BTC/USD) on the 1-Hour timeframe experienced an aggressive liquidity displacement downward, printing an unmitigated Bearish Fair Value Gap (FVG) and setting up a classic Smart Money Concepts (SMC) sell setup on the retest . Structural Breakdown & Price Action Context Aggressive Displacement & Market Structure Shift (MSS): After failing to break higher above $82,000 , price printed consecutive high-volume bearish candles, decisively slicing through prior local support levels . Bearish Fair Value Gap (FVG): The rapid sell-off left an imbalance pocket between approximately $79,800 and $80,800 . Price is currently forming a corrective retracement (green trajectory line) to balance this institutional
USTECH100 (H1): Deep Retracement into Bullish OB + FVG — Setup Breakdown 🚀 100 USTECH100M Long USTECH100mini

USTECH100 (H1): Deep Retracement into Bullish OB + FVG — Setup Breakdown 🚀

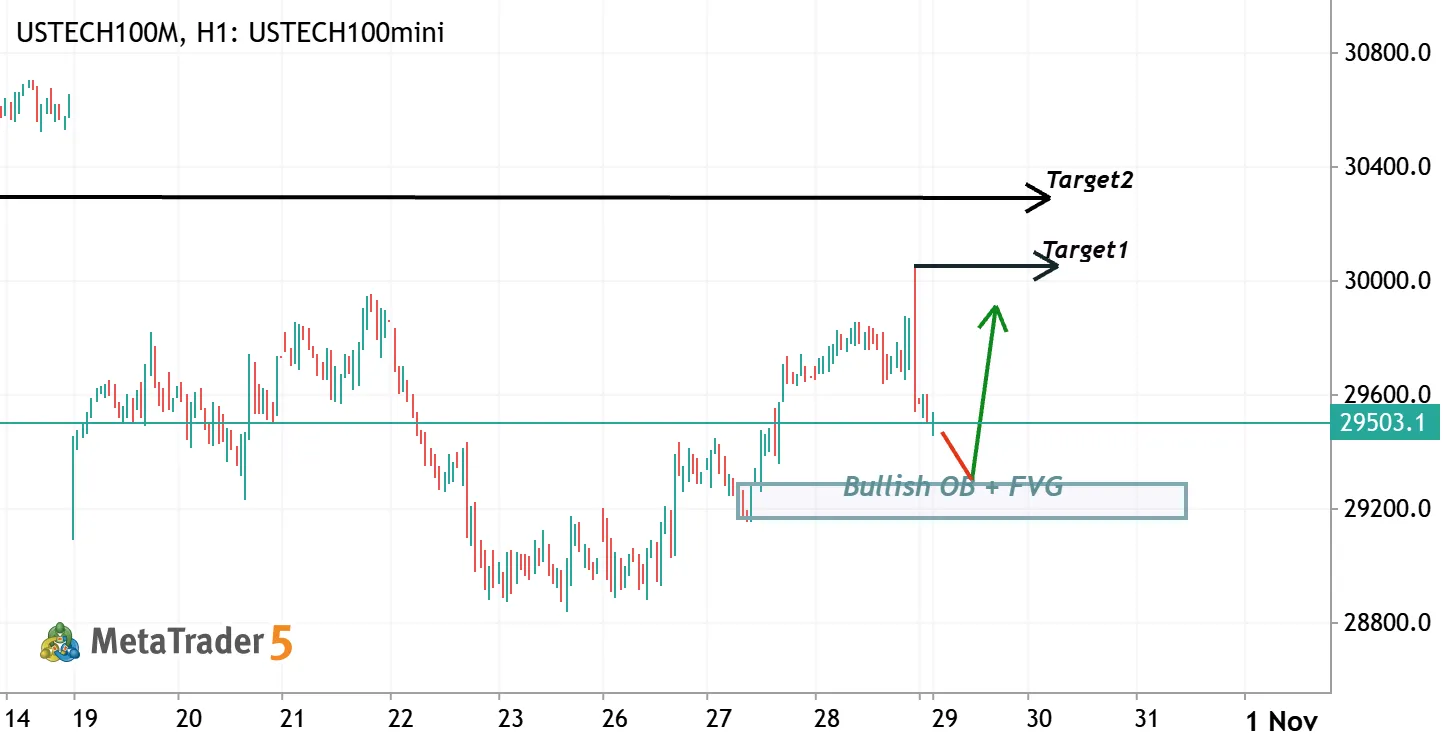
USTECH100 (H1): Deep Retracement into Bullish OB + FVG — Setup Breakdown 🚀 The Nasdaq 100 mini (USTECH100M) on the 1-Hour chart has rejected from the 30,000 psychological milestone following a sharp buy-side liquidity (BSL) sweep, and is currently retracing toward an institutional discount zone . Structural Breakdown & Price Action Context Buy-Side Liquidity Sweep (Target 1 / 30,070 Peak): After a steady multi-day bullish expansion from the 28,800 lows, price surged aggressively to tap 30,070 , sweeping previous swing liquidity before leaving an extended upper rejection wick . Current Retracement (29,506 Pivot): Price is breaking below short-term consolidation as sellers step in to absorb liquidity . The red trajectory arrow indicates expectations of a deeper descent to rebalance
US500 (H4): Trendline Break & Retest — Are Bulls Eyeing the 7,840 Highs? 500 US500 Long US SPX 500 Index

US500 (H4): Trendline Break & Retest — Are Bulls Eyeing the 7,840 Highs?

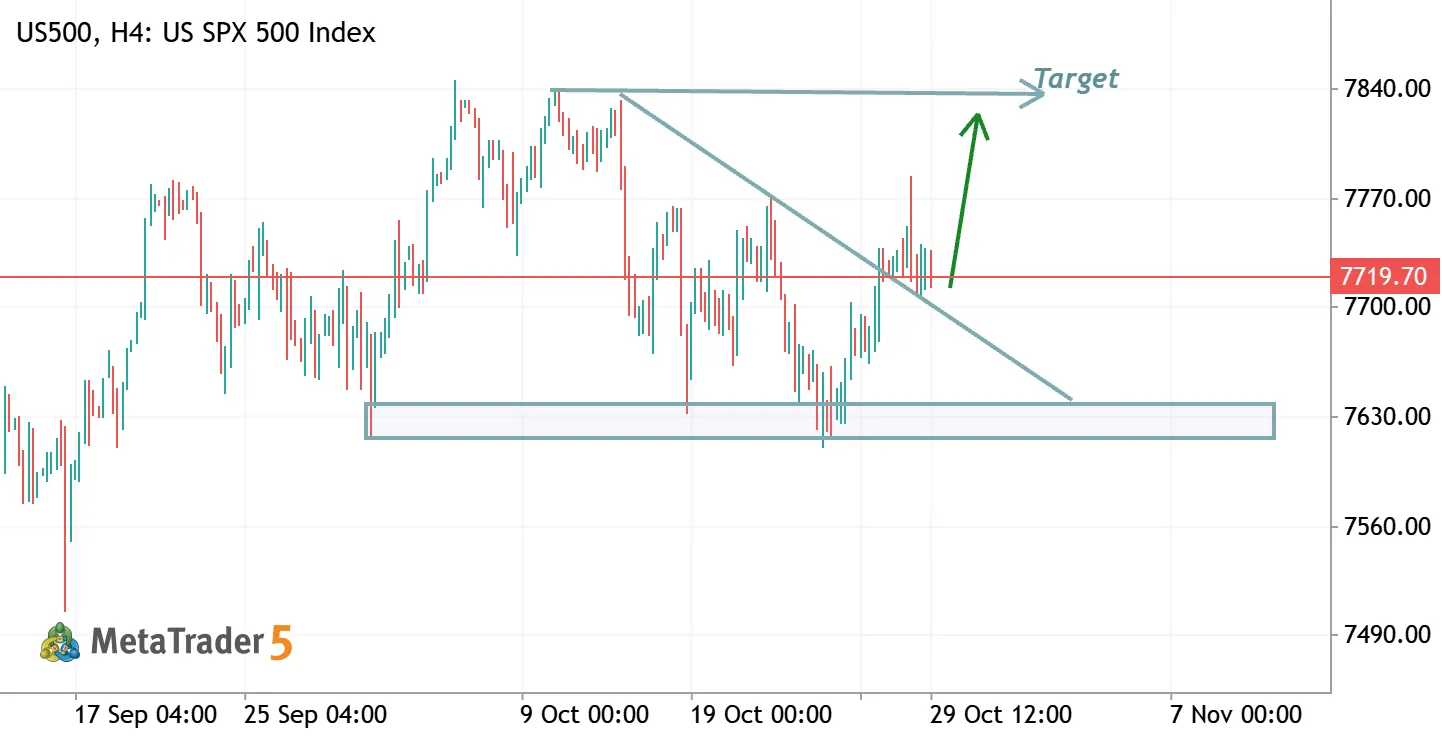
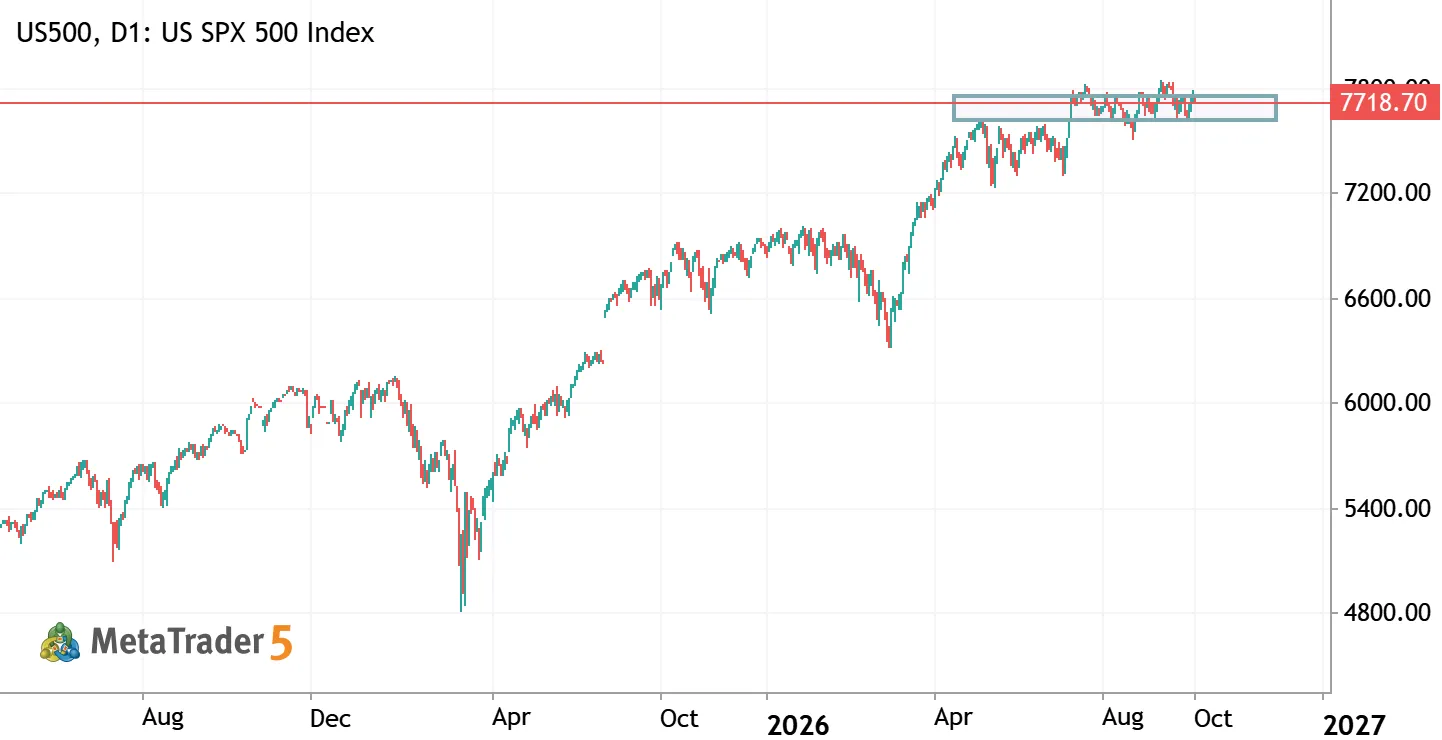
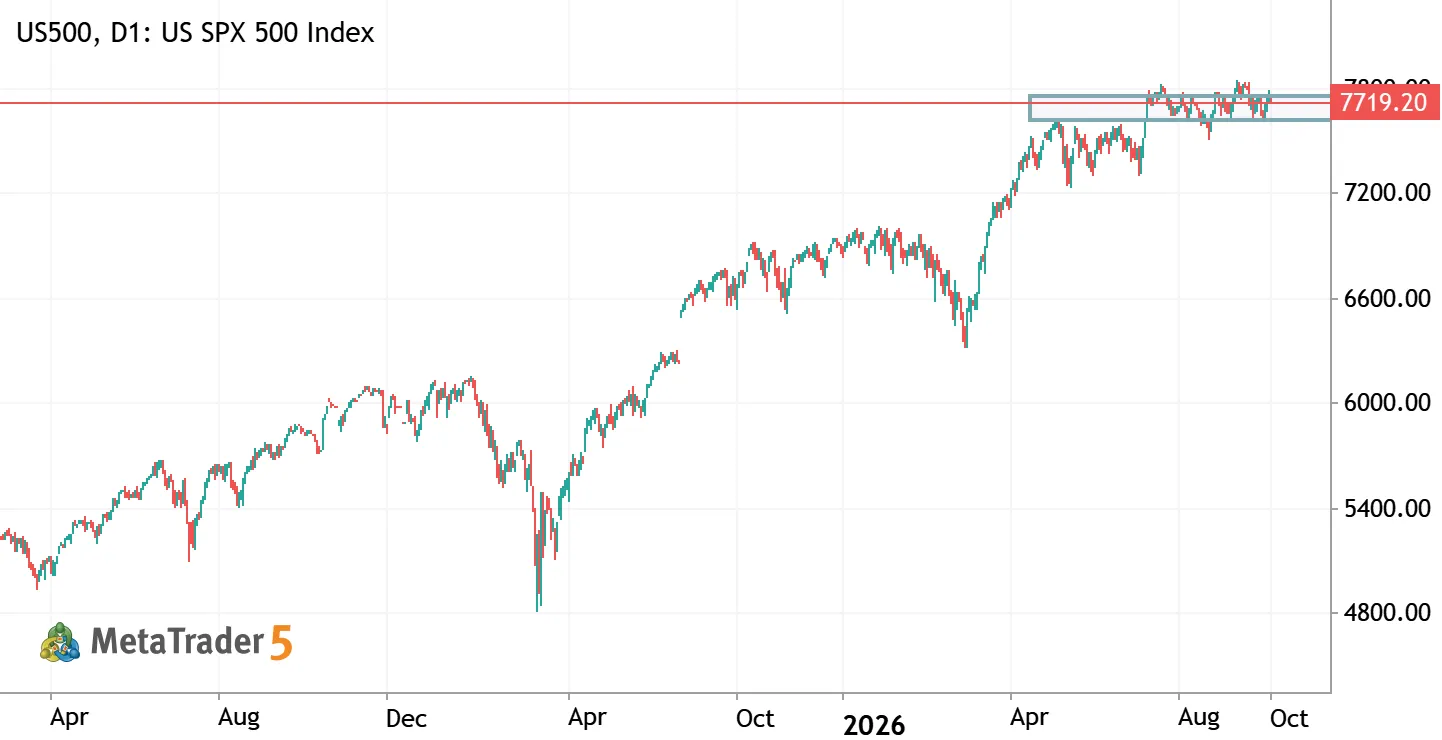
US500 (H4): Trendline Break & Retest — Are Bulls Eyeing the 7,840 Highs? 📈 The S&P 500 Index (US500) on the 4-Hour timeframe has broken above a key descending trendline originating from its swing peaks, setting up a potential bullish continuation after firmly defending its macro base . Structural Breakdown & Price Action Context Demand Floor Defense (7,620.00 – 7,645.00): Over late October, the market tested the key horizontal base multiple times, sweeping liquidity near 7,615.00 before printing aggressive bullish rejections . This established a solid double/triple-bottom structure . Trendline Breakout: A decisive bullish expansion broke out of the descending trendline that had capped rallies since the peak near 7,840.00 . Consolidation / Retest Zone (7,700.00 – 7,725.00)
Fed Pauses: What’s Next for US500, the Dollar and Gold? 500 US500 US SPX 500 Index

Fed Pauses: What’s Next for US500, the Dollar and Gold?

Fed Pauses: What’s Next for US500, the Dollar and Gold? On October 28, the Federal Reserve kept the federal funds rate unchanged at 3.75–4.00% . The decision was widely expected, but disagreements inside the FOMC remain. Ten members voted to keep rates unchanged, while two supported another 0.25 percentage point increase. The key message for markets is clear: the Fed has not ruled out further tightening, but it is not planning to raise rates automatically at every meeting. Fed Chair Kevin Warsh highlighted several important points: The U.S. economy continues to grow at a solid pace. The labor market remains relatively stable. Inflation is still above the desired level. The previous rate increase is already beginning to affect credit conditions. The December decision will depend on incoming
ФРС взяла паузу: что дальше для US500, доллара и золота? 500 US500 US SPX 500 Index

ФРС взяла паузу: что дальше для US500, доллара и золота?

ФРС взяла паузу: что дальше для US500, доллара и золота? 28 октября Федеральная резервная система США сохранила процентную ставку в диапазоне 3.75–4.00% . Решение было ожидаемым, однако внутри FOMC сохраняются разногласия: 10 участников поддержали сохранение ставки, двое выступили за повышение ещё на 0.25 п.п. Главный сигнал для рынка: ФРС не отказалась от дальнейшего ужесточения политики, но и не намерена повышать ставку автоматически на каждом заседании. Председатель ФРС Кевин Уорш отметил несколько важных моментов: экономика США продолжает расти устойчивыми темпами; рынок труда остаётся относительно стабильным; инфляция всё ещё превышает желаемый уровень; предыдущее повышение ставки уже начинает влиять на кредитные условия; решение по декабрьскому заседанию будет зависеть от новых
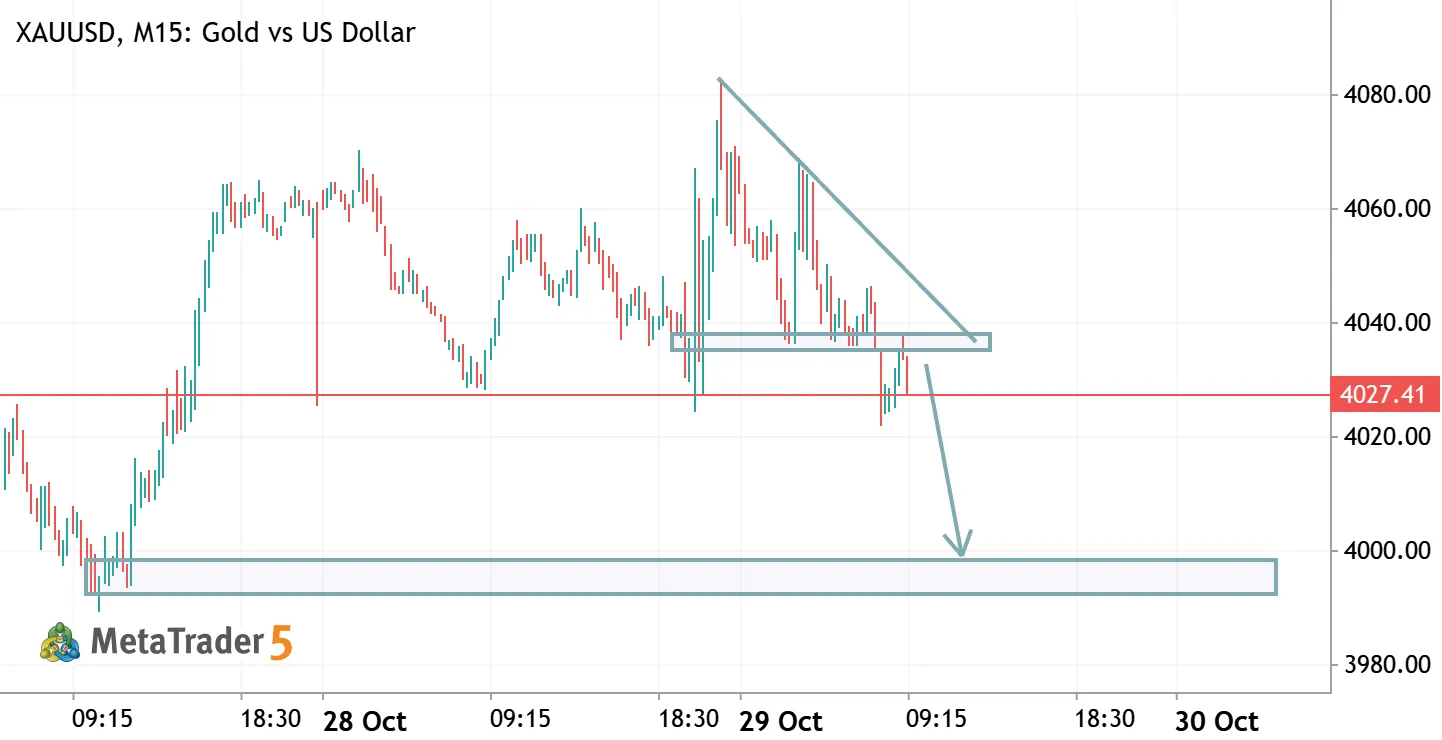
XAU/USD: Clean Breakdown & Retest — Are Bears Targeting the 4,000 Key Level? XAUUSD Short Gold vs US Dollar

XAU/USD: Clean Breakdown & Retest — Are Bears Targeting the 4,000 Key Level?

XAU/USD: Clean Breakdown & Retest — Are Bears Targeting the 4,000 Key Level? 📉 Gold (XAU/USD) on the 15-minute timeframe has broken below a multi-session demand shelf, confirming a shift in intraday momentum toward the downside . Structural Breakdown & Market Context Descending Trendline & Lower Highs: Following the peak near 4,082 , price action formed consecutive lower highs along a descending trendline, indicating persistent distribution and institutional selling on pullbacks . Support Flip to Resistance (4,036 – 4,040 Zone): The horizontal shelf around 4,036 – 4,040 served as reliable demand over several sessions . The impulsive break below this level marked a clear Market Structure Shift (MSS) . Pullback Retest: Price completed a pullback directly into the underside of