BTCUSD TRADE IDEA BTCUSD Long Bitcoin vs US Dollar

BTCUSD TRADE IDEA

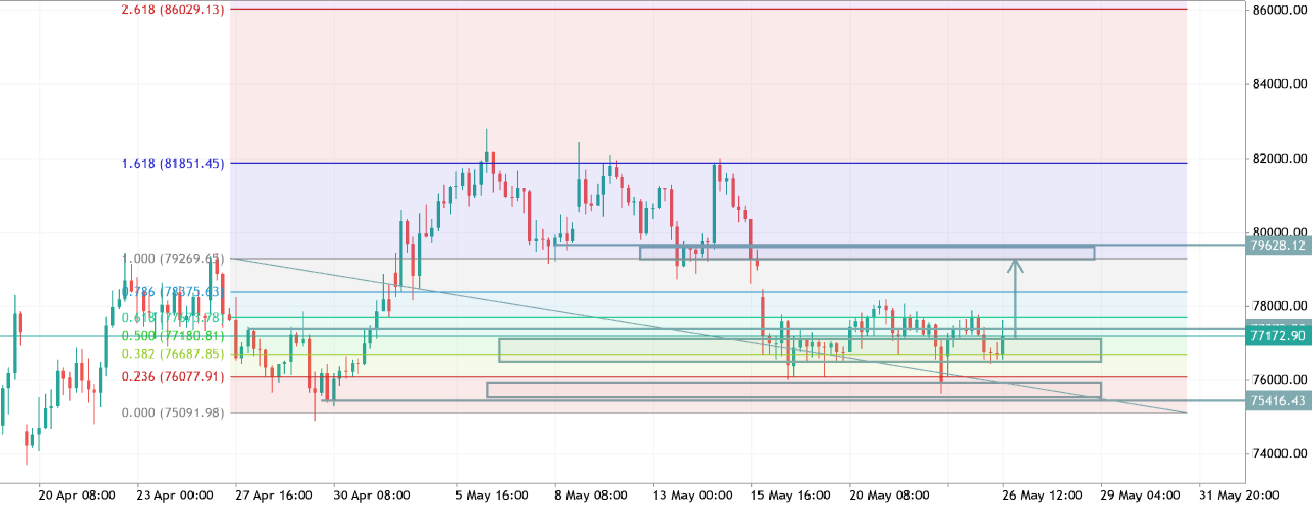
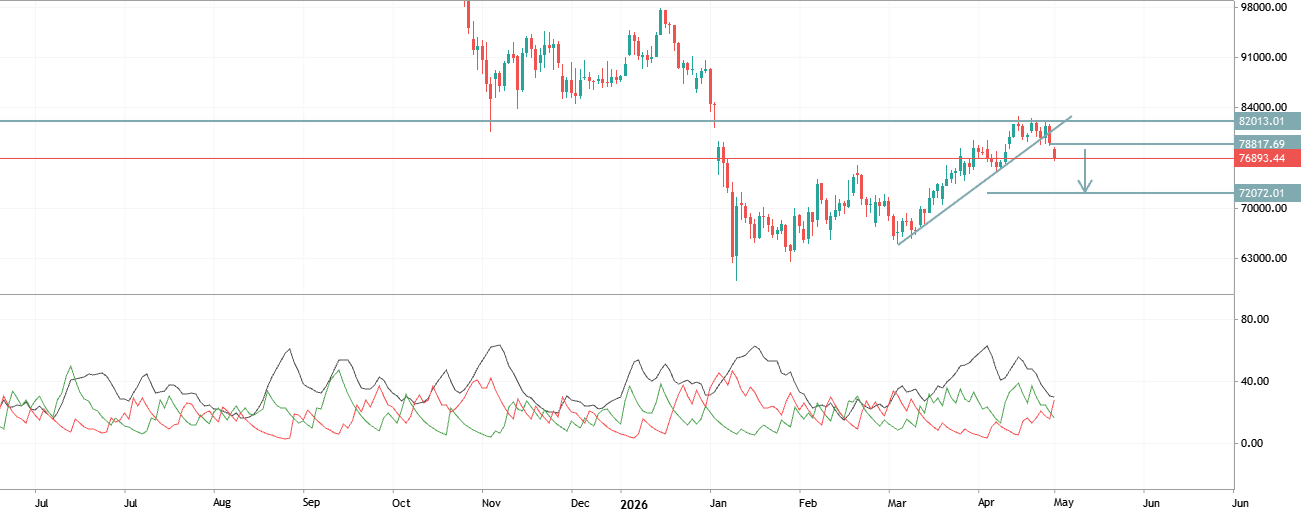
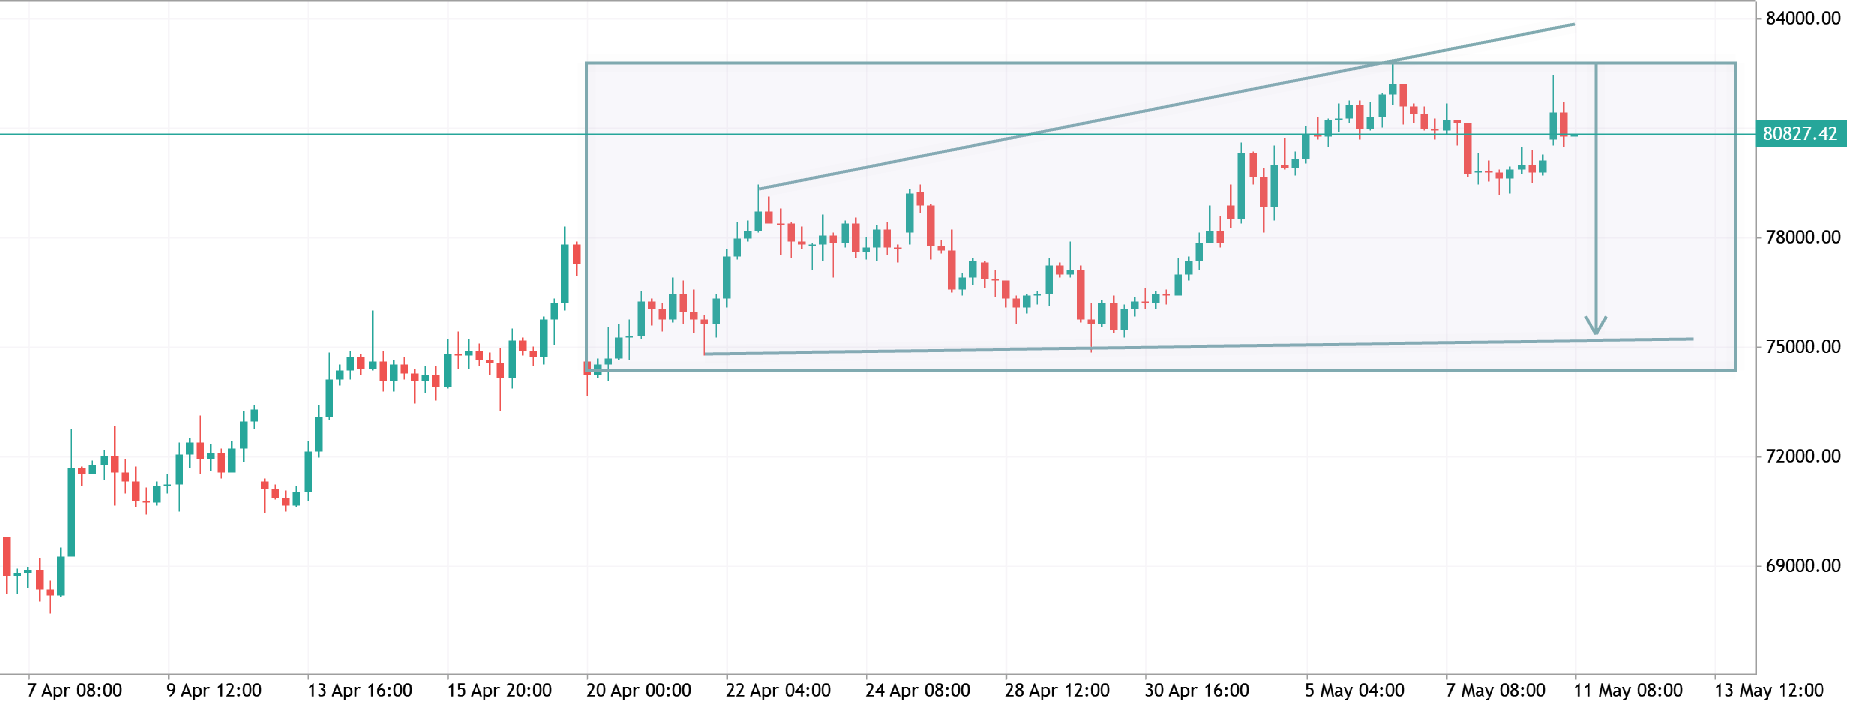
BTCUSD is trading inside a major H4 consolidation zone between 76,000 support and 79,600 resistance . Price recently rejected the upper supply area around 79.2K–79.6K , showing strong seller pressure and a bearish reaction from Fibonacci resistance. Current structure remains range-bound to slightly bearish while price stays below the 79,600 resistance zone . The descending trendline is still active, keeping momentum weak in the short term. Key Levels Resistance: 77,800 → 79,600 → 81,850 Support: 76,700 → 75,400 → 75,000 Bullish Scenario If BTCUSD holds above 76.7K support and breaks above 77.8K , buyers could push price toward: 79.6K 81.8K Extended target near 86K Bearish Scenario Failure to hold the current support area may trigger another selloff toward: 75.4K 75K major demand Possible
BTCUSD TRADE IDEA BTCUSD Long Bitcoin vs US Dollar

BTCUSD TRADE IDEA

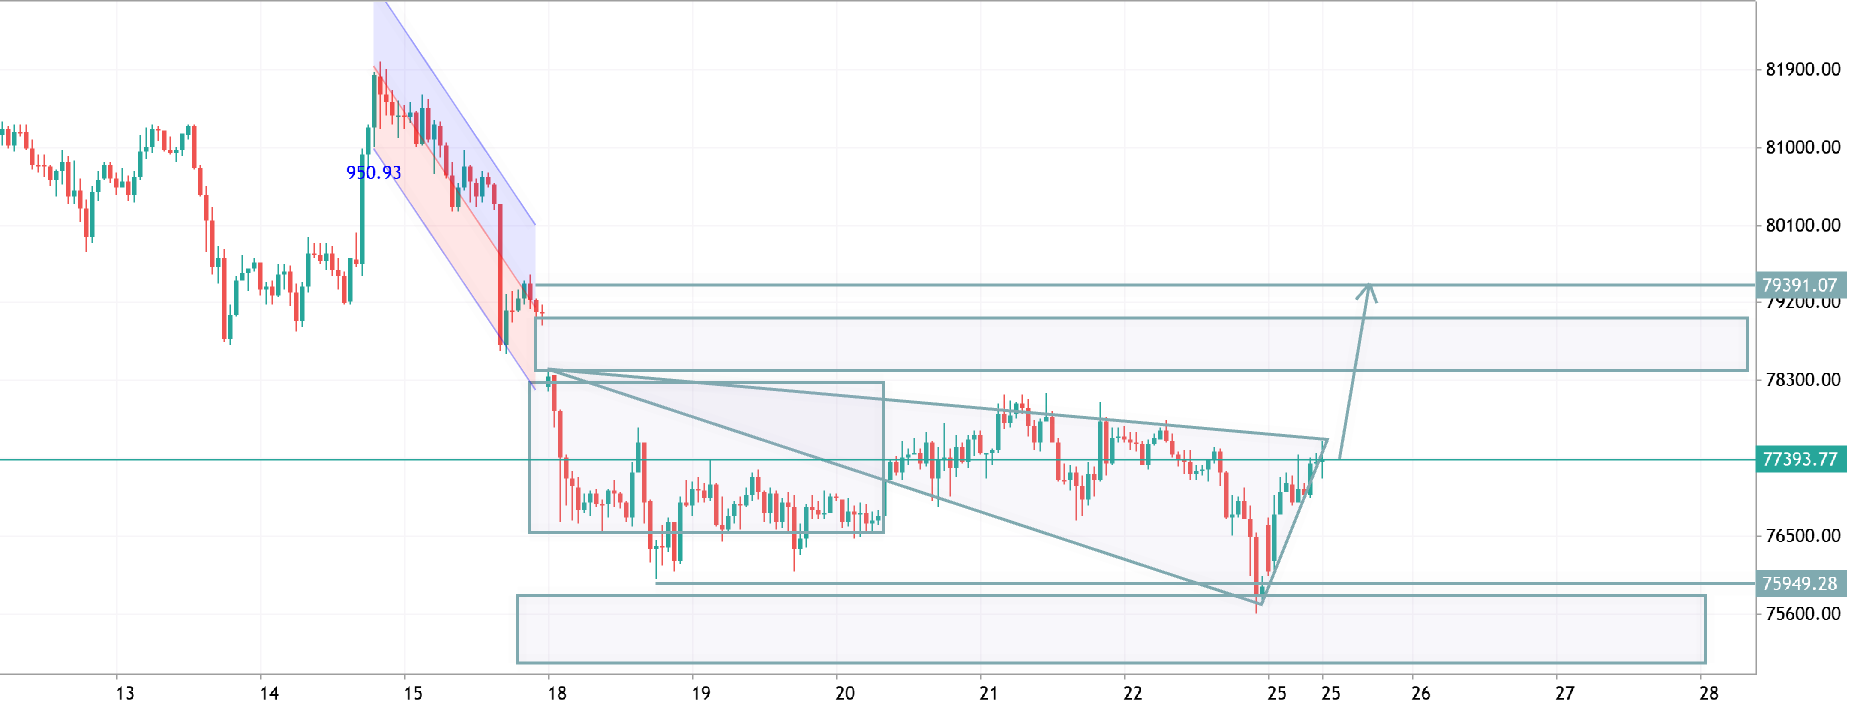
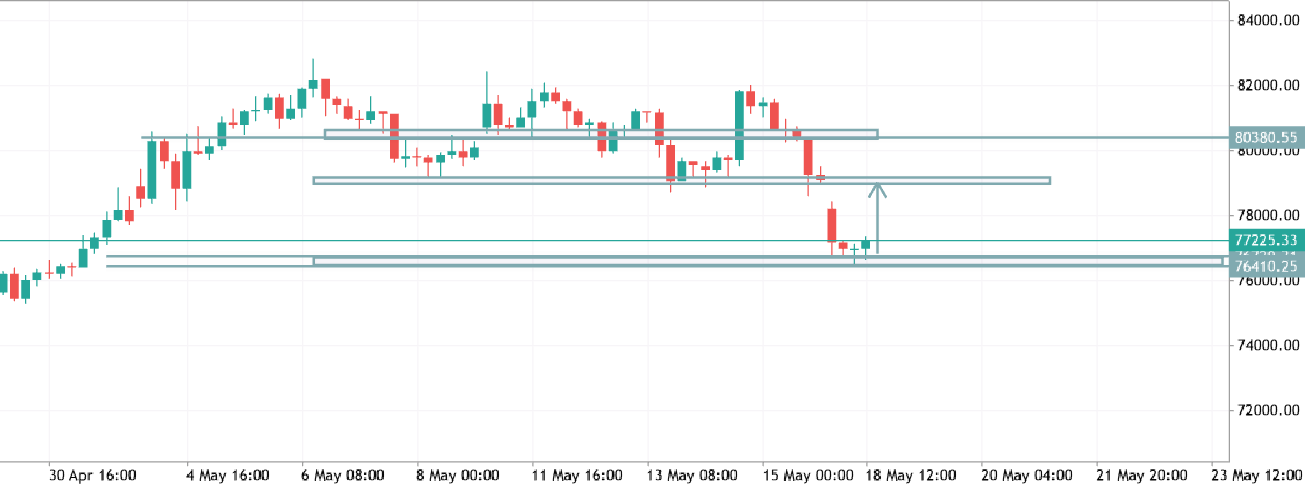
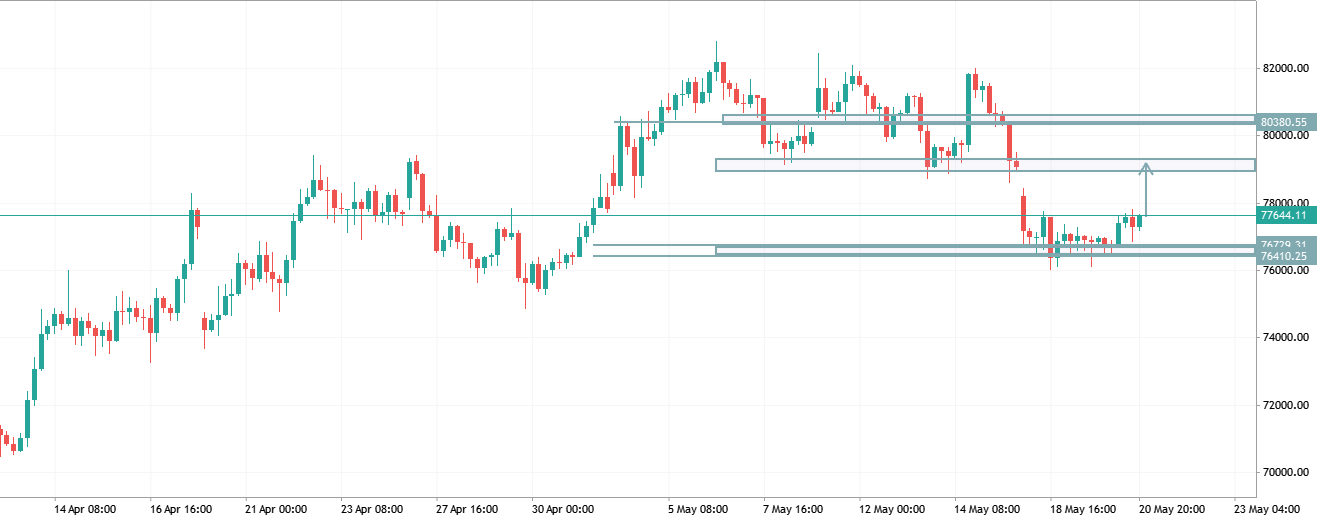
BTCUSD is currently consolidating above the 76,400–76,700 support zone after a strong bearish impulse from the 80K resistance area. Price reacted sharply from the upper supply zone near 80,300, confirming sellers are still active at higher levels. The recent structure shows accumulation around support, with buyers defending the lower range multiple times. If BTC maintains above 76,400 and breaks the short-term resistance around 77,600, momentum could continue toward the next supply zone at 79,000–79,500. Key levels: Support: 76,400 – 76,700 Intraday resistance: 77,600 Major resistance: 79,000 – 80,300 Bias: Short-term bullish recovery while price holds above support. A breakdown below 76,400 may trigger another bearish continuation toward 75,000. Trade idea: Bullish above 77,600 targeting
BTCUSDTRADE IDEA BTCUSD Long Bitcoin vs US Dollar

BTCUSDTRADE IDEA

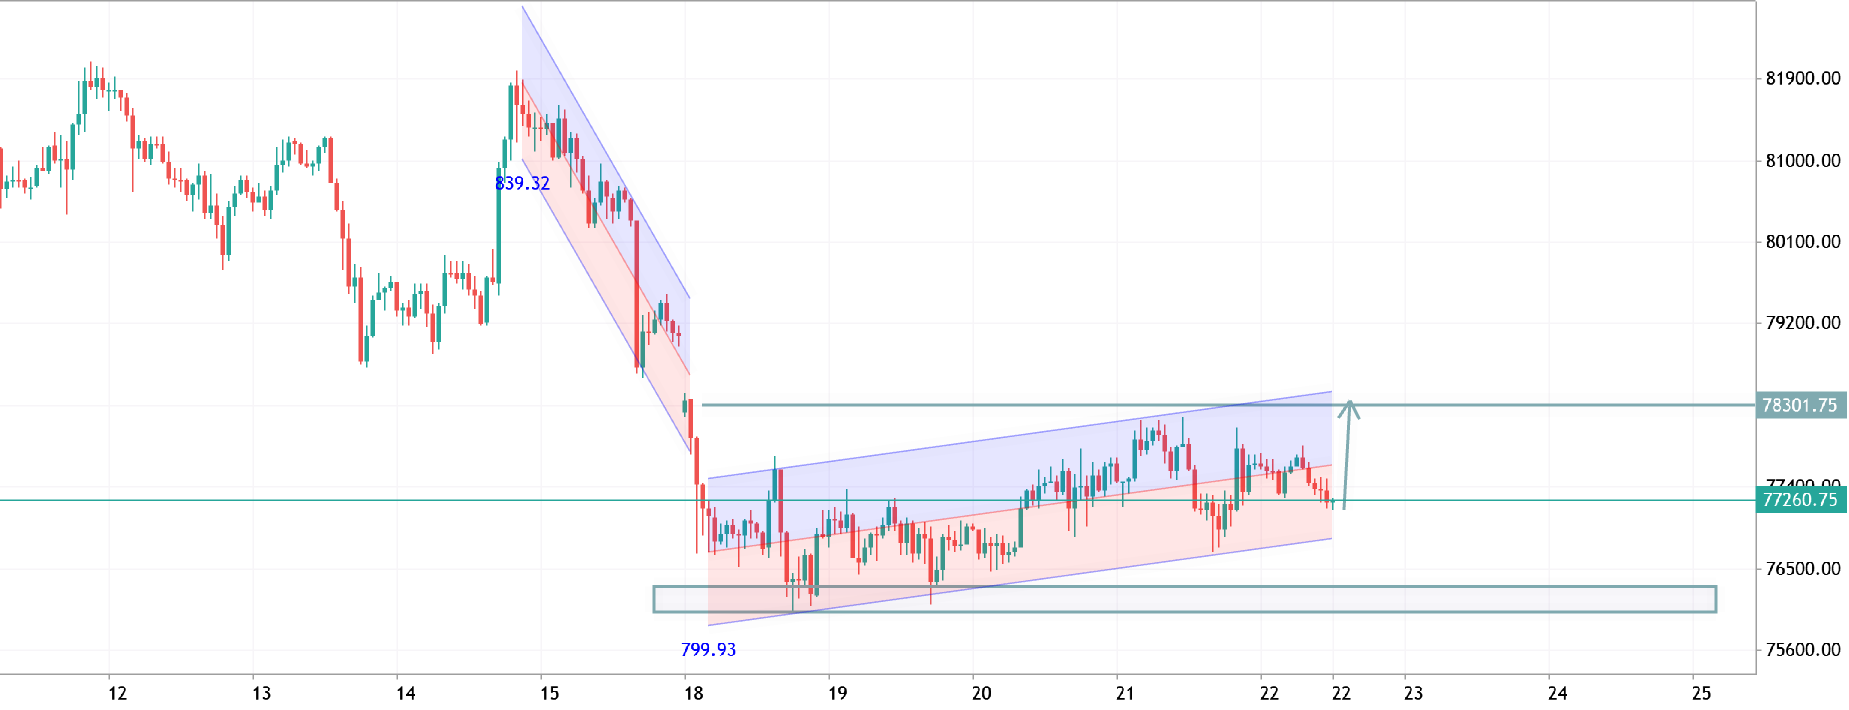
BTCUSD is currently reacting from a strong demand zone around 76,400 – 77,200 , where buyers stepped in after a sharp bearish impulse. Price shows early signs of stabilization with small bullish recovery candles forming near support. The market structure remains short-term bearish below the 79,200 – 79,500 resistance zone. However, the current bounce suggests a possible retracement toward that liquidity area before the next major move. Key Levels Support: 76,400 – 77,200 Immediate Resistance: 79,200 – 79,500 Major Resistance: 80,300 – 80,400 Bullish Scenario If BTC closes above 79,500 , momentum could continue toward 80,300+ and potentially retest recent highs. Bearish Scenario Failure to break the resistance zone may trigger another rejection, sending price back toward 76K support or
BTCUSD TRADE IDEA BTCUSD Bitcoin vs US Dollar

BTCUSD TRADE IDEA

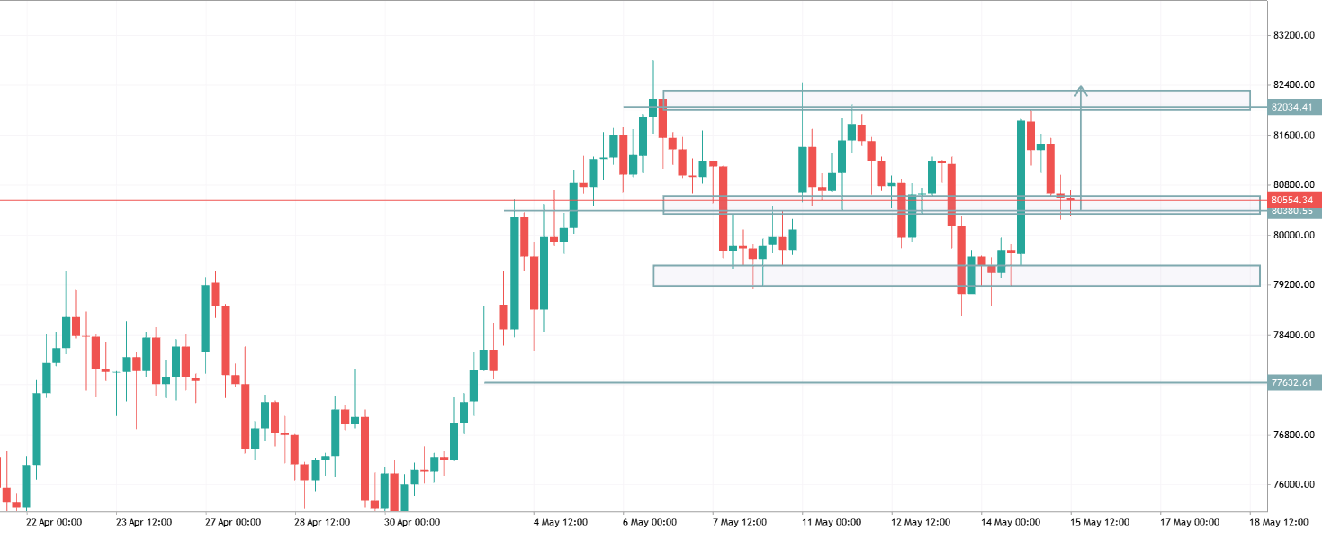
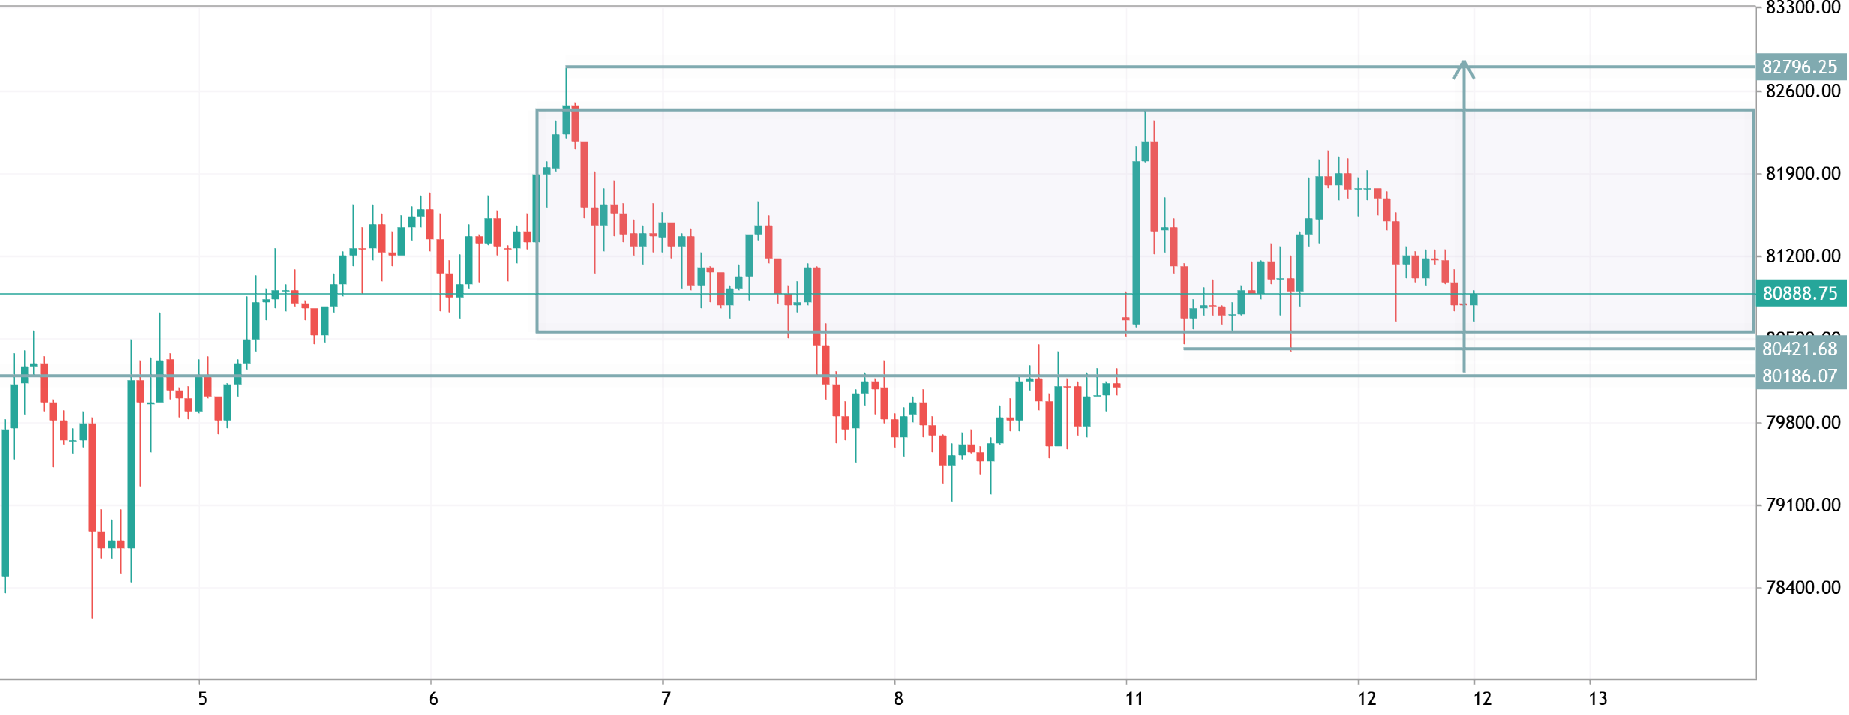
BTCUSD remains in a bullish market structure after a strong impulsive rally from the 76,000 region toward the 82,000 resistance zone. Price is currently consolidating around the 80,500 support area, showing signs of indecision after rejection from higher resistance. Key resistance is located between 82,000–82,400. A confirmed breakout above this zone could trigger continuation toward new highs. However, repeated rejection from this area indicates strong seller pressure. Immediate support is holding around 80,300–80,500. As long as price remains above this level, buyers still maintain short-term control. A breakdown below support may open downside movement toward 79,200, followed by deeper support near 76,700. Current price action suggests a range-bound consolidation before the next major
BTCUSD ANALYSIS BTCUSD Long Bitcoin vs US Dollar

BTCUSD ANALYSIS

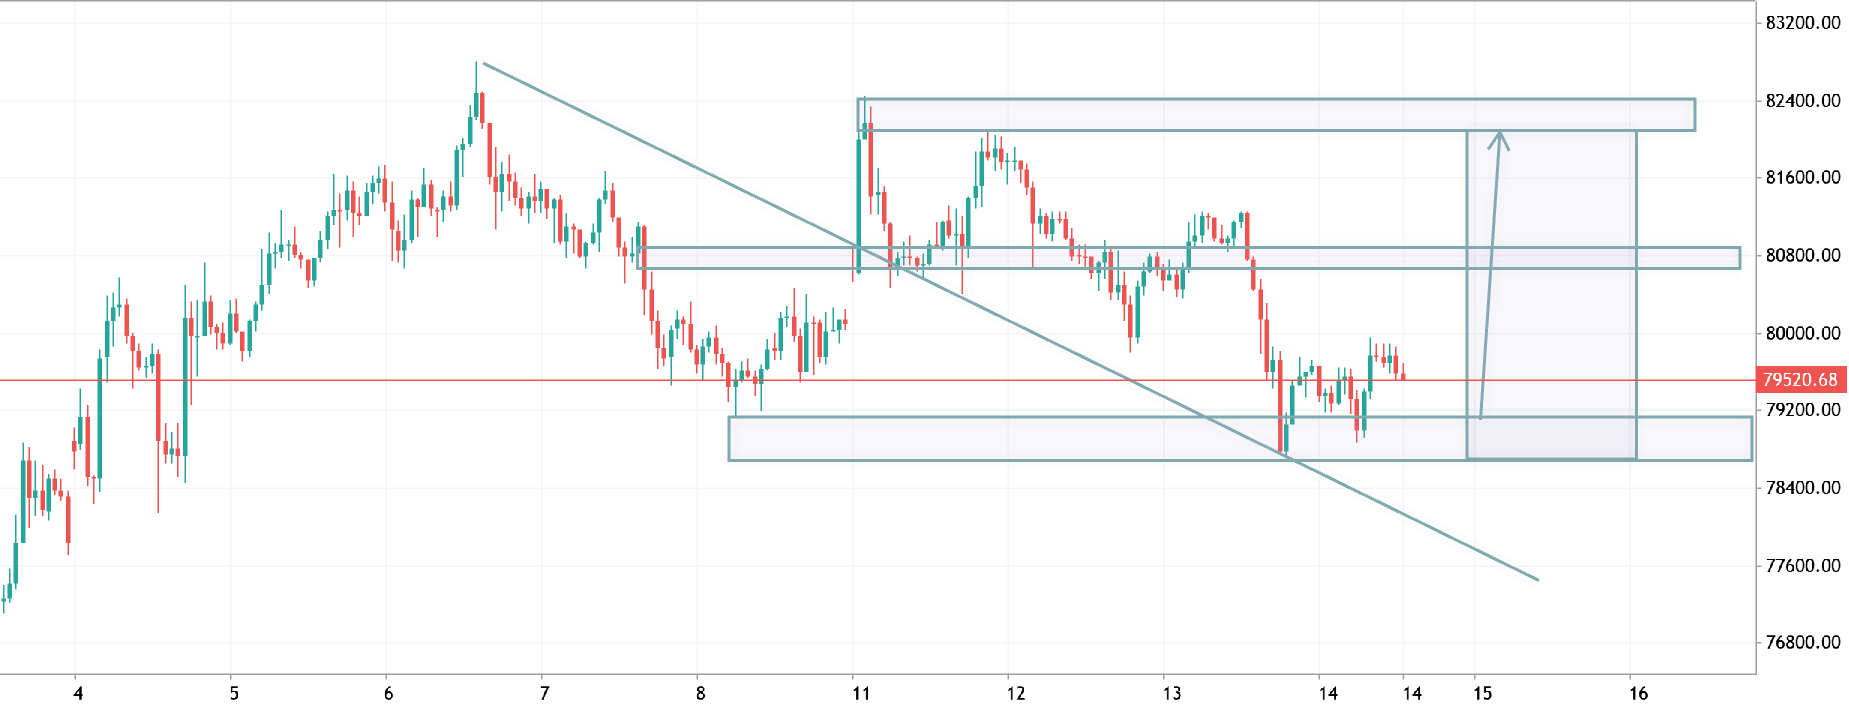
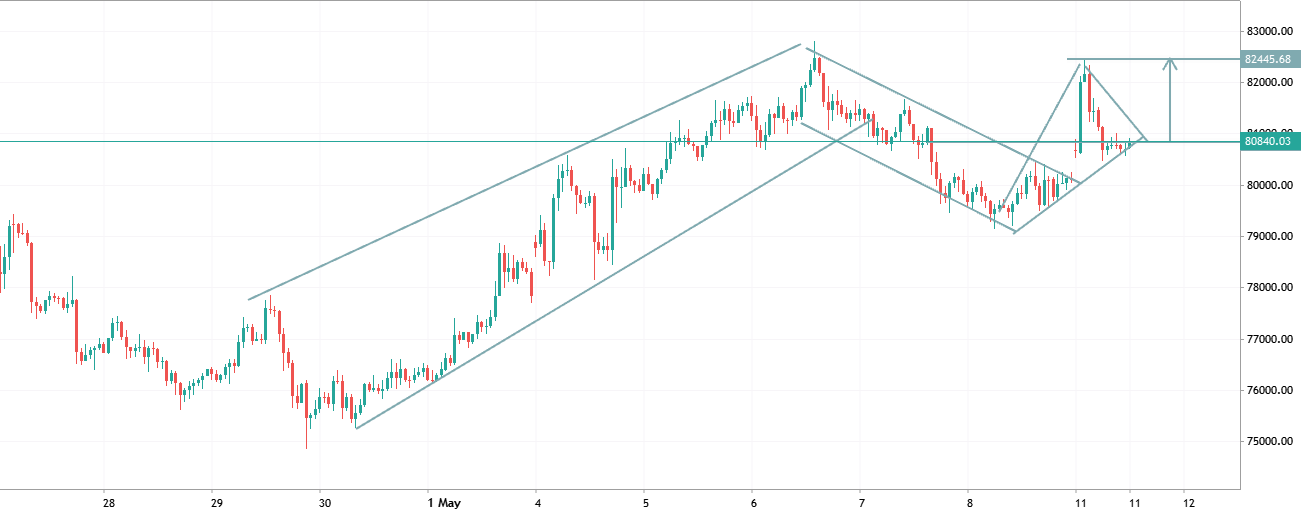
BTCUSD ANALYSIS ₿ BTC is currently showing a bullish market structure, while forming a potential Bullish Flag / Pennant pattern in the short term. After a strong impulsive rally, price has entered a consolidation phase around the 80.8k - 81k zone, which often signals continuation if buyers remain in control. Bullish Confirmation: • Break & close above the 81,500 – 82,000 resistance zone • Strong momentum and volume continuation Target 1: 82,500 Target 2: 83,000+ Invalidation: If BTC closes strongly below the 80k support zone, the bullish setup weakens and a deeper pullback may follow. Key Observations: • Higher lows are still being respected • Market structure remains bullish overall • Current movement looks more like consolidation than reversal In simple terms: Break above 81k =