BTCUSD H1 ANALYSIS BTCUSD Bitcoin vs US Dollar

BTCUSD H1 ANALYSIS

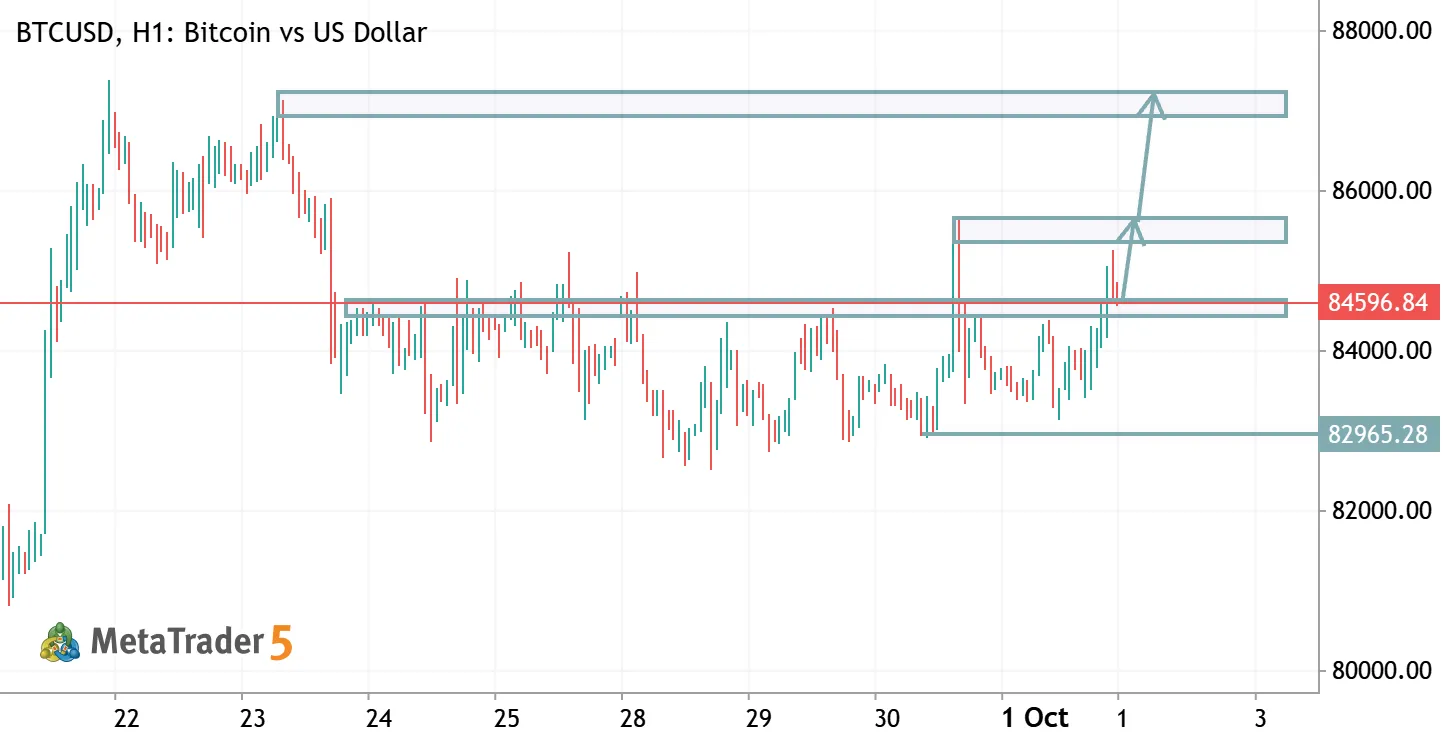
BTCUSD h1 Analysis Bitcoin is consolidating inside a broad 82,000–84,000 range. Price is holding above the lower support zone, while 84,000–85,200 remains the key resistance area. A confirmed breakout above 85,200 could open the path toward higher levels. A break below 82,000 would weaken the bullish structure. Bias: Bullish above 82,000, with breakout confirmation required. Trade with proper risk management. This is technical analysis, not financial advice.
BTCUSD H4 ANALYSIS BTCUSD Bitcoin vs US Dollar

BTCUSD H4 ANALYSIS

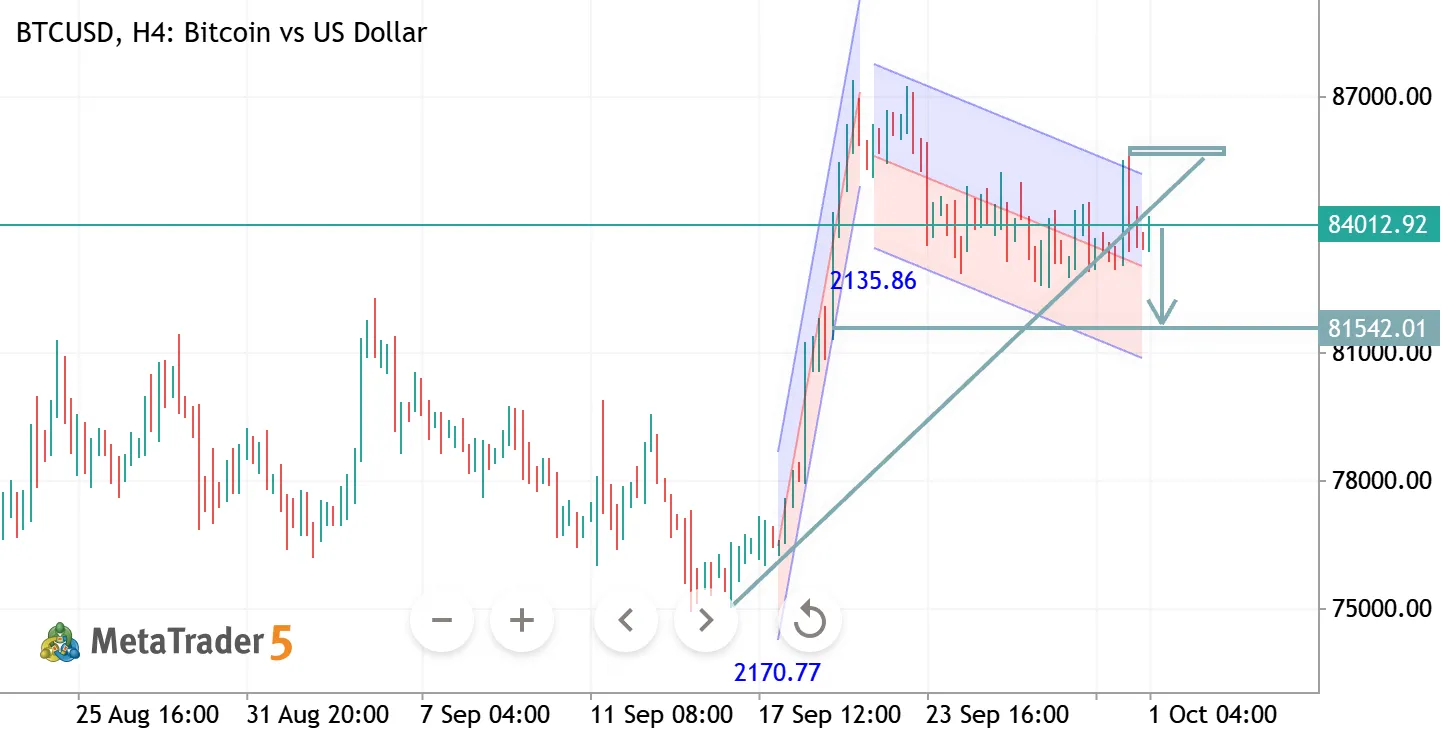
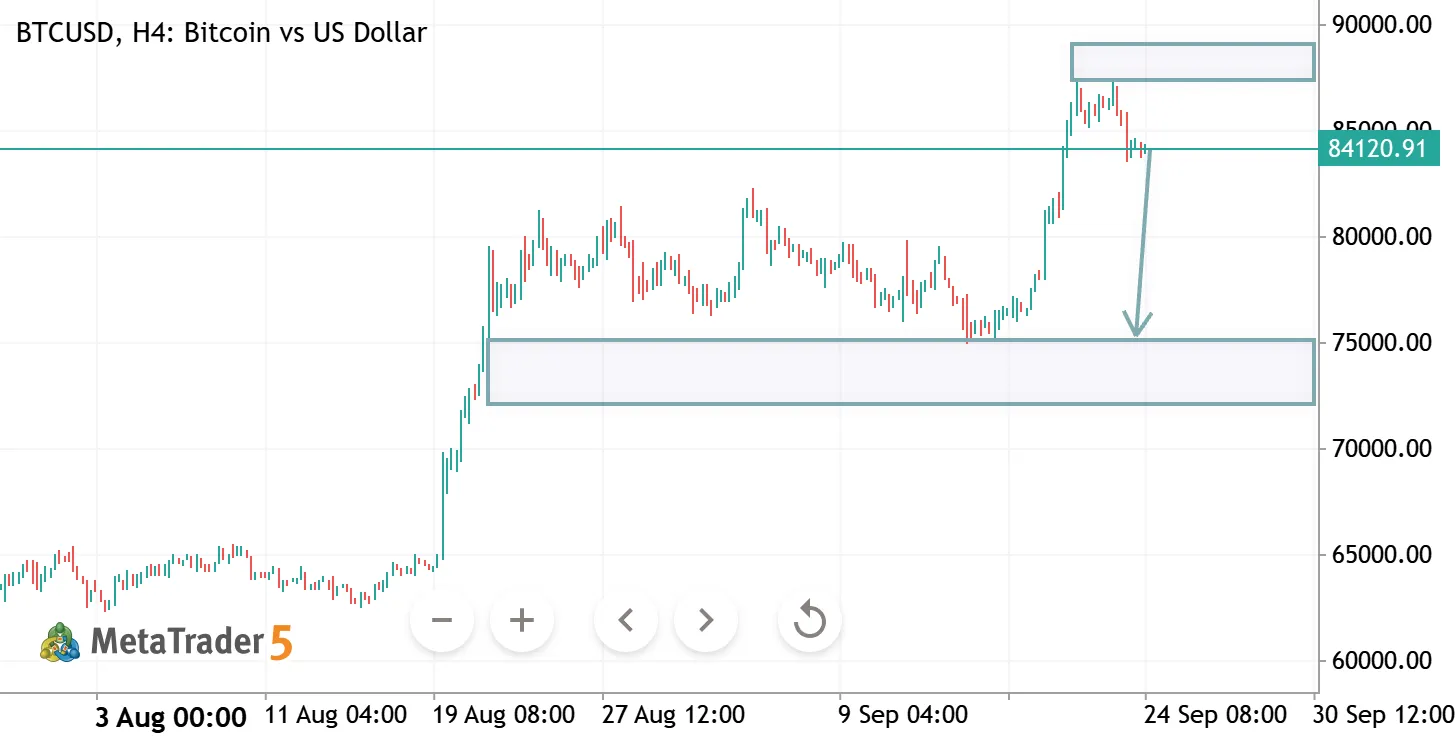
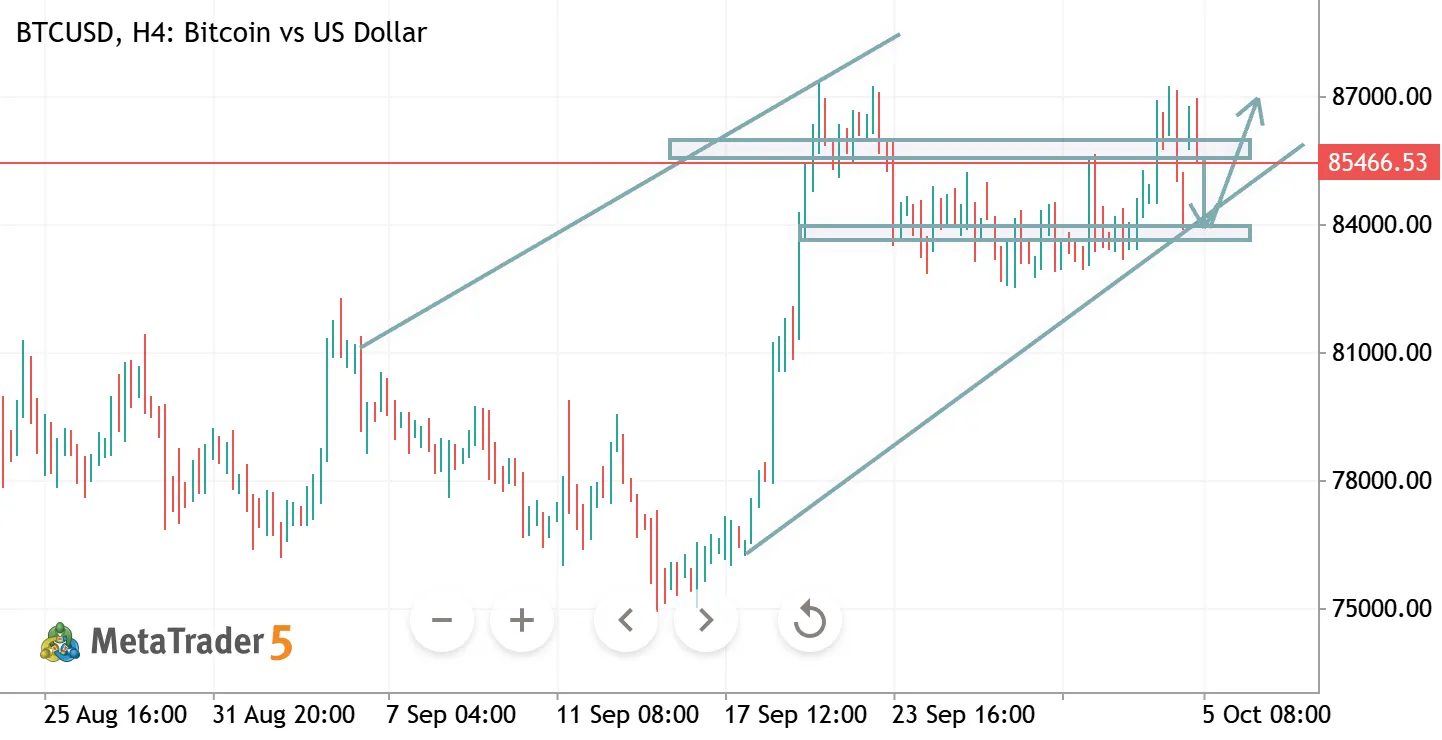
BTCUSD – Technical Analysis 📊 BTCUSD faced rejection from the 8,500 resistance zone after a strong bullish rally. Price is showing short-term bearish momentum, with a potential correction toward the 7,500 support area. 🔻 Bearish outlook: A break below 8,100 could strengthen downside pressure toward 7,500. 🔑 Key Resistance: 8,500–8,700 🎯 Potential Support: 7,500–7,200 A sustained move above resistance could invalidate the bearish scenario and signal further upside. Disclaimer: Technical analysis is based on chart structure. Always manage risk before trading.
BTCUSD H4 ANALYSIS BTCUSD Bitcoin vs US Dollar

BTCUSD H4 ANALYSIS

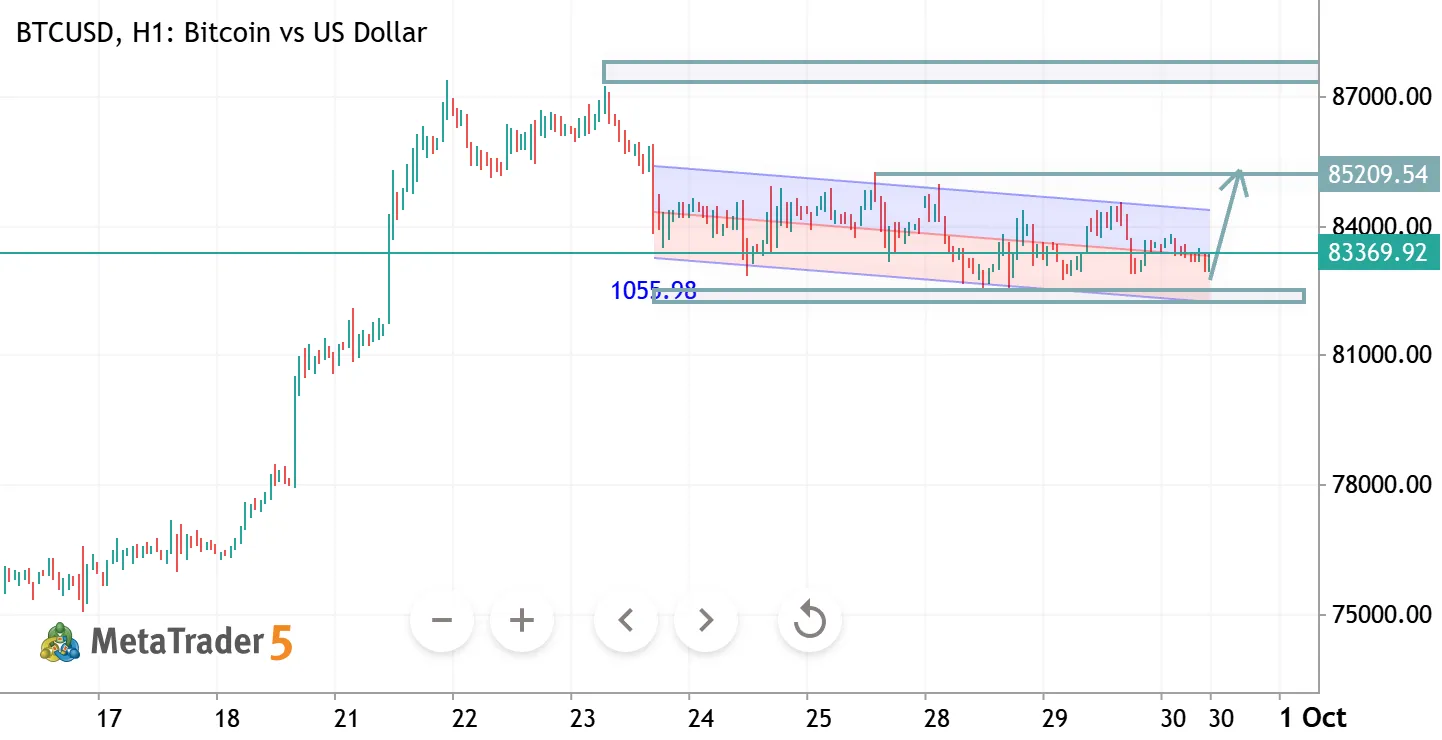
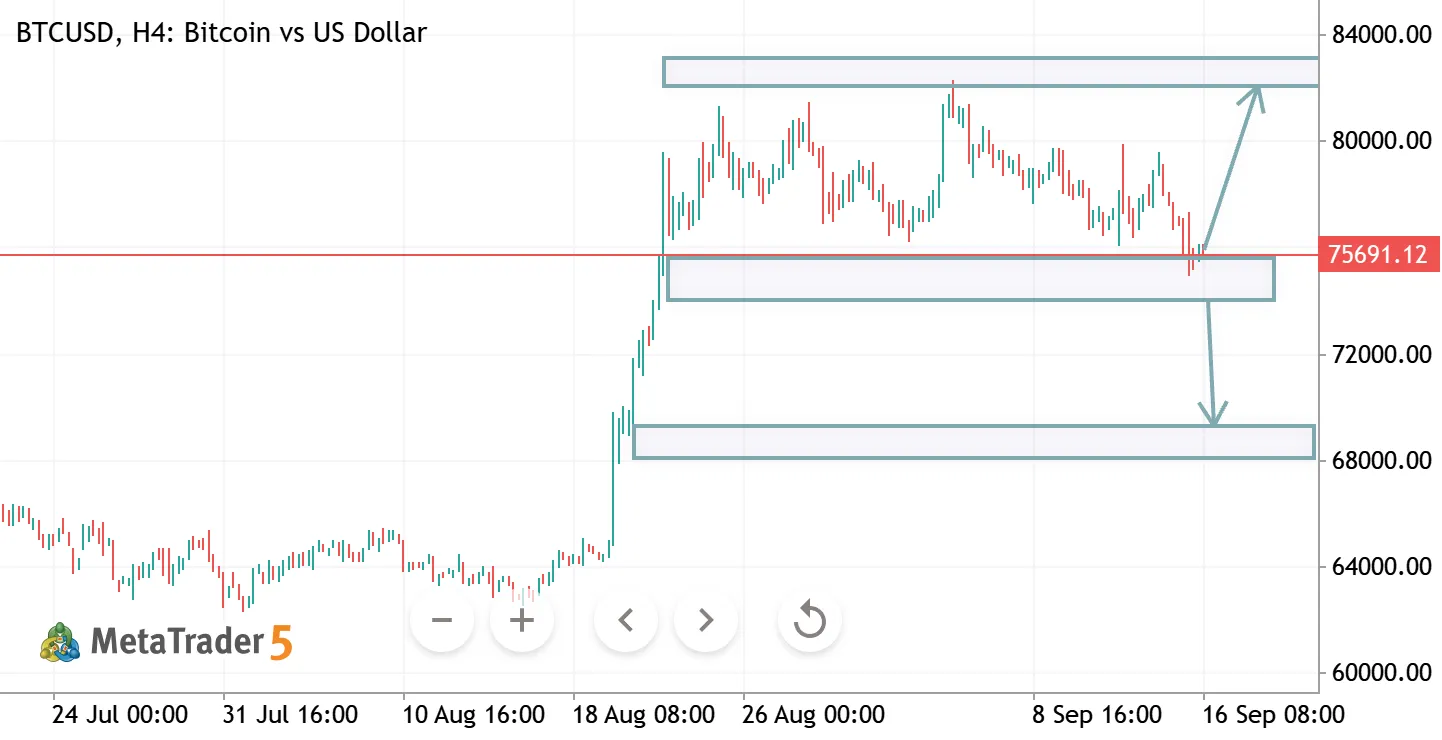
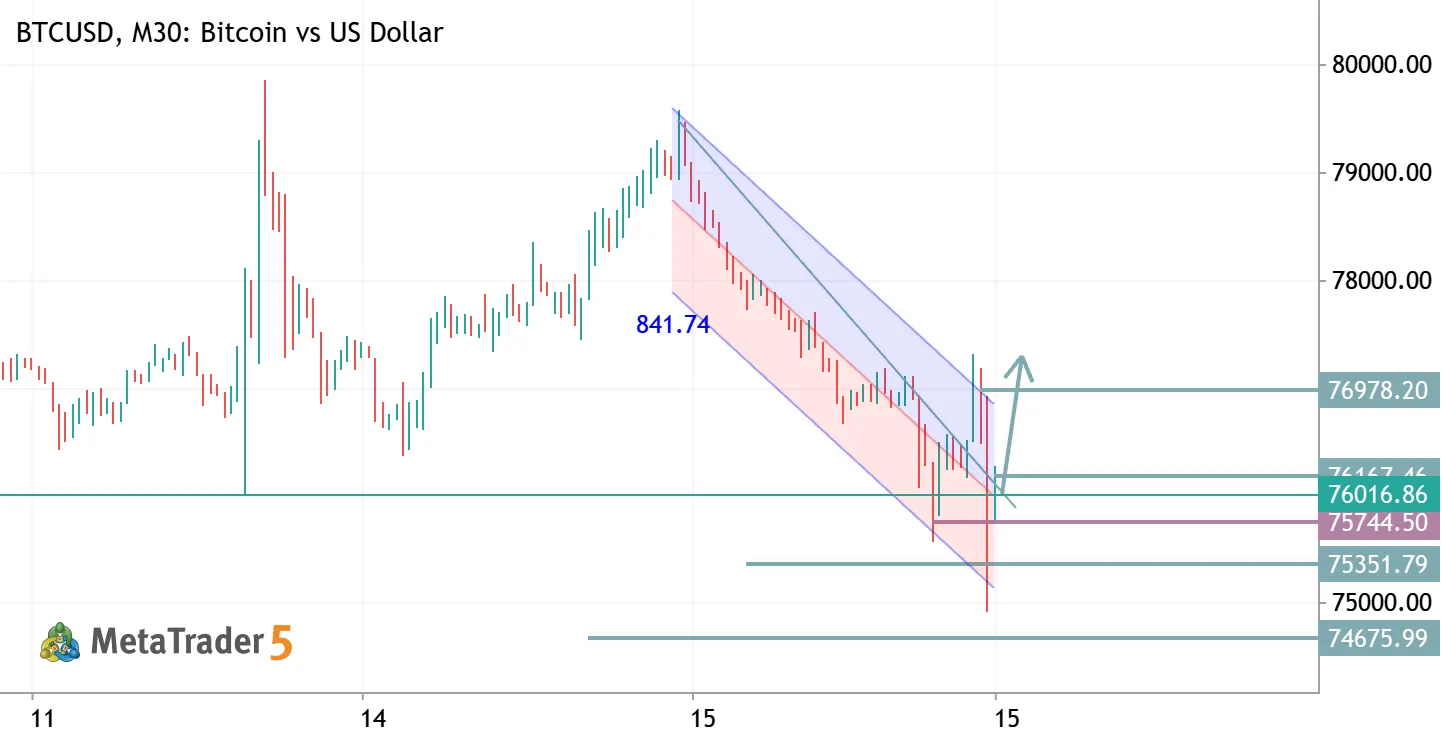
BTCUSD H4 – Short & Smart Analysis 🔹 Price is consolidating around the 75,500–76,000 support zone. 🔹 If this support holds, a bullish move toward 80,000–82,000 is possible. 🔹 A confirmed H4 breakdown below 75,000 may expose the next support around 68,000–70,000. Bias: Range-bound with bullish potential above support Support: 75,500–76,000 Resistance: 80,000–82,000 Risk Management: Wait for confirmation and use proper SL.
BTCUSD H4 ANALYSIS BTCUSD Bitcoin vs US Dollar

BTCUSD H4 ANALYSIS

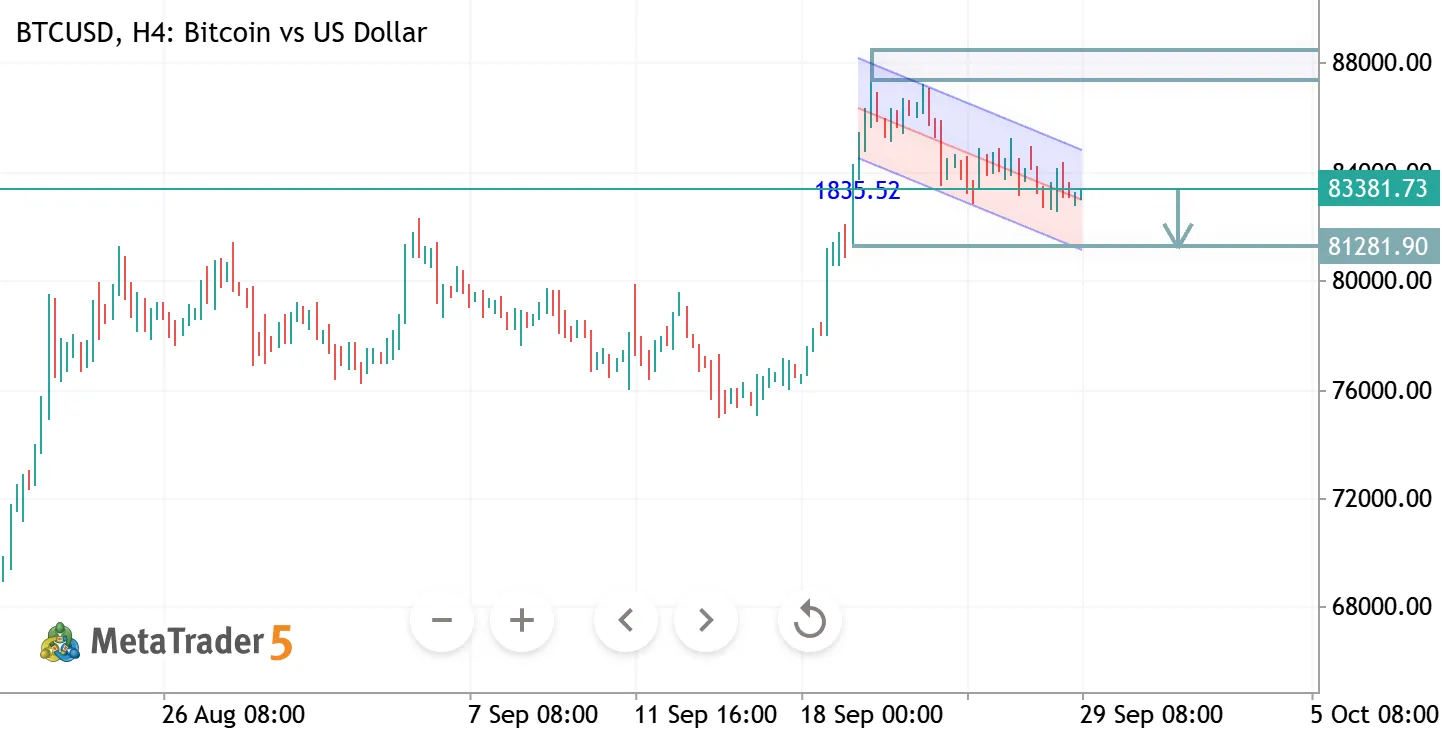
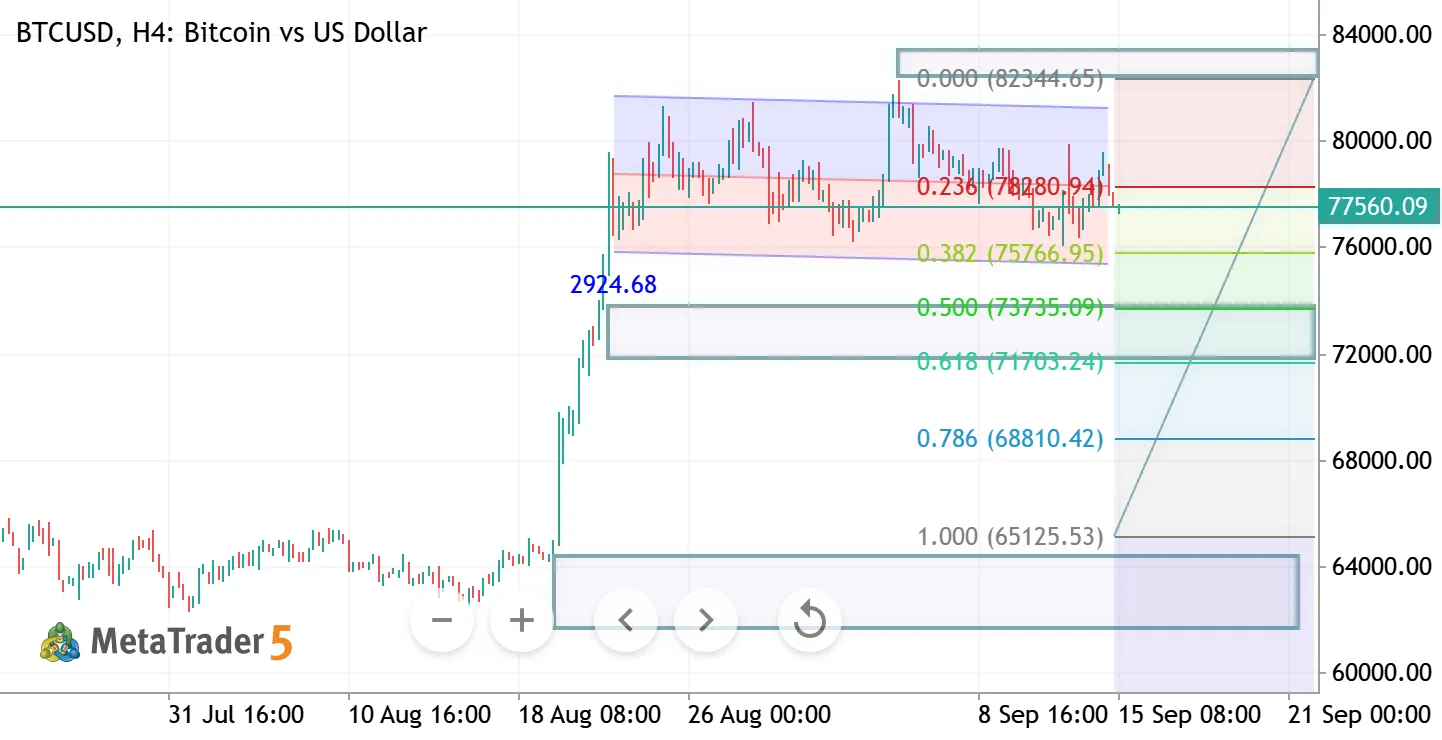
BTCUSD H4 – Technical Analysis 📊 Bitcoin is consolidating below the 78,800 resistance within a descending channel. 🔹 Bullish: Break and hold above 78,800 → potential targets 80,000–83,900. 🔹 Bearish: Rejection below resistance → 75,770 → 73,745 → 71,440. 🔹 Key support: 75,770. Bias: Neutral-to-bearish below 78,800. Wait for confirmation before entry. Disclaimer: Technical analysis is for educational purposes only, not financial advice.
BTC/USD Hourly Technical Update: Reclaiming the 79.6k Support Zone for a Push Toward 82.4k BTCUSD Long Bitcoin vs US Dollar

BTC/USD Hourly Technical Update: Reclaiming the 79.6k Support Zone for a Push Toward 82.4k

Bitcoin is showing strong signs of stabilization after a quick liquidity sweep following its recent rally. Here is a breakdown of what the 1-hour chart is telling us right now: Technical Breakdown Trendline Break & Impulsive Expansion: Bitcoin broke out of its initial downward trendline around the $77,000 level, driving a strong impulsive move up to test resistance near $81,600–$82,000. Flag Consolidation & Liquidity Grab: Following that strong move up, price consolidated into a classic bullish flag/channel structure. After a sharp dip swept recent low-liquidity areas down to roughly $78,500, price aggressively bounced back into the demand range. Key Support Level: The price is currently hovering around $79,656 , right at a major horizontal flip zone that previously acted as