BTCUSD TRADE IDEA BTCUSD Long Bitcoin vs US Dollar

BTCUSD TRADE IDEA

BTCUSD (H1) Trade Analysis – Bullish Bias Market Structure Price is trading inside a descending wedge , a pattern that often precedes a bullish breakout. Buyers have defended the 58,000–58,800 support area several times. Short-term momentum remains weak until the wedge resistance is broken. Buy Setup Entry Zone: 58,500–59,000 (after bullish confirmation) Stop Loss: Below 57,950 Take Profit 1: 60,300–60,600 Take Profit 2: 61,800–62,100 Take Profit 3: 63,500–64,000 (if bullish momentum continues) Alternative Scenario If BTC closes below 57,950 , the bullish setup is invalidated. A breakdown could lead to a move toward 57,000 and potentially 56,000 . Trading Plan Wait for a strong bullish rejection from support or a break and close above the wedge resistance before entering. Avoid buying in
BTCUSD H1 ANALYSIS BTCUSD Bitcoin vs US Dollar

BTCUSD H1 ANALYSIS

BTCUSD H1 Analysis BTC is consolidating within a descending structure while holding above a key Fibonacci support zone. Momentum is building, and a breakout could define the next major move. 📈 Bullish Scenario: A confirmed break above 60,700–61,300 may trigger a rally toward 63,900. 📉 Bearish Scenario: If support around 59,000 fails, expect a continuation toward lower demand levels. Bias: Neutral-to-Bullish. Wait for a confirmed breakout before entering. #BTCUSD #Bitcoin #Crypto #TechnicalAnalysis #MQL5 #PriceAction
BTCUSD H1 ANALYSIS BTCUSD Bitcoin vs US Dollar

BTCUSD H1 ANALYSIS

BTCUSD H1 Analysis BTCUSD has reached a key support zone after a sharp bearish move. Price is reacting near the Fibonacci retracement support and showing signs of a potential bullish rebound. A successful hold above the current low could trigger a recovery toward the 61.8%–78.6% Fibonacci resistance area. However, a break below support may extend the downtrend. Bias: Bullish Recovery Above Support Key Resistance: 60,500 – 62,300 Key Support: 58,700 – 59,200 Trade with proper risk management. This analysis is for educational purposes only and not financial advice.
BTCUSD H1 ANALYSIS BTCUSD Bitcoin vs US Dollar

BTCUSD H1 ANALYSIS

BTCUSD H1 Analysis Price has broken below the descending trendline and is testing a key support zone around 62.0k–62.2k. A successful rebound from this area could trigger a corrective move toward 63.0k–64.0k resistance. However, sustained weakness below support may keep bearish pressure intact. Bias: Neutral to Bullish (if support holds) Key Support: 62,000 Key Resistance: 63,000 – 64,000 Trade with proper risk management and wait for confirmation before entry.
BTCUSD H4 ANALYSIS BTCUSD Bitcoin vs US Dollar

BTCUSD H4 ANALYSIS

BTCUSD H4 Analysis Bitcoin has broken out of its short-term bearish structure and is now testing a key resistance zone. The recent bullish momentum suggests buyers remain in control, with potential for a continuation move toward higher liquidity levels if resistance is cleared. 📈 Bias: Bullish 🎯 Targets: 64,000 → 68,000 ⚠️ Key Support: 60,000–61,000 Momentum favors the upside, but a rejection from resistance could trigger a pullback before the next move higher. Manage risk accordingly.
BTCUSD H4 ANALYSIS BTCUSD Bitcoin vs US Dollar

BTCUSD H4 ANALYSIS

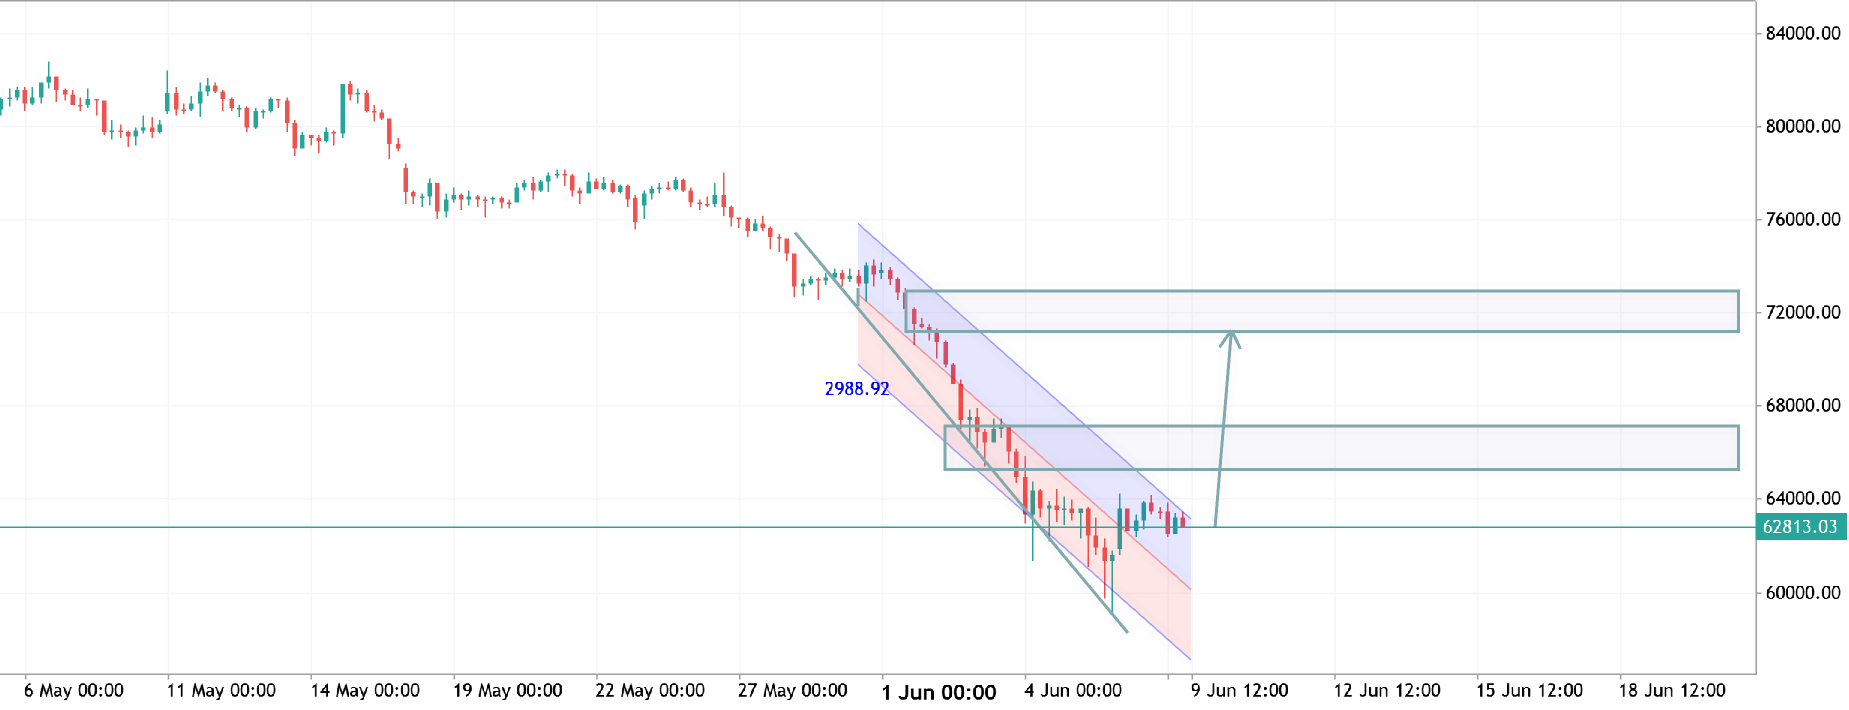
BTCUSD Technical Outlook BTC is showing signs of a bullish reversal after breaking out of a descending channel. Price has reclaimed short-term structure and is attempting to build momentum from the recent lows. 📈 Bullish Scenario: A sustained move above 64,500 could accelerate buying pressure toward 67,000–72,000. 🔹 Support: 62,000–63,000 🔹 Resistance: 64,500, 67,000, 72,000 Market Bias: Bullish while price remains above the channel breakout zone. Higher lows suggest buyers are regaining control. Disclaimer: This analysis is for educational purposes only and not financial advice. Always use proper risk management before trading.
BTCUSD TRADE IDEA BTCUSD Bitcoin vs US Dollar

BTCUSD TRADE IDEA

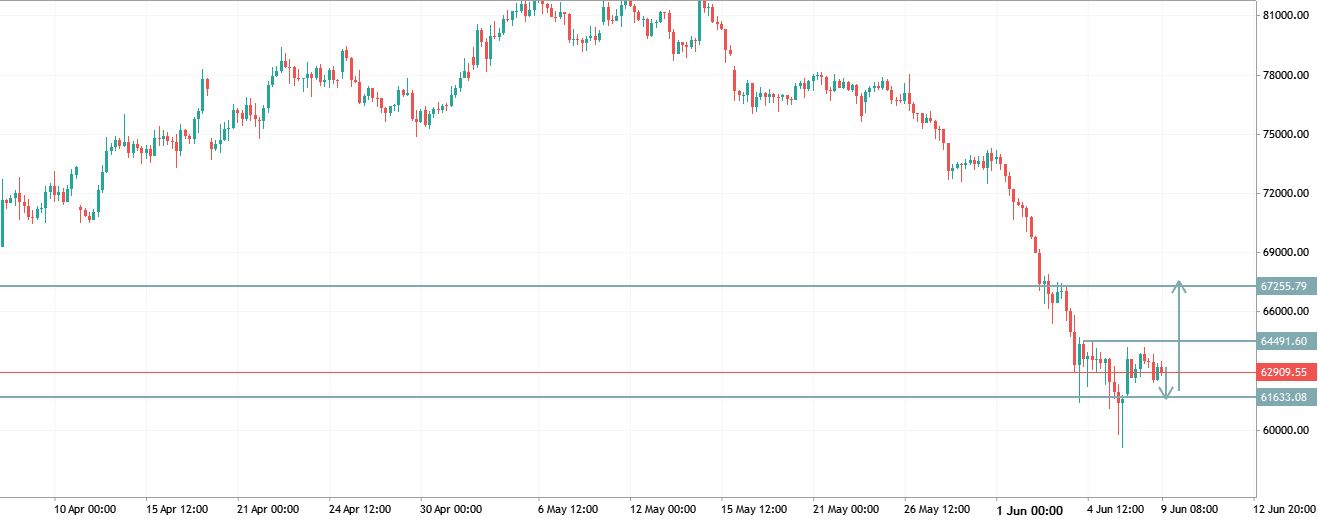
Market Structure: Bearish The chart shows a strong downtrend with consecutive lower highs and lower lows. Heavy selling pressure pushed price from the 81,000 area down toward 61,000–63,000. Recent price action is moving sideways after the sharp drop, indicating consolidation rather than a confirmed reversal. Key Levels Resistance 1: 64,491 Resistance 2: 67,256 Support 1: 61,633 Current Pivot: 62,845 Bullish Scenario A H4 candle close above 64,491 could trigger a recovery move. Target zones: 67,256 Higher resistance if momentum continues. Bearish Scenario Failure to break 64,491 and a close below 61,633 would favor trend continuation. Sellers could target fresh lows below the recent swing low. Trading Idea Buy Setup: Above 64,491 after a confirmed breakout. TP1: 67,256 SL: Below 61,633
BTC: 60,000 — the level where the next move may be decided BTCUSD Bitcoin vs US Dollar

BTC: 60,000 — the level where the next move may be decided

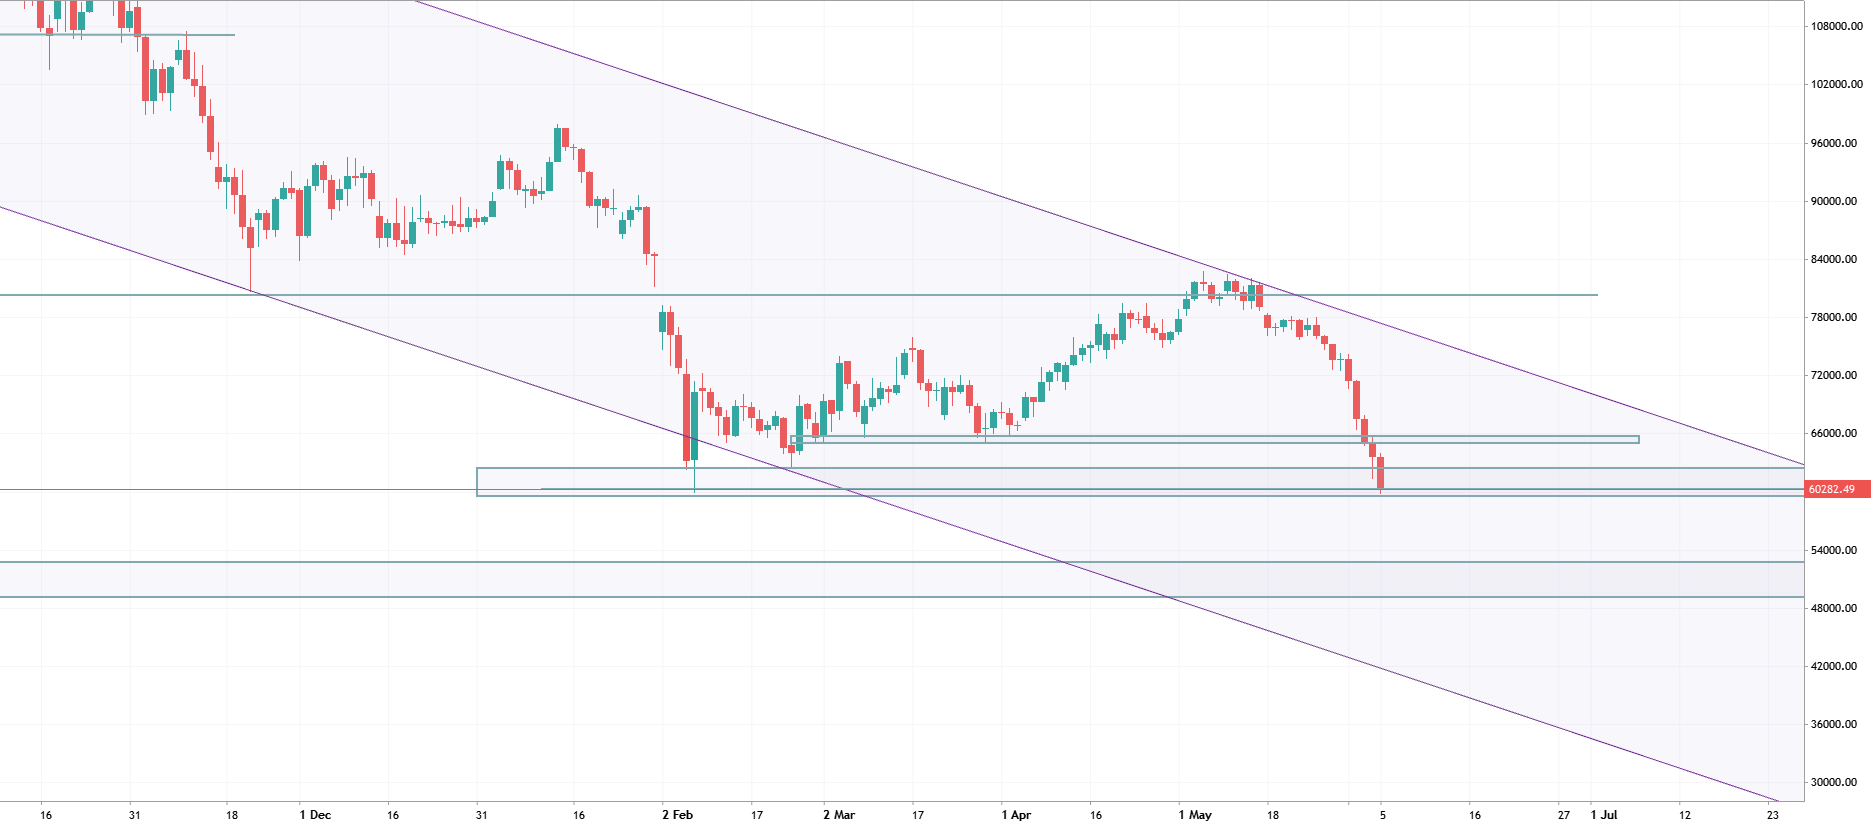
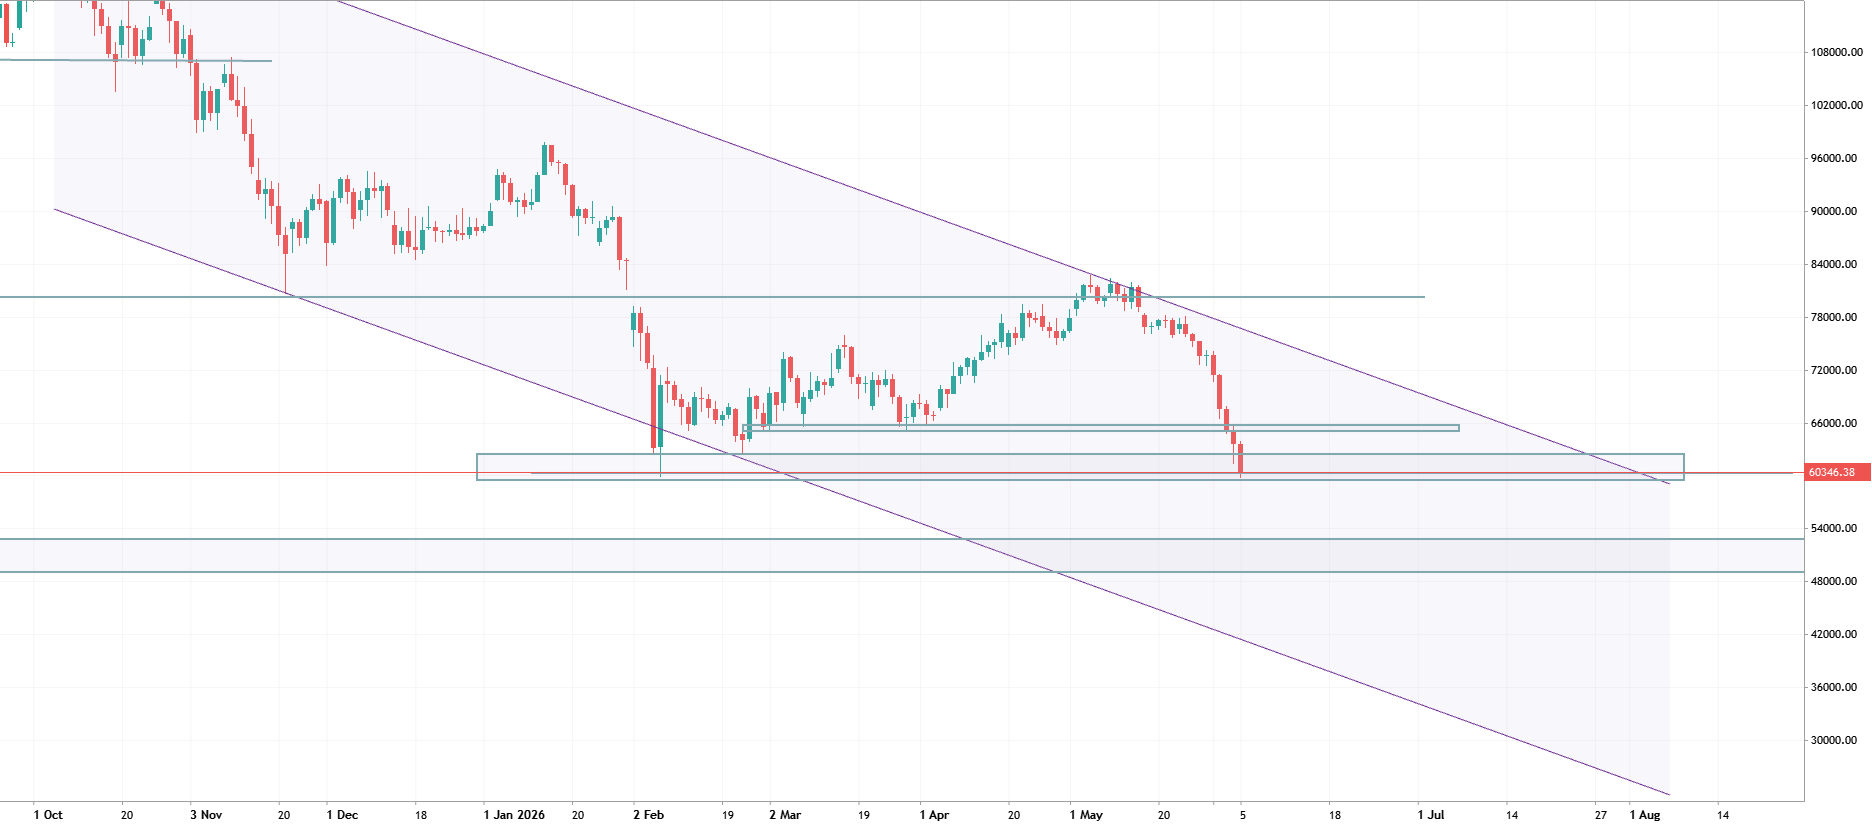
BTC: 60,000 — the level where the next move may be decided Bitcoin is approaching a very important zone. The 60,000 level now looks like the line between market stabilization and a deeper correction. As long as the price holds above 60,000, buyers still have a chance to defend the structure and push BTC into a rebound. In that scenario, the first major resistance area is around 64,000–65,000. This is where a new battle between buyers and sellers may begin. However, if BTC breaks below 60,000 and confirms below this level, the picture becomes much weaker. In that case, the market may start moving toward the next key area: 53,000–50,000. This would no longer look like a simple local pullback, but rather an attempt by sellers to take control. The key point is not just a temporary break below
BTC: 60,000 — уровень, где решается следующий импульс BTCUSD Bitcoin vs US Dollar

BTC: 60,000 — уровень, где решается следующий импульс

BTC: 60,000 — уровень, где решается следующий импульс Биткойн подошёл к очень важной зоне. Уровень 60,000 сейчас выглядит как граница между удержанием рынка и переходом в более глубокую коррекцию. Пока цена держится выше 60,000, у покупателей ещё остаётся шанс защитить структуру и показать отскок. В таком сценарии первой сильной зоной сопротивления будет область 64,000–65,000. Именно там, на мой взгляд, может начаться новая борьба между покупателями и продавцами. Но если BTC пробивает 60,000 и закрепляется ниже, картина становится заметно слабее. В этом случае рынок может начать движение к следующей зоне интереса — 53,000–50,000. Это уже не просто локальный откат, а полноценная попытка продавцов забрать инициативу. Ключевой момент — не сам прокол уровня, а закрепление. Ложный пробой 60,000
BTCUSD H1 ANALYSIS BTCUSD Bitcoin vs US Dollar

BTCUSD H1 ANALYSIS

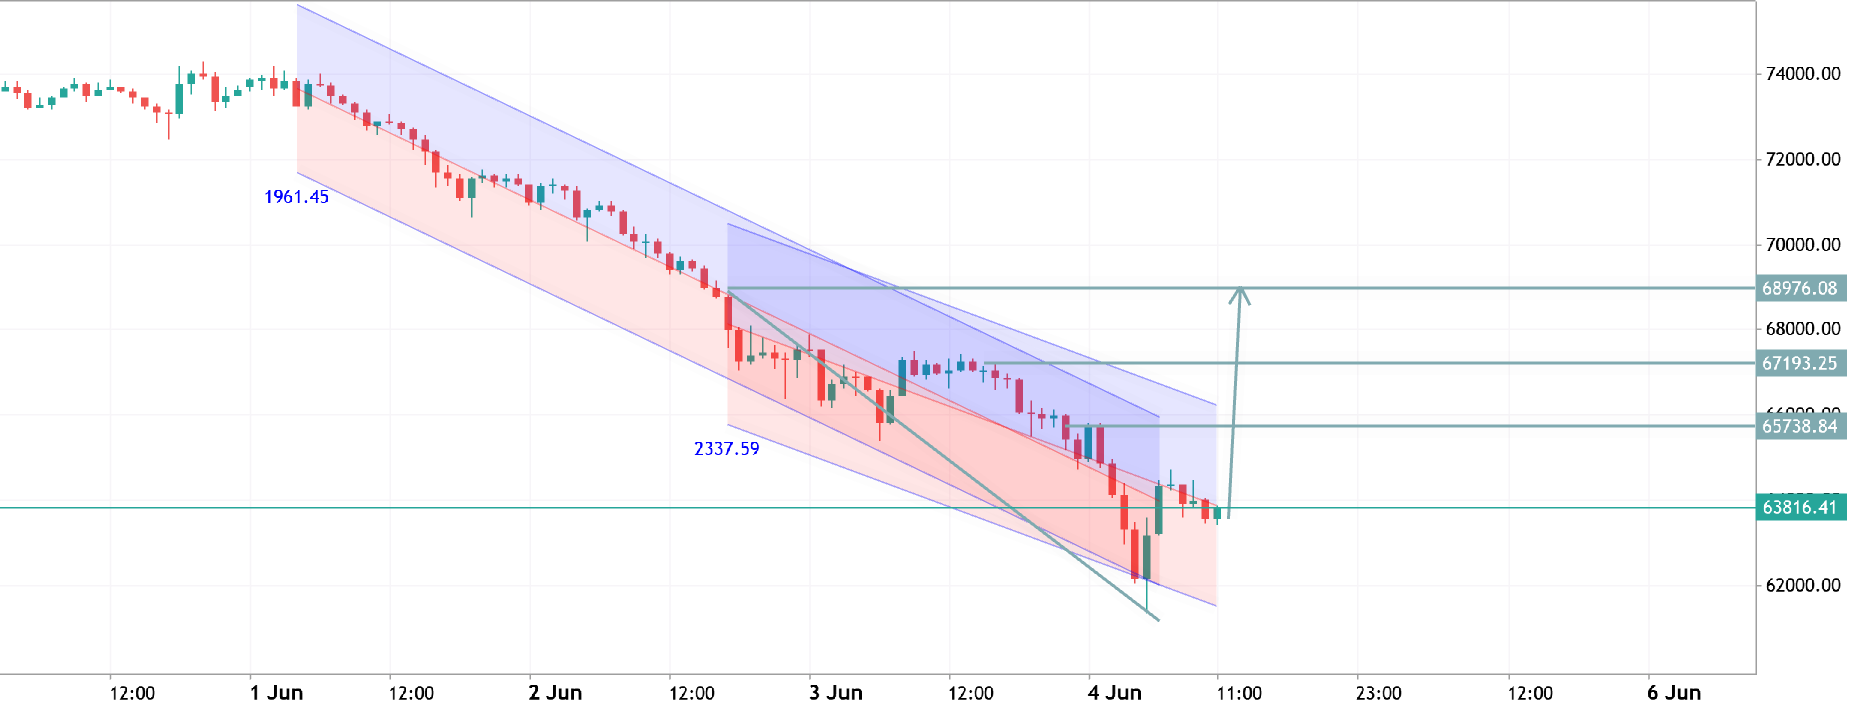
BTCUSD | H1 Analysis BTC is approaching a key breakout zone after a prolonged bearish channel decline. Price is holding above recent lows and attempting to build bullish momentum. 📈 Bullish Setup: A confirmed breakout above channel resistance could trigger a move toward 67.2K – 69.0K. 📊 Key Levels: Support: 63.3K – 63.8K Resistance: 67.2K – 69.0K Outlook: Momentum is shifting in favor of buyers. A clean breakout and hold above resistance may accelerate the recovery toward higher targets. 🚀📊
BTCUUSD TRADE IDEA BTCUSD Long Bitcoin vs US Dollar

BTCUUSD TRADE IDEA

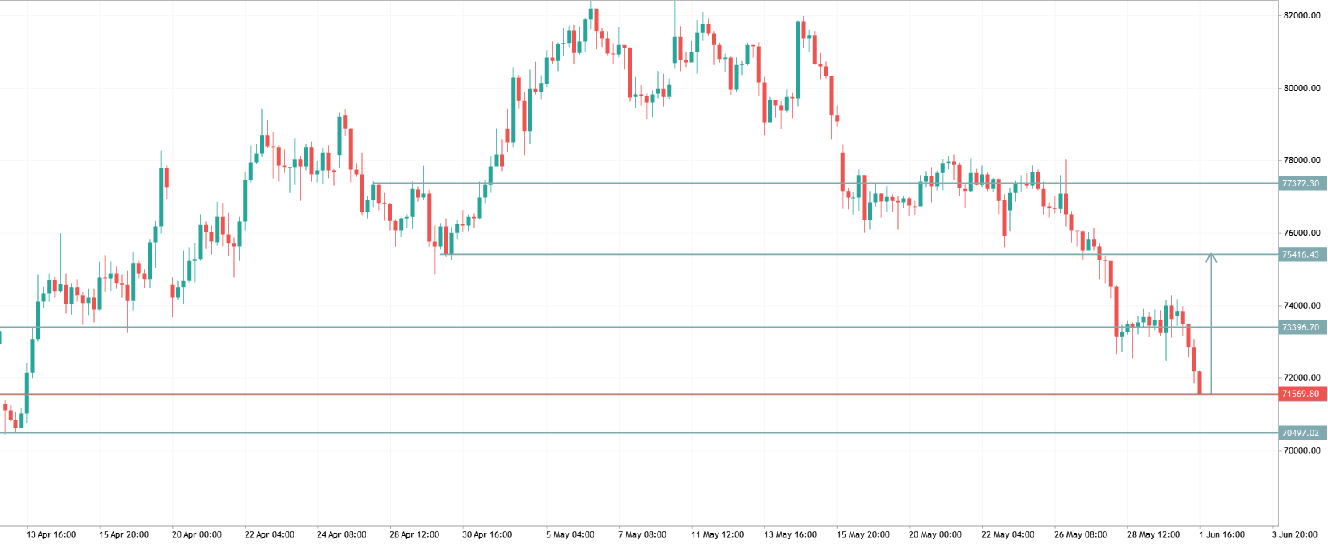
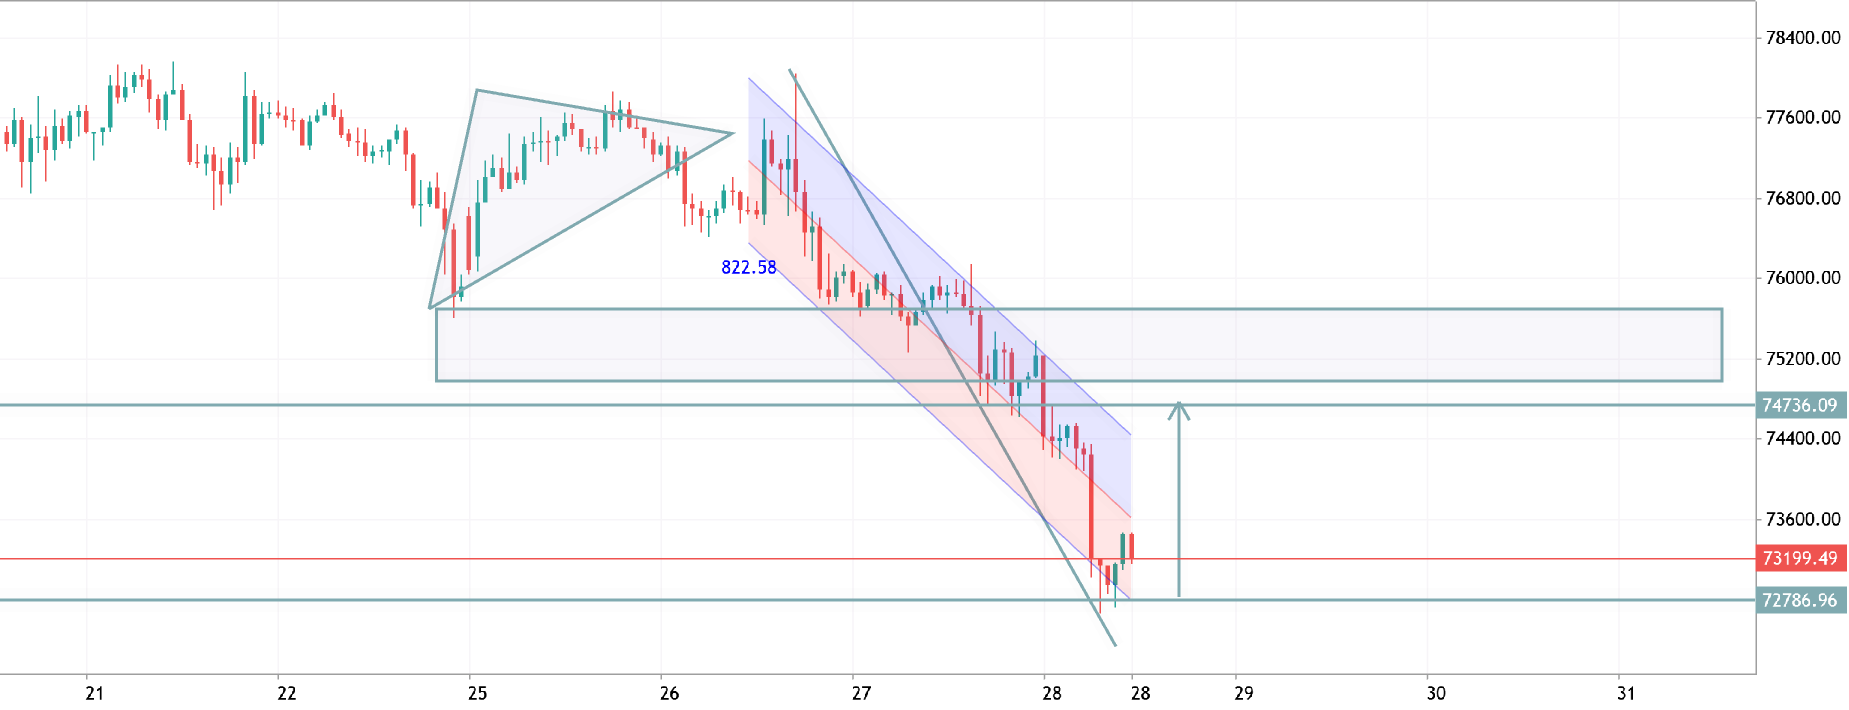
Market Structure: Bearish 📉 Price has broken below multiple support levels and is currently testing a major demand zone around 71,400–70,500 . Momentum remains strongly bearish with a series of lower highs and lower lows. Key Levels: Resistance 1: 73,400 Resistance 2: 75,400 Resistance 3: 77,300 Support 1: 71,400 (current zone) Support 2: 70,400 Support 3: 69,000 Trading Scenario: If BTC holds above 71,400 and forms bullish confirmation, a corrective move toward 73,400 → 75,400 is possible. If 71,400 breaks decisively, selling pressure could extend toward 70,400 and potentially 69,000 . Trade Setup: Buy: Only after a confirmed bullish rejection from 71,400. Sell: On a H4 close below 71,400 with targets at 70,400 and 69,000. Stop Loss: Above/below the breakout candle depending on entry