XAUUSD - Potensi Pullback ke Zona Buy Sebelum Bearish Continuation? XAUUSD Gold vs US Dollar

XAUUSD - Potensi Pullback ke Zona Buy Sebelum Bearish Continuation?

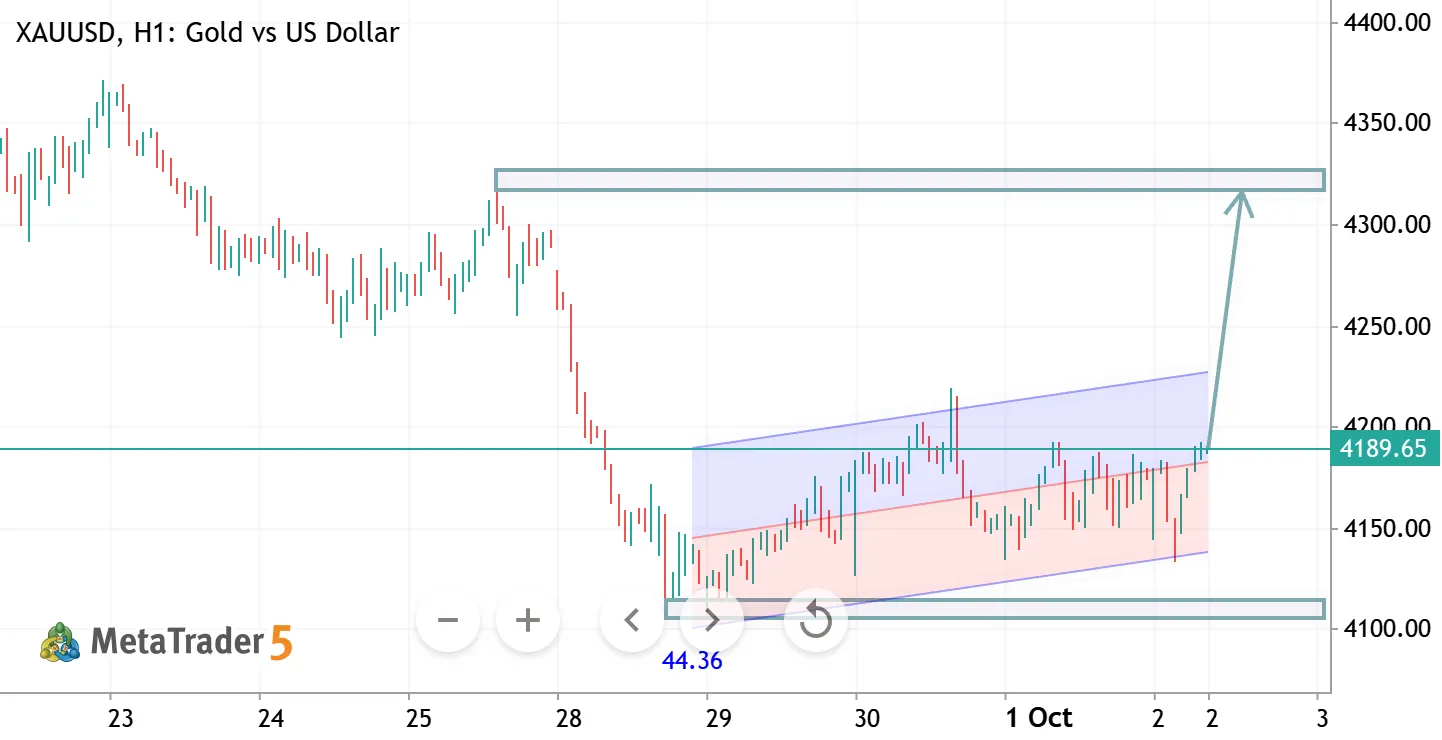
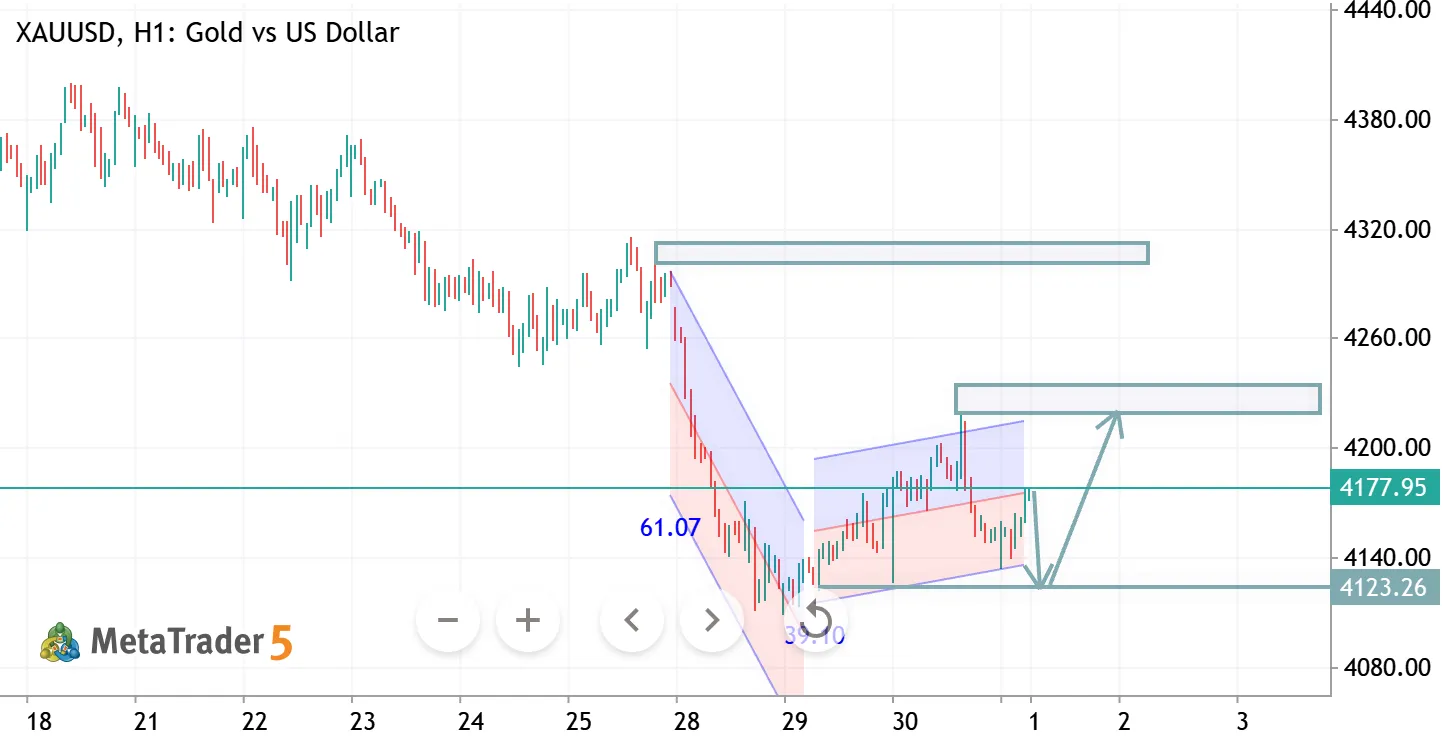
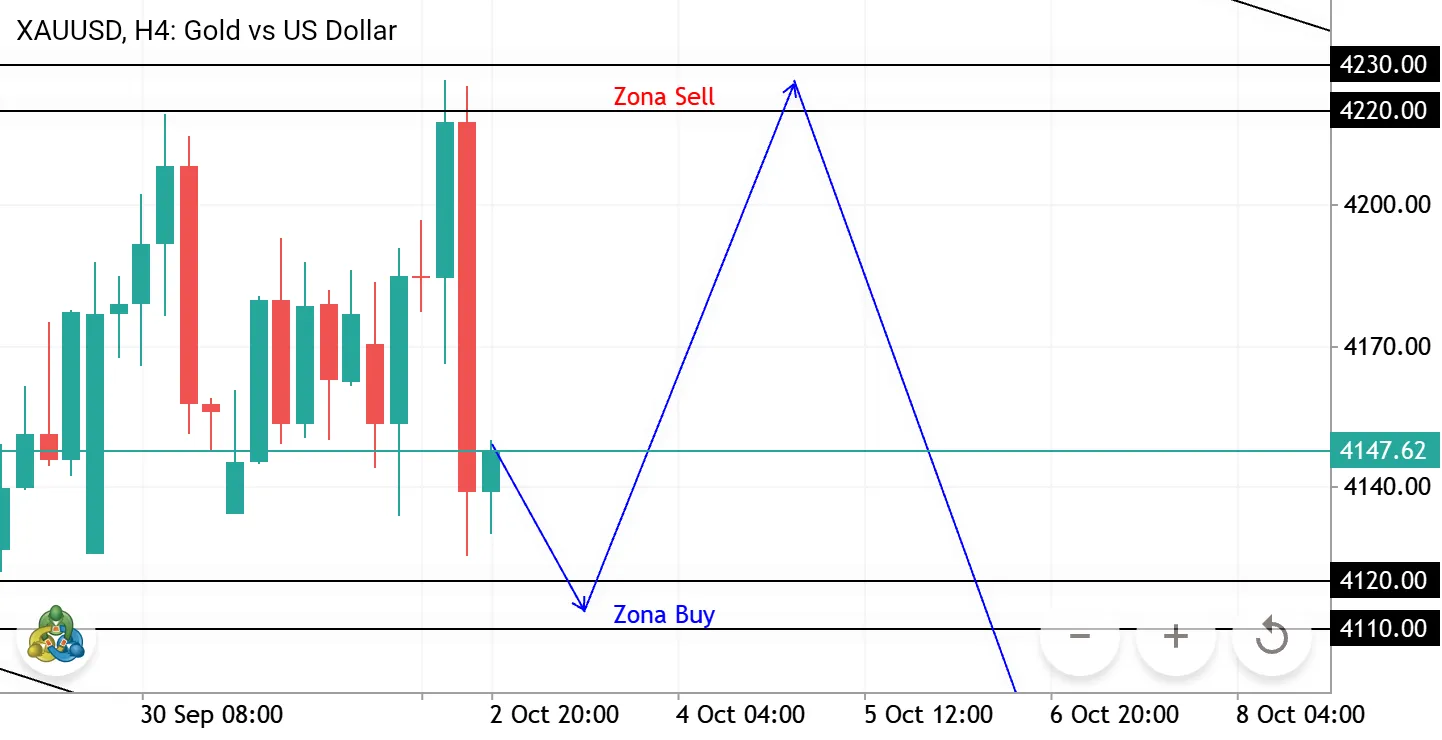
XAUUSD - Potensi Pullback ke Zona Buy Sebelum Bearish Continuation? XAUUSD - H4 MARKET ANALYSIS Pada timeframe H4, XAUUSD masih menunjukkan struktur pergerakan yang cenderung bearish. Harga mengalami penurunan cukup signifikan dan saat ini bergerak di area 4.138. Saya melihat adanya peluang pergerakan korektif sebelum harga melanjutkan penurunan. Skenario yang saya perhatikan: 1.Zona Buy: 4.110-4.120 Area ini menjadi support potensial yang perlu diperhatikan. Saya menunggu reaksi harga di zona ini untuk melihat apakah terdapat penolakan harga (rejection) yang dapat mendorong terjadinya pullback bullish. 2.Zona Sell: 4.220-4.230 Apabila harga berhasil memantul dari zona Buy, area 4.220-4.230 menjadi resistance potensial sekaligus area yang perlu diperhatikan untuk mencari konfirmasi peluang

XAUUSD (Gold) – 4160–4170 Intraday Buy Limit XAUUSD Long Gold vs US Dollar

XAUUSD (Gold) – 4160–4170 Intraday Buy Limit

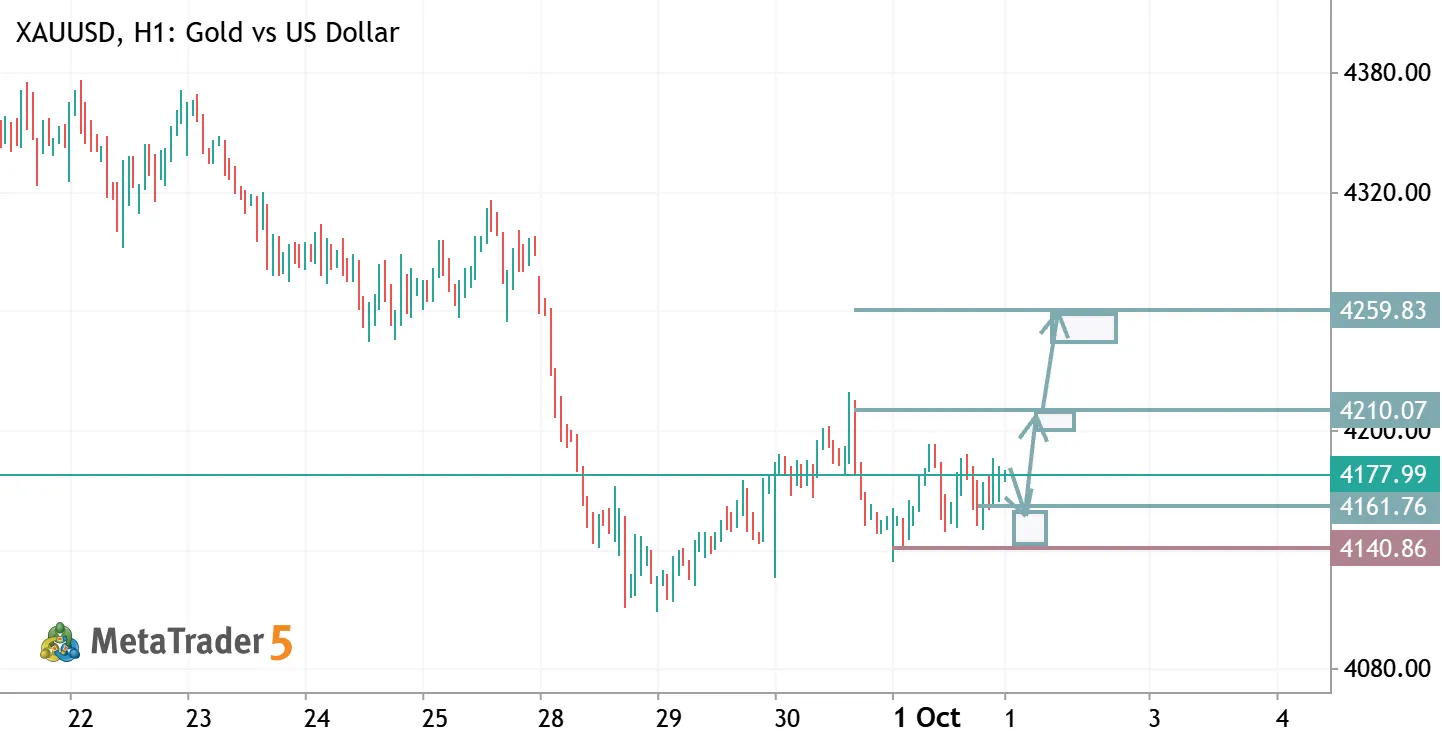
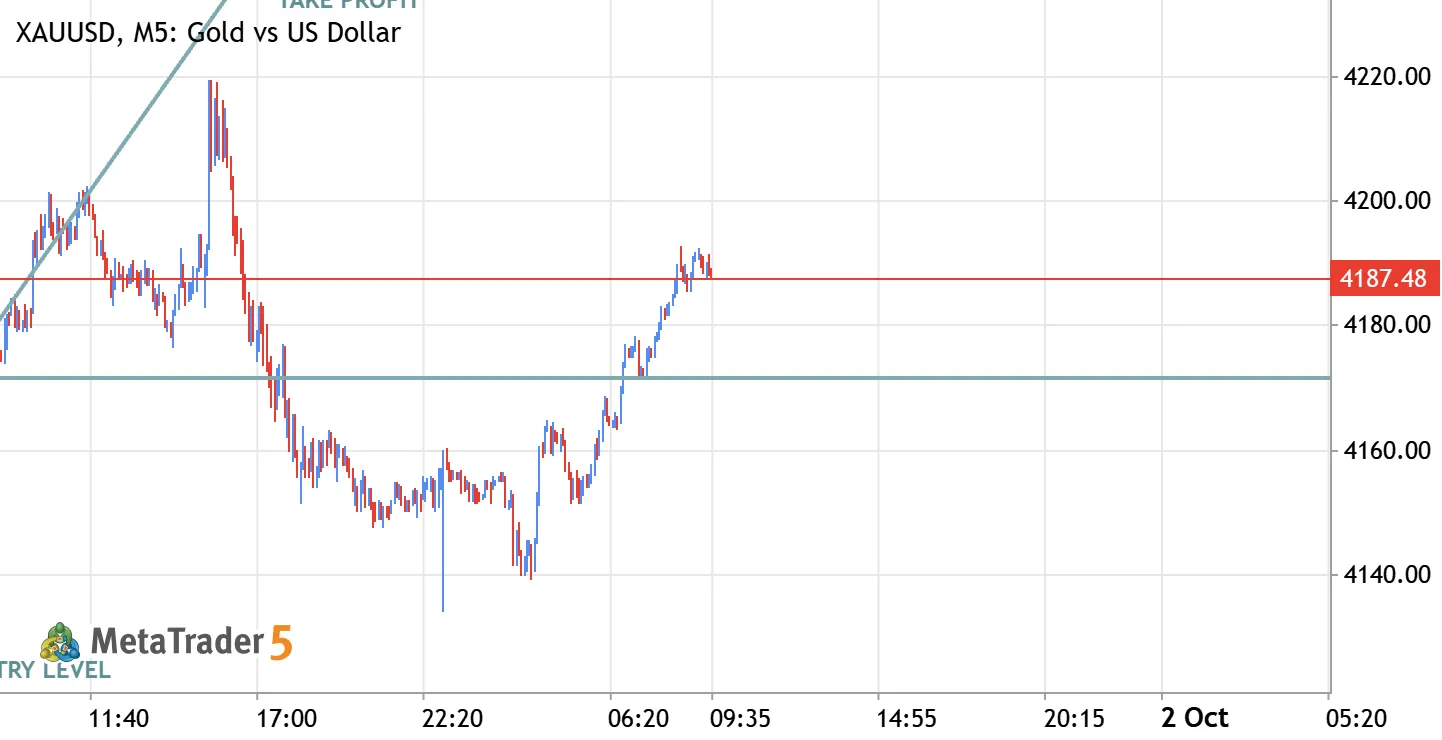
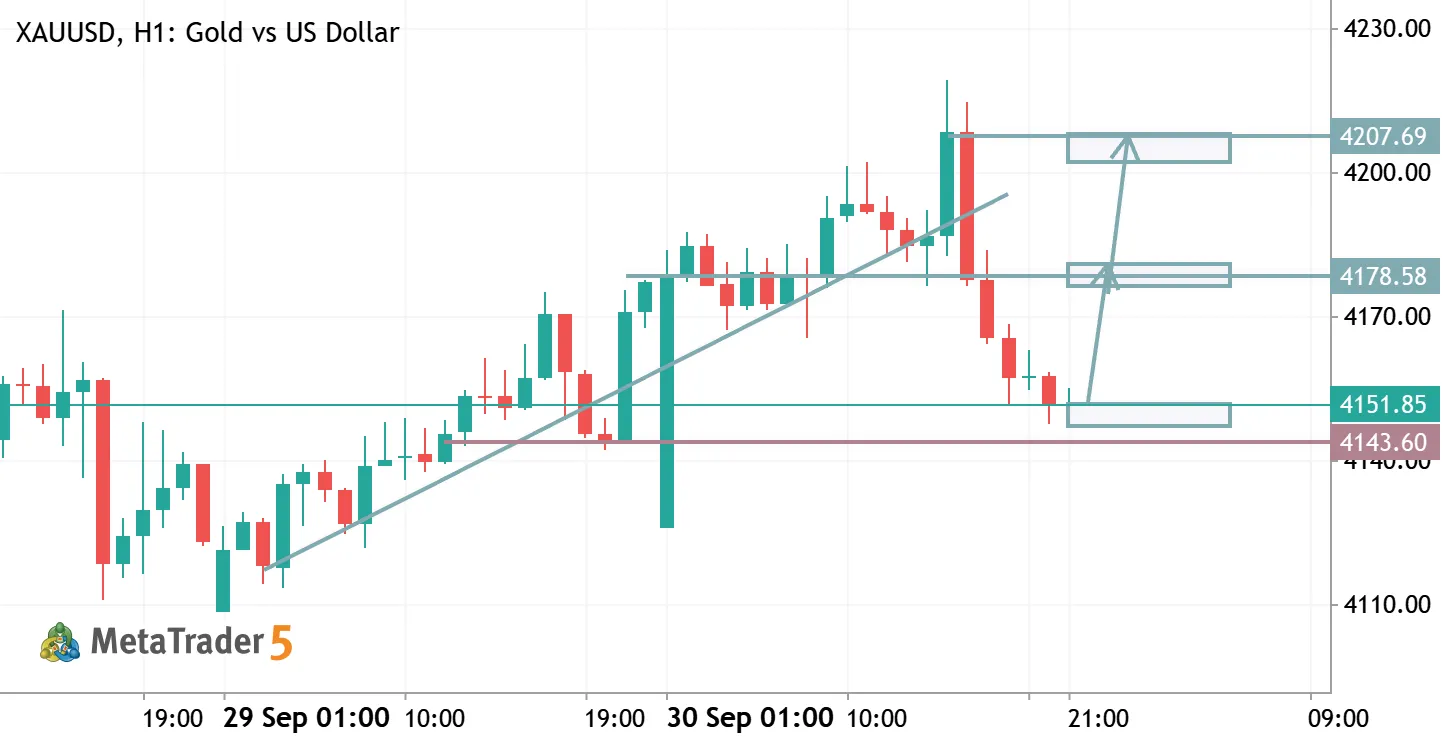
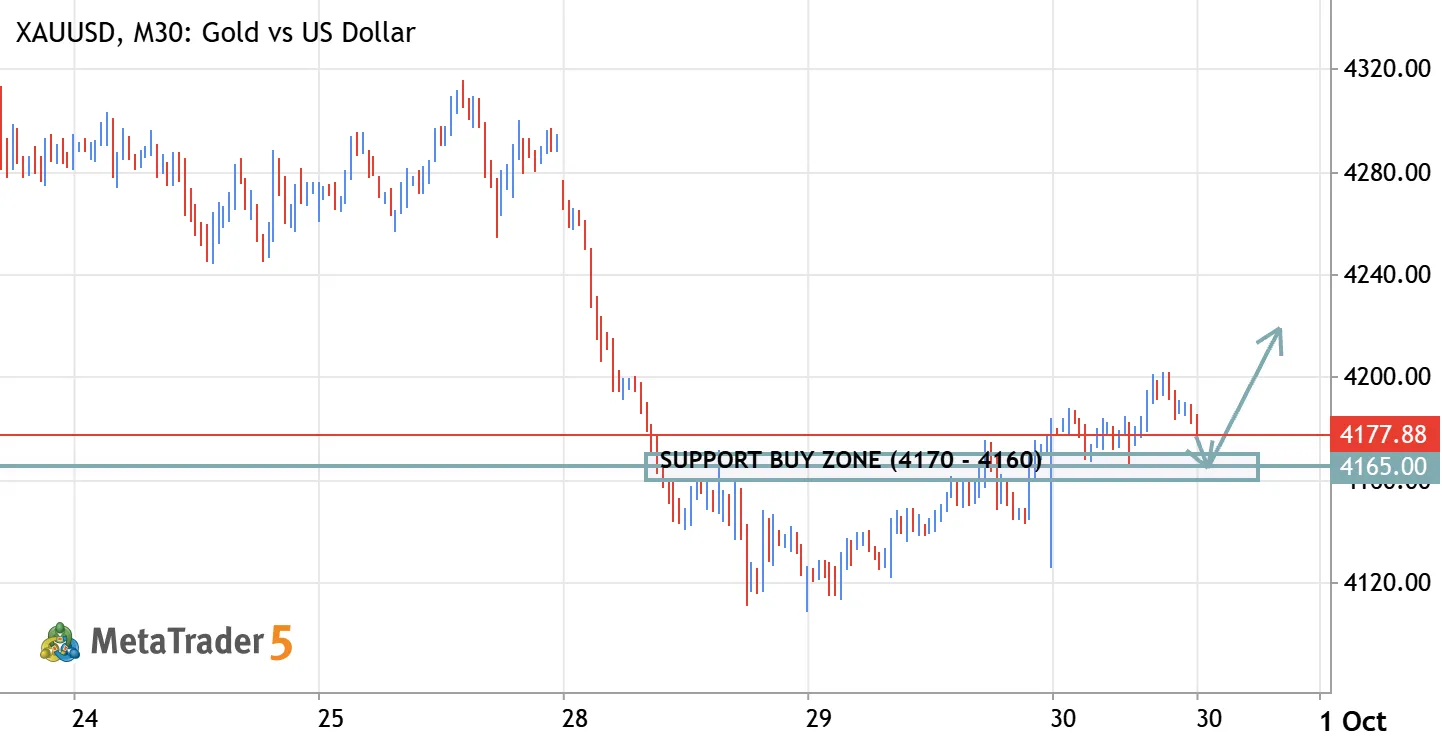
🟢 XAU/USD Buy Limit Signal Buy Zone: 4170 – 4160 Stop Loss: 4140 Take Profit 1: 4180 Take Profit 2: 4200 Take Profit 3: 4220 Open Target: Open 📚 Educational Market Idea: Gold is approaching the 4170–4160 area, which is being watched as a potential support zone. A Buy Limit is planned in this area, anticipating a bullish reaction if price holds the zone. For confirmation, watch for bullish price action around the entry area, such as a strong bullish candle, bullish engulfing pattern, or a clear recovery above nearby resistance. If the support holds, price could move toward 4180, followed by 4200 and 4220. 📌 Trade Management: Consider taking partial profit at TP1 and TP2. Once TP1 is reached and price shows continued strength, consider protecting the position by moving SL toward
🟡 XAUUSD – Gold M15 Analysis XAUUSD Short Gold vs US Dollar

🟡 XAUUSD – Gold M15 Analysis

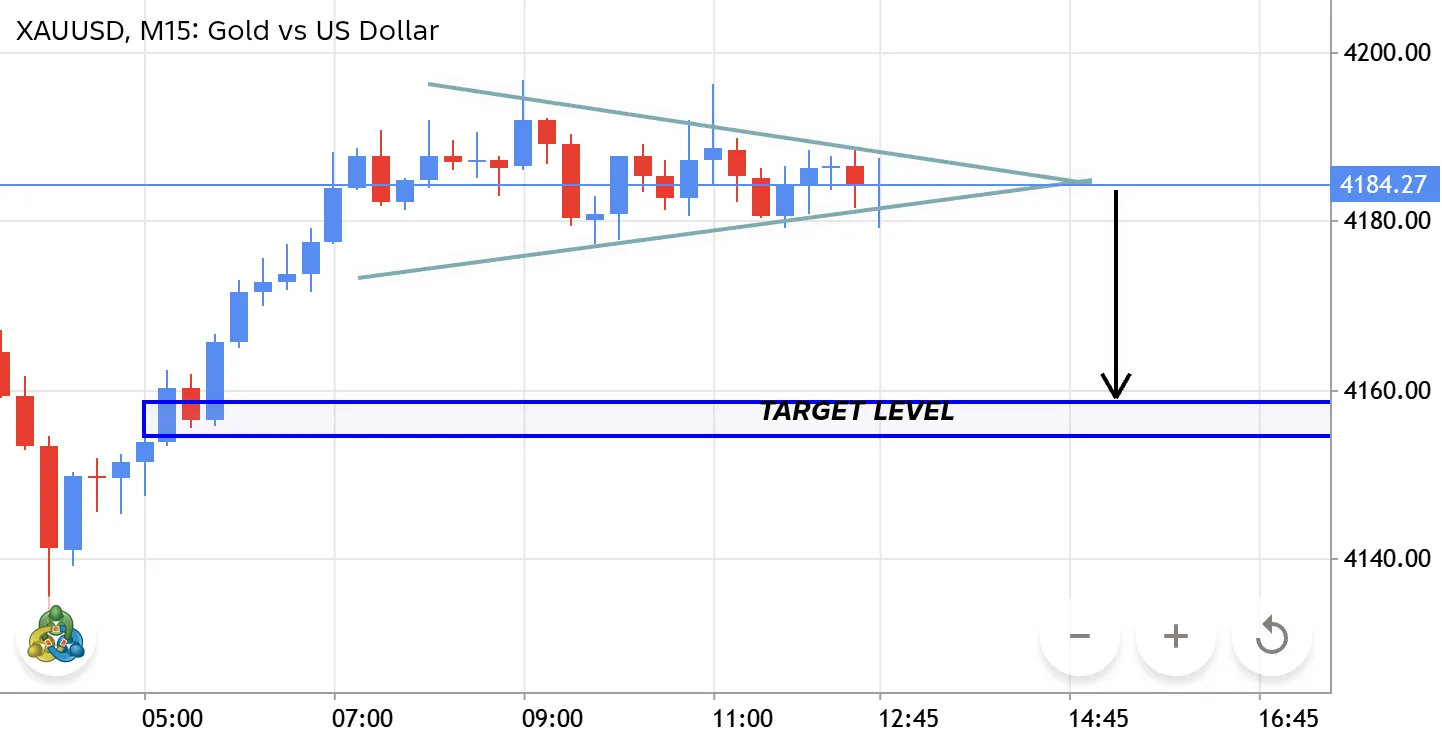
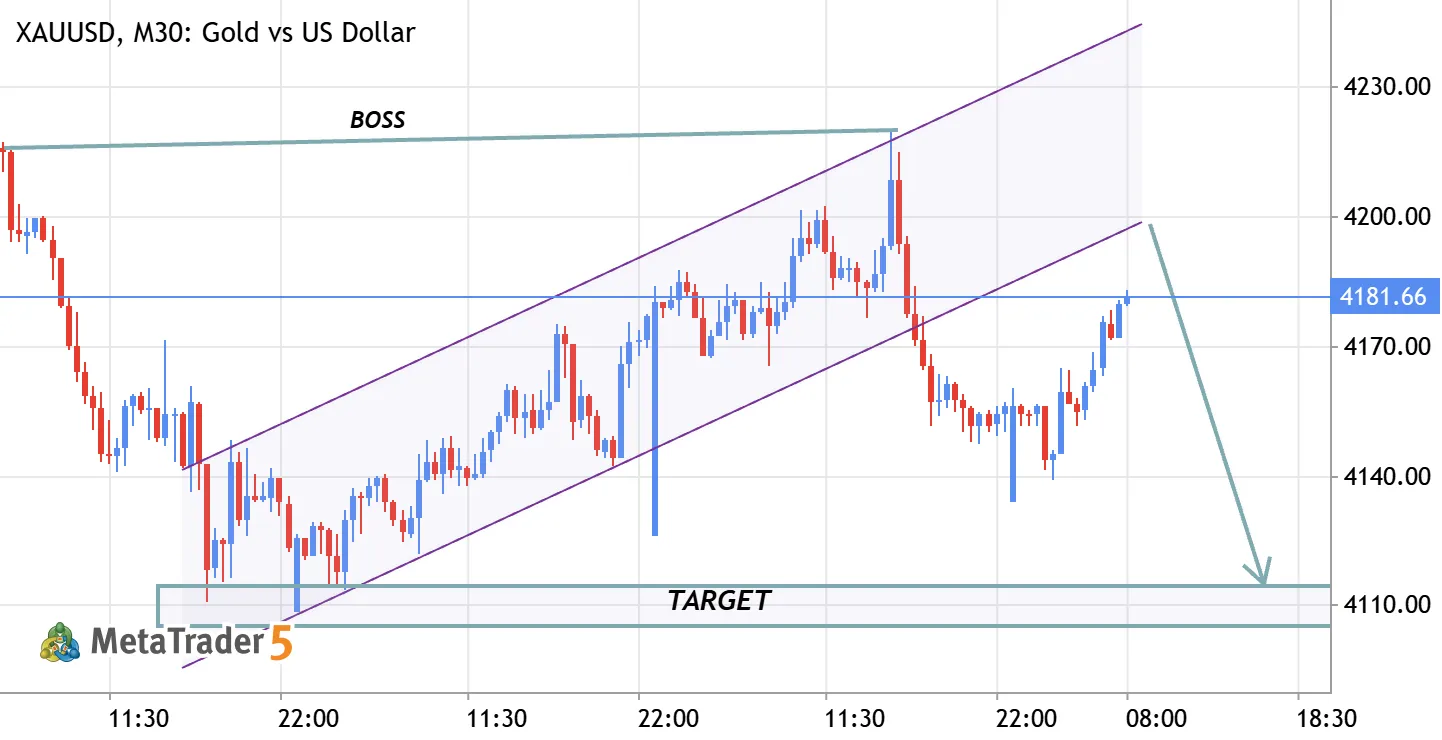
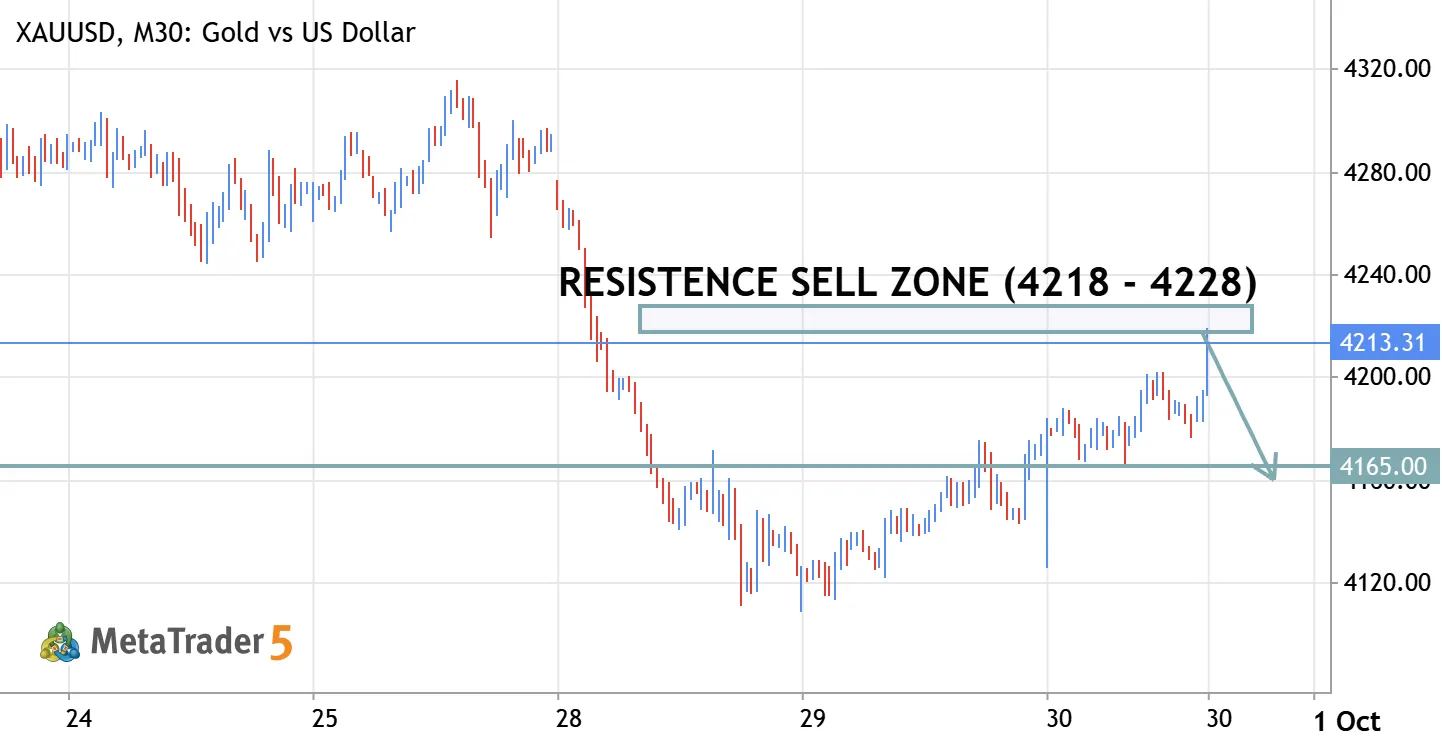
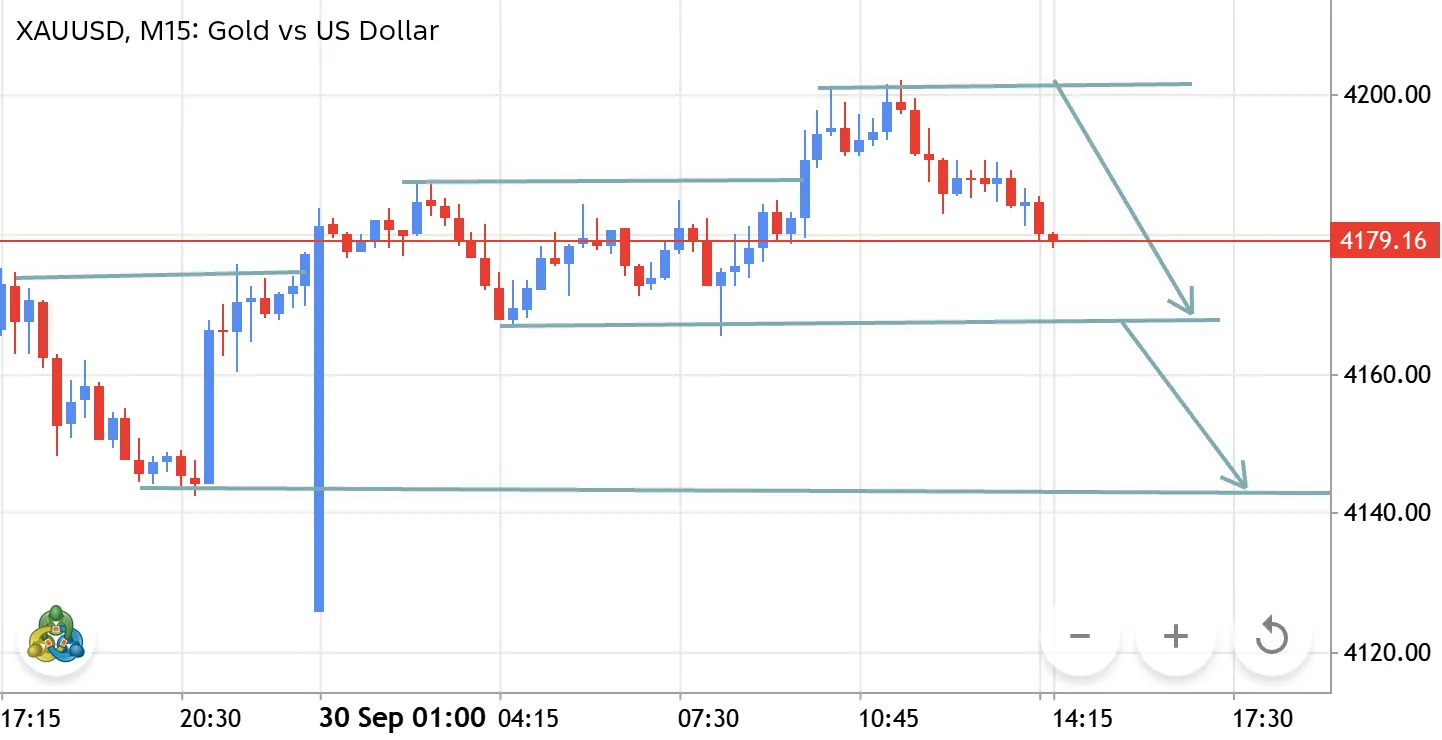
Gold is showing a bearish rejection from the 4200–4210 resistance zone. Price has started forming lower highs on the M15 chart, indicating increasing selling pressure. 🔻 Bearish Scenario: A confirmed break and close below 4168–4170 could open the way toward 4142–4145 support. 📌 Resistance: 4200–4210 📌 Support 1: 4168–4170 📌 Support 2: 4142–4145 Trade Idea: SELL below 4168 after confirmation TP1: 4160 TP2: 4145 SL: Above 4205