US30 — Inverse Head & Shoulders Building Inside the Triangle 30 US30 Long US Wall Street 30 Index

US30 — Inverse Head & Shoulders Building Inside the Triangle

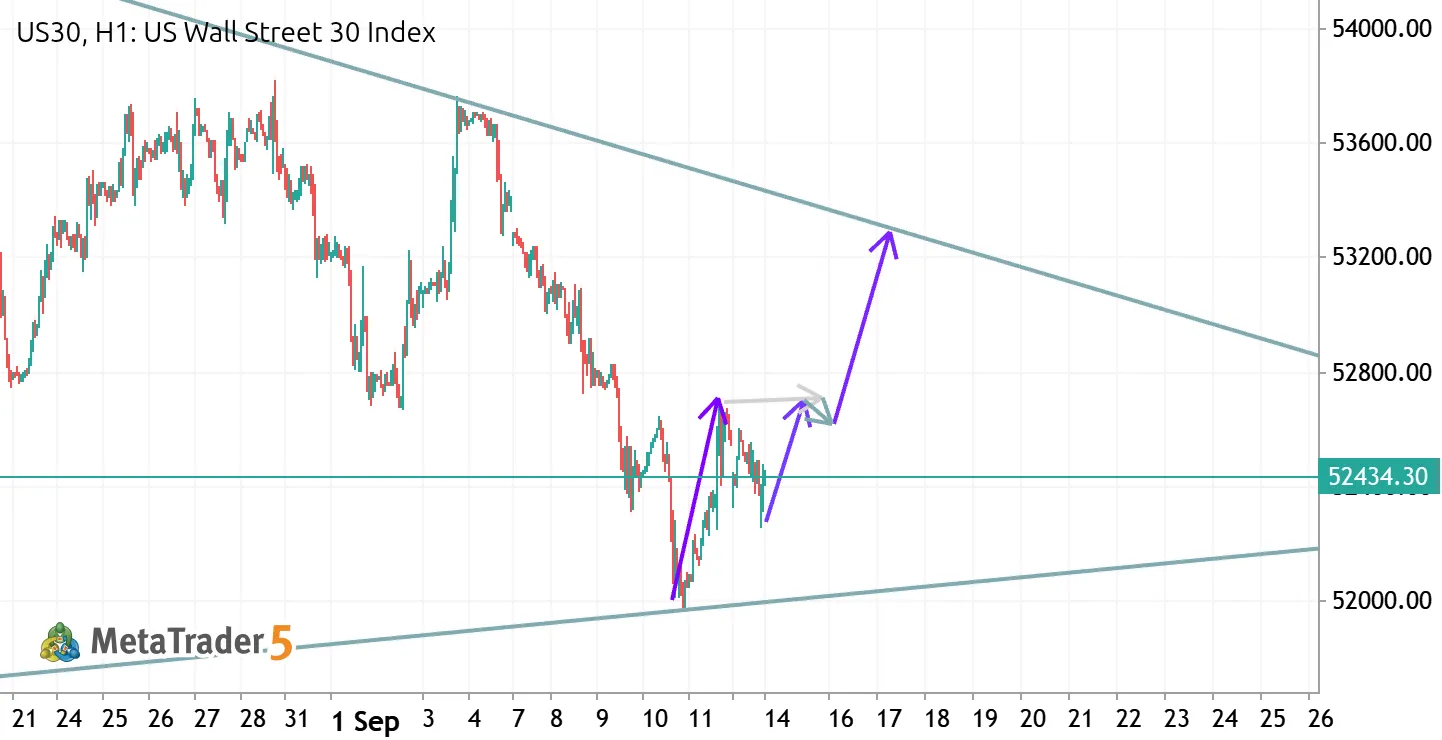
US30 has spent six weeks compressing between the descending resistance off the 5 August high and the rising support that's been in place since late July. Price is now deep into that contraction, and the way the last leg down resolved is what makes this interesting. Instead of breaking the rising trendline, the market carved out a small inverse head and shoulders right on top of it: left shoulder around 52,150, the head at 51,950 where support was tested and rejected on 10 September, and a higher right shoulder near 52,300. That's a textbook sequence of a seller exhaustion — each attempt lower found buyers earlier than the last. The neckline sits around 52,750. A clean H1 close above it opens the measured move toward 53,500, which lines up neatly with the descending trendline in the

US30 Technical Analysis & Strategy Guide 30 US30 Long US Wall Street 30 Index

US30 Technical Analysis & Strategy Guide

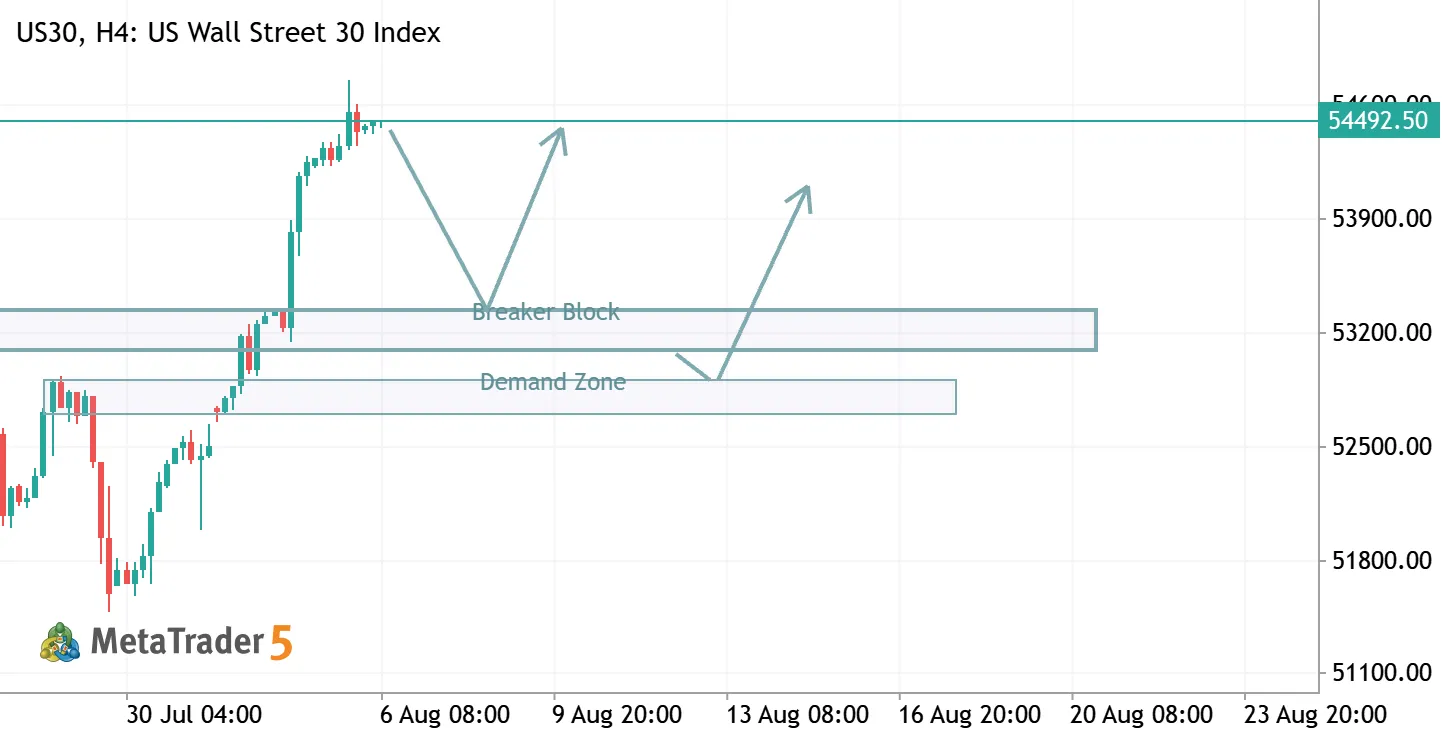
🚨 DISCLAIMER Not Financial Advice: This analysis is strictly for educational and informational purposes only. Forex, indices, and financial market trading carry a high level of risk. Always conduct your own research and apply strict risk management before opening any positions. 📊 Market Structure & Context Trading Pair / Instrument: US30 / Dow Jones Industrial Average (Wall Street 30 Index) Timeframe: H4 (4-Hour) Dominant Trend: Strong Bullish Expansion / Upward Momentum Current Key Resistance Level: ~54,493.00 The US30 chart demonstrates an aggressive, vertical bullish expansion. However, entering long positions at the absolute top (54,493) presents an unfavorable Risk-to-Reward ratio. Smart Money Concepts (SMC) favor waiting for liquidity retracements back into institutional
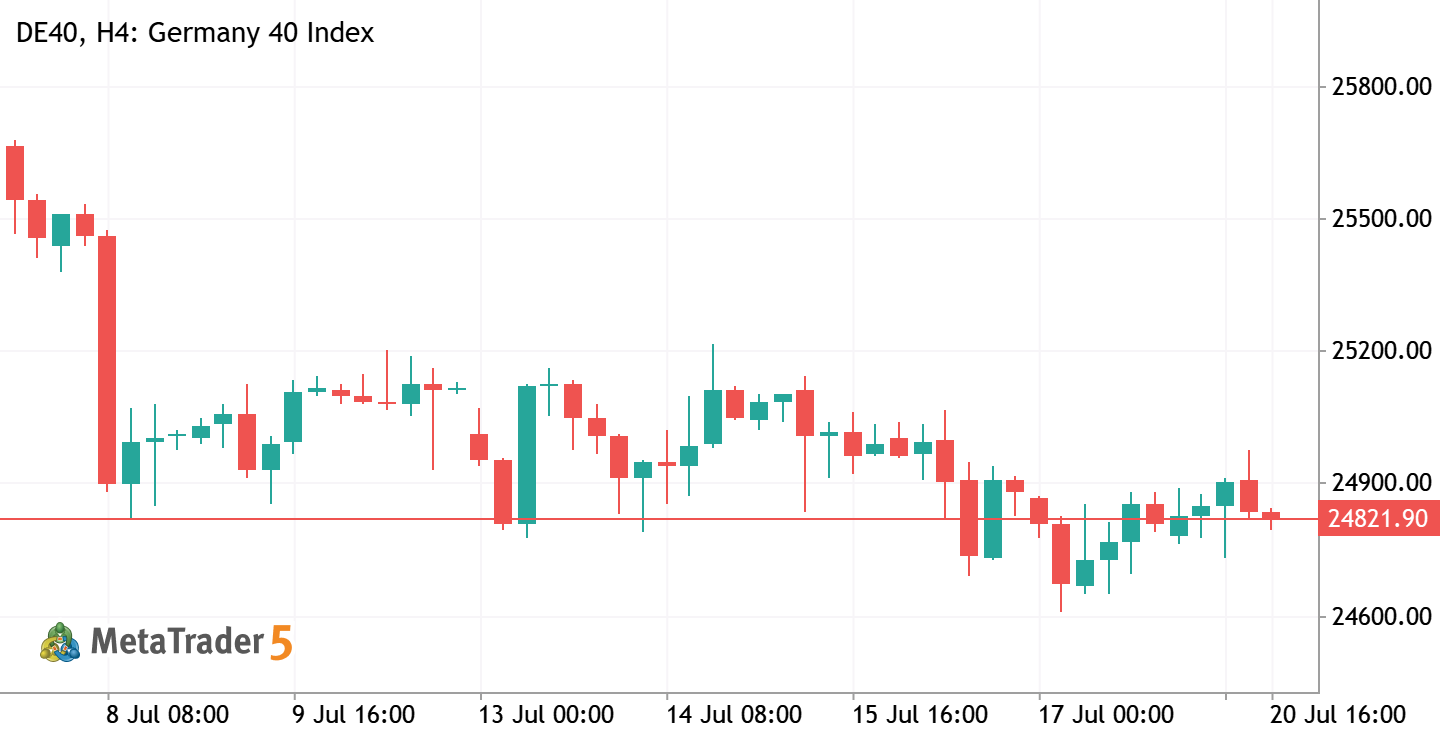
DAX — week of July 20 – 24, 2026; SHORT 40 DE40 Short Germany 40 Index

DAX — week of July 20 – 24, 2026; SHORT

DAX — week of July 20 – 24, 2026 SHORT Two weeks ago the 26,064 'breakout' was a trap I called; last week the tape fade-and-flushed to 24,715 , exactly where I mapped it. Now it's coiled on the one number that matters, and almost nobody prints it: the weekly EMA ( 24,996 ), the weekly pivot ( 24,997 ), the 4H EMA ( 24,999 ) and the week's VWAP ( 24,950 ) are stacked inside a fifty-point knot at 24,950–25,000 . Price is sitting one tick above the whole cluster, bouncing a limp +0.3% off Friday's 24,715 low. That knot is the hinge — not the obvious 26,000 top, not the round 25,000 the tourists circle. Above it sits a tight ceiling: R1 at 25,279 tucked under last week's 25,343 high, a 64-point band where every bull trapped at 26,000 waits to average down. I'm a seller into 25,279–25,343 for
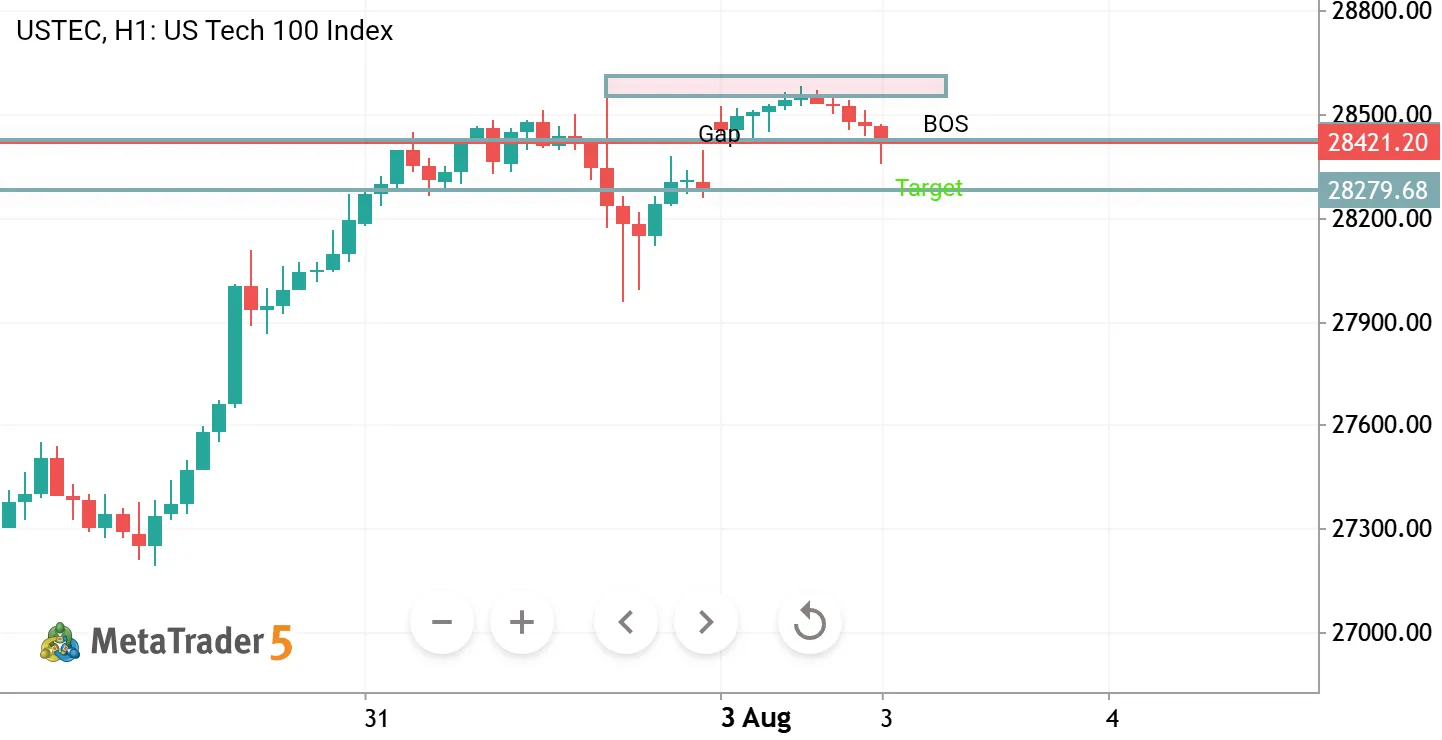
US100 – Potential Buy Opportunity After Liquidity Expansion TEC USTEC Long US Tech 100 Index

US100 – Potential Buy Opportunity After Liquidity Expansion

Market Context: The price action on US100 shows a strong bullish expansion followed by a corrective move into a key consolidation and high-volume area. After sweeping liquidity below the previous structure and reclaiming the range, price is now approaching a critical support zone aligned with volume accumulation. Key Observation: Liquidity sweep below previous lows Strong bullish impulse move upwards Pullback into high-volume consolidation area (value zone) Reaction expected around institutional buying interest level Trade Idea: I am expecting a potential continuation to the upside after a retracement into the highlighted buy zone. This area aligns with previous volume consolidation, making it a high-probability reaction zone. Scenario: Price may first retest the upper resistance area