🟡 XAUUSD – Gold M15 Analysis XAUUSD Short Gold vs US Dollar

🟡 XAUUSD – Gold M15 Analysis

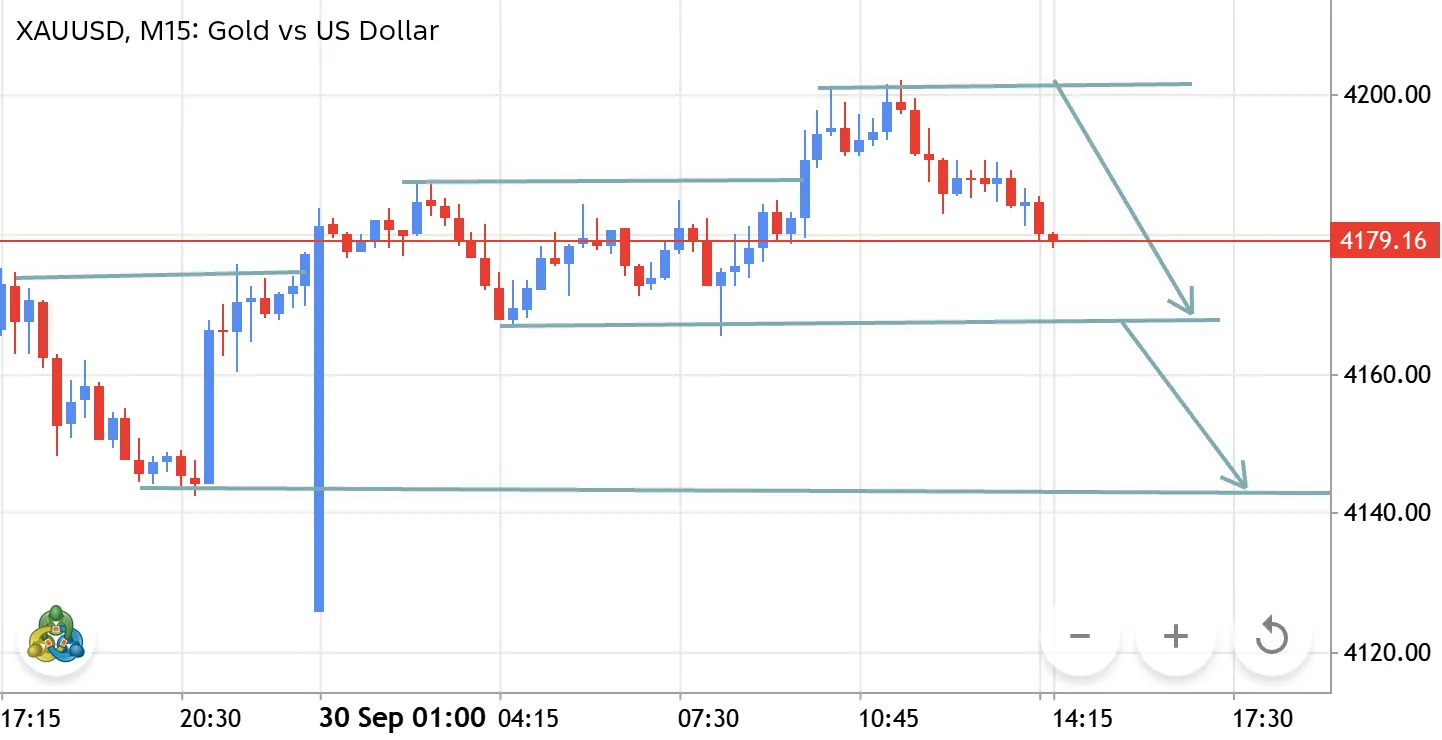
Gold is showing a bearish rejection from the 4200–4210 resistance zone. Price has started forming lower highs on the M15 chart, indicating increasing selling pressure. 🔻 Bearish Scenario: A confirmed break and close below 4168–4170 could open the way toward 4142–4145 support. 📌 Resistance: 4200–4210 📌 Support 1: 4168–4170 📌 Support 2: 4142–4145 Trade Idea: SELL below 4168 after confirmation TP1: 4160 TP2: 4145 SL: Above 4205
XAUUSD H4 ANALYSIS XAUUSD Gold vs US Dollar

XAUUSD H4 ANALYSIS

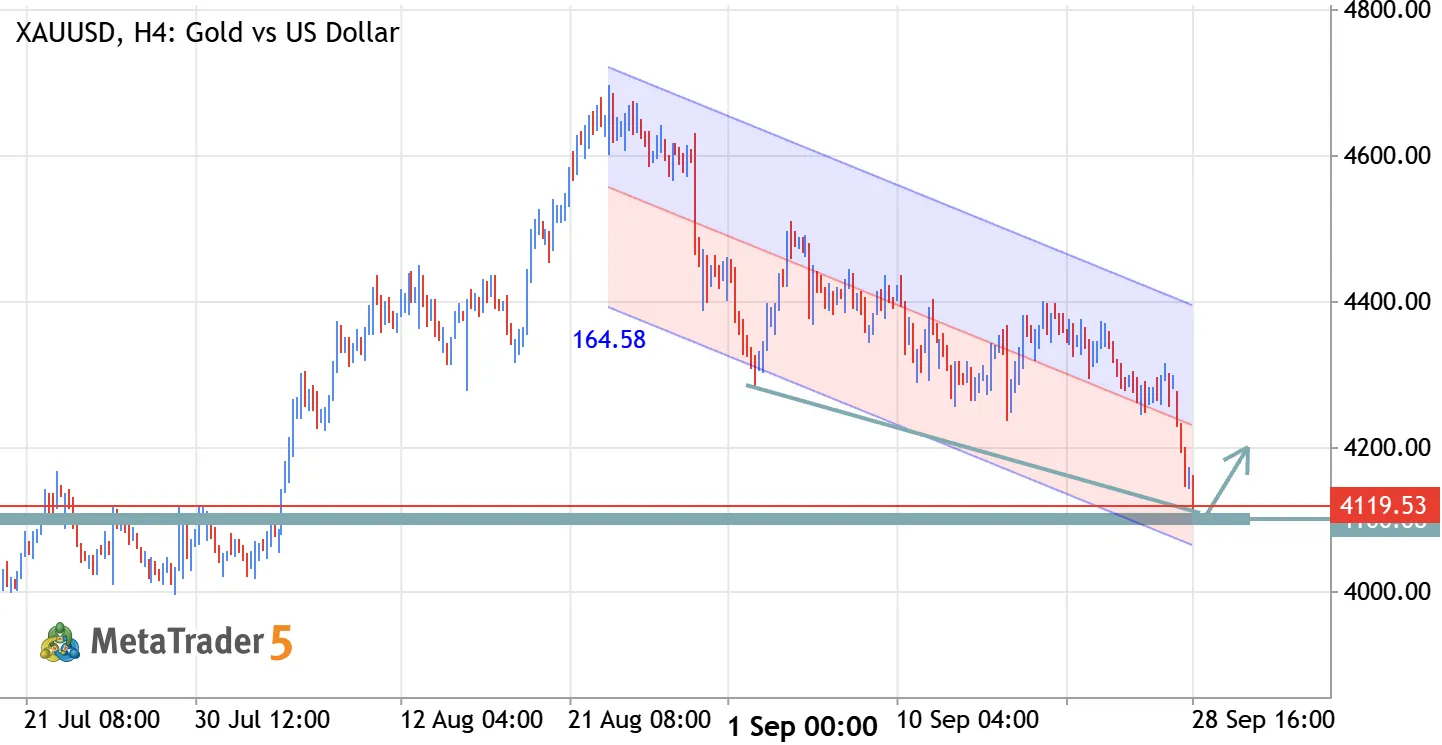
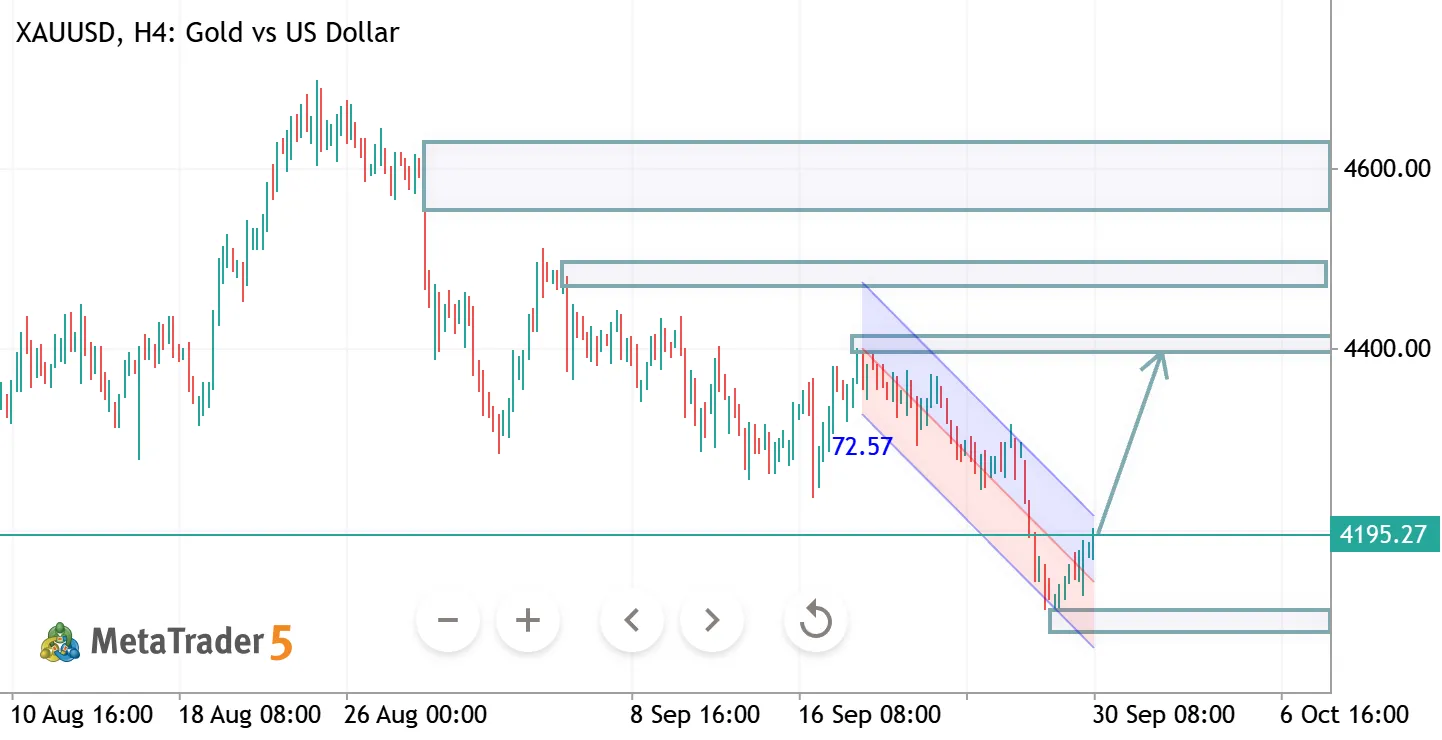
XAUUSD H4 Analysis Gold is trading near 4196 after bouncing from the 4100 support zone. Price remains inside a descending channel, but a bullish recovery is developing. Key levels: Support: 4100–4120 Resistance: 4300 → 4400 Bullish trigger: Sustained move above 4200–4250 A confirmed breakout above the channel could open the way toward 4300 and 4400. Failure to hold 4100 would invalidate the bullish setup and expose lower levels. Bias: Neutral-to-Bullish above 4100. Trade with proper risk management; this is technical analysis, not financial advice.
XAUUSD H1 ANALYSIS XAUUSD Gold vs US Dollar

XAUUSD H1 ANALYSIS

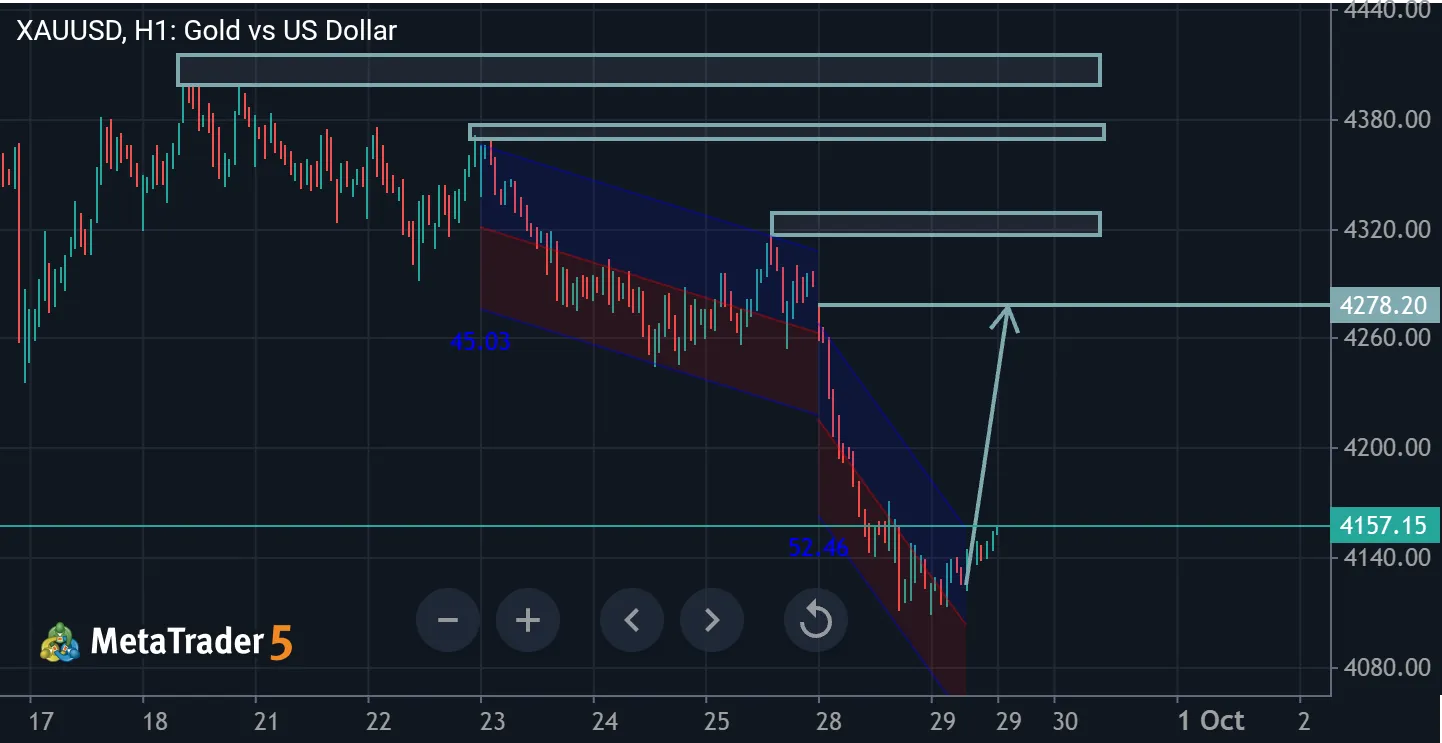
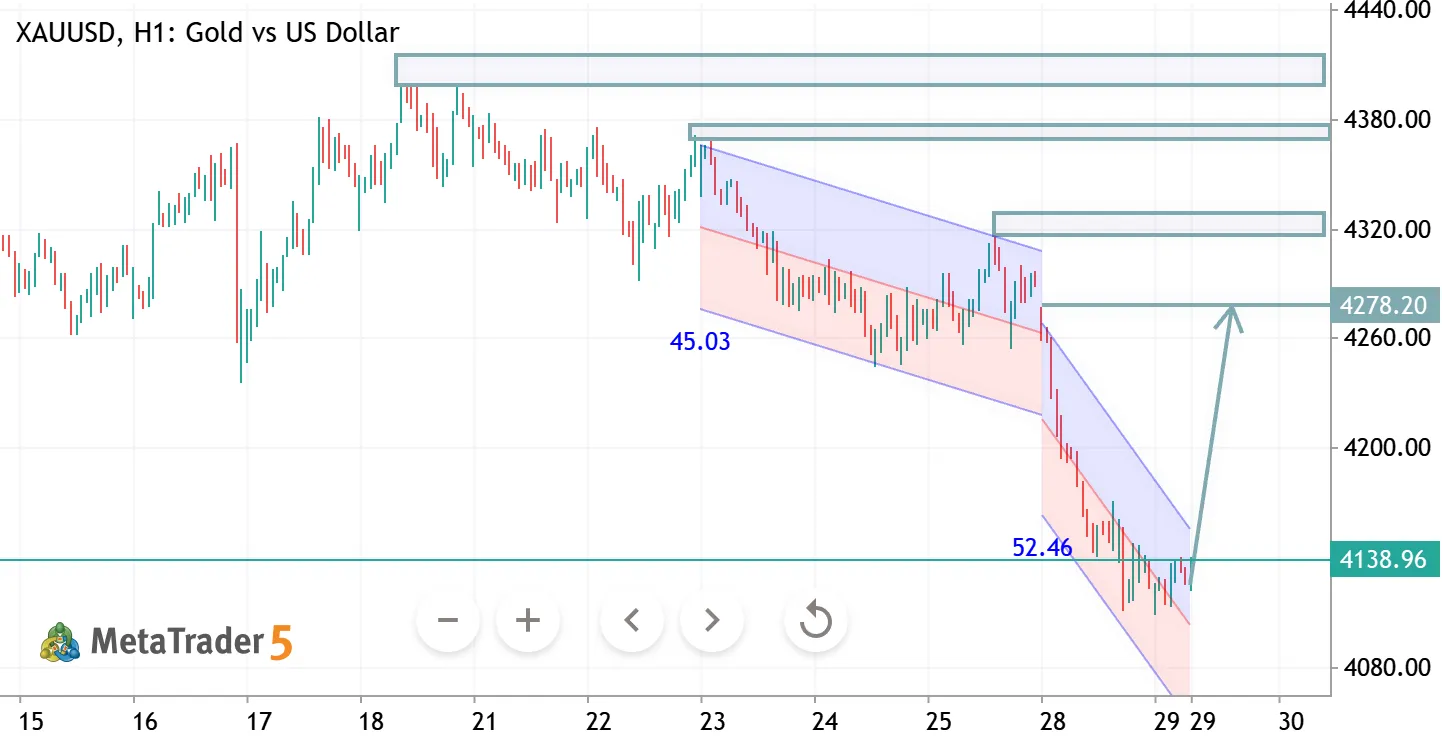
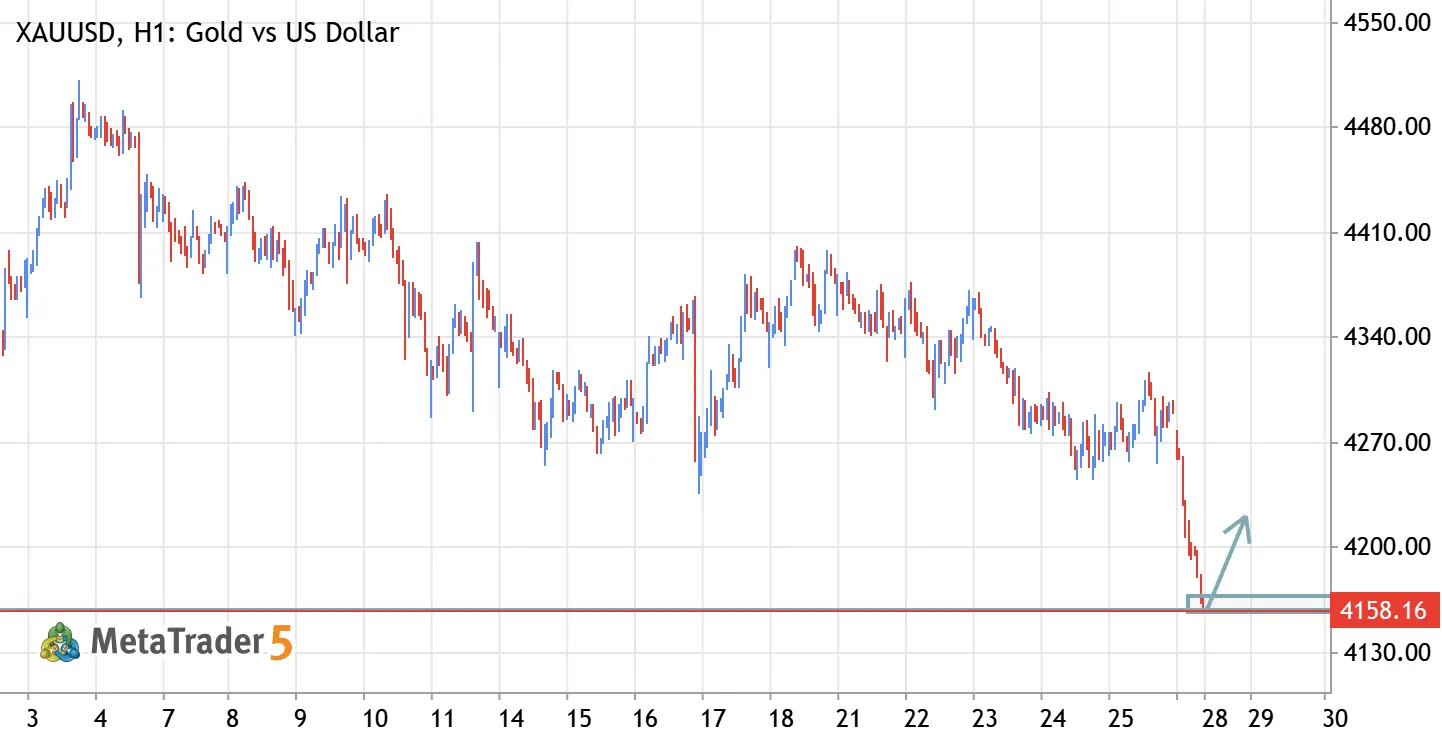
XAUUSD H4 Analysis 📊 Gold is trading near 4138 support after a sharp bearish move. Price is forming a potential reversal from the lower channel boundary. 🔺 A confirmed breakout above the descending trendline could open the way toward 4250–4300. 🔻 A break below 4100–4130 would keep bearish pressure active. Key levels: Support 4100–4130 | Resistance 4250–4300 Wait for confirmation and manage risk carefully.
XAUUSD: Buying Support Zone | Targeting Upward Gap Fill at 0.618 Fib XAUUSD Long Gold vs US Dollar

XAUUSD: Buying Support Zone | Targeting Upward Gap Fill at 0.618 Fib

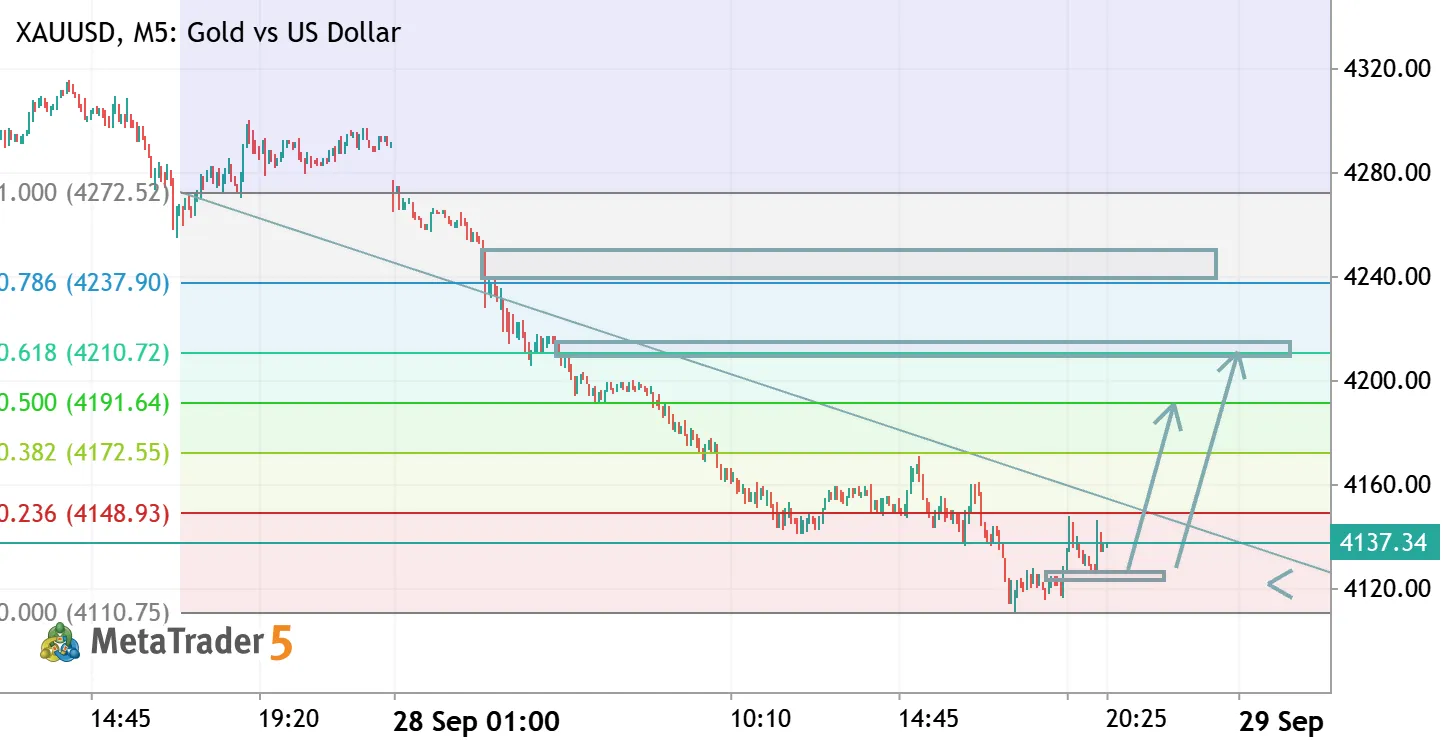
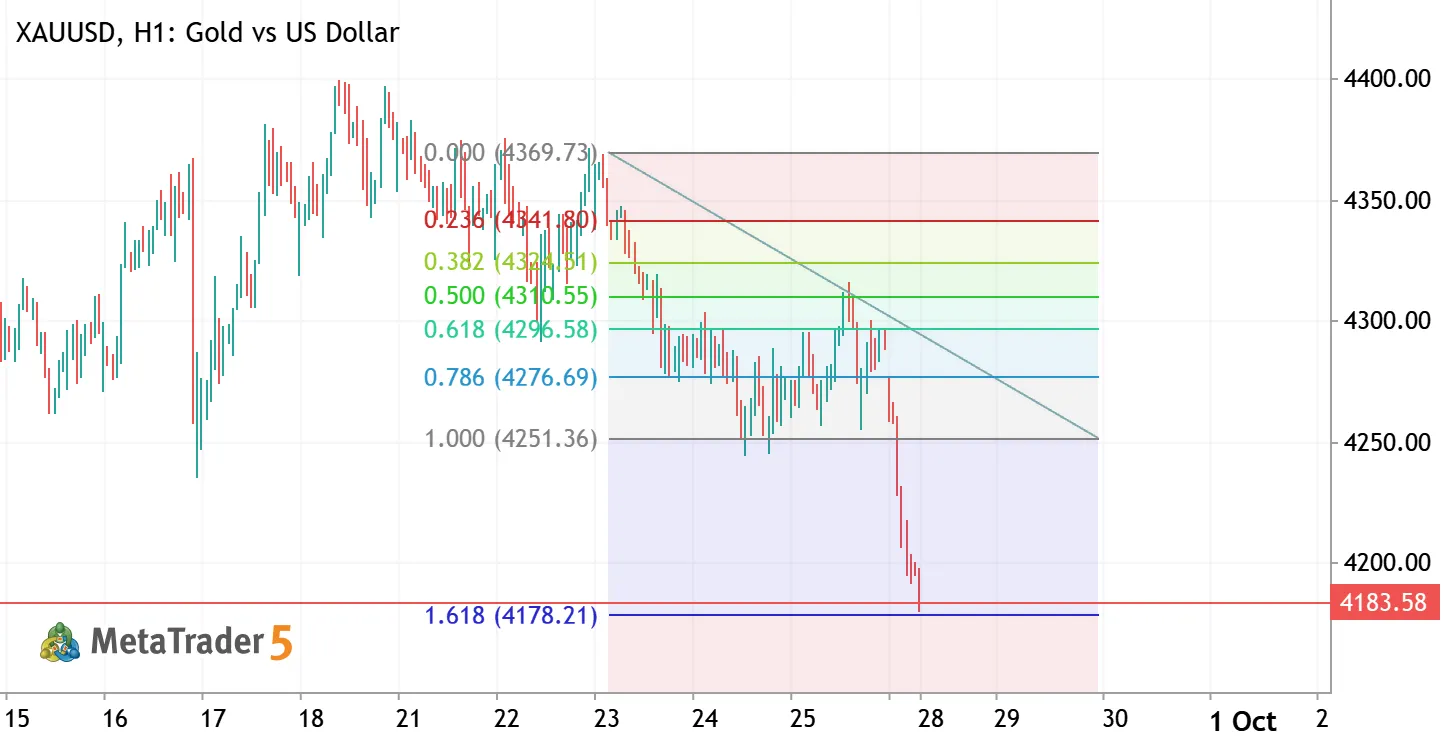
XAUUSD has completed a pullback following a downward move and is currently forming a base around the 4120.00 support zone. Key Technical Levels & Setup: Support / Entry Zone: Strong support holding at 4120.00 - 4130.00 . Fibonacci Targets: TP 1: 0.382 Fib (~ 4172.50 ) TP 2: 0.500 Fib (~ 4191.60 ) TP 3 / Primary Target: 0.618 Fib (~ 4210.70 ) to fill the liquidity gap. Stop Loss: Below key support at 4110.00 . Outlook: Looking for a bullish continuation off the 4120 demand level to fill the fair value gap above, targeting the 0.618 Fibonacci level (~4210.70) . Monitor price action around 4148 (0.236 Fib) for initial confirmation of bullish momentum.
XAUUSD (Gold) – 4100 Support Reaction Buy Setup XAUUSD Long Gold vs US Dollar

XAUUSD (Gold) – 4100 Support Reaction Buy Setup

🟢 XAU/USD Buy Signal Buy Zone: 4105 – 4095 Stop Loss: 4080 Take Profit 1: 4120 Take Profit 2: 4150 Take Profit 3: 4180 Open Target: Open 📚 Educational Market Idea: Gold is currently around 4120, with price action moving lower toward the 4105–4095 area. This zone may act as a potential support area where buyers could react after the bearish move. The setup is based on a reaction from the 4105–4095 zone. For safer execution, wait for bullish confirmation such as a strong bullish candle, bullish engulfing pattern, or a clear break back above nearby resistance before entering. 📌 Trade Management: Consider securing partial profits at TP1 and TP2. After TP1 is reached, traders may consider protecting the position by moving SL toward breakeven, depending on price action. Allow the remaining
XAUUSD (Gold) – Liquidity Sweep Buy Setup XAUUSD Long Gold vs US Dollar

XAUUSD (Gold) – Liquidity Sweep Buy Setup

🟢 XAU/USD Buy Signal Buy Zone: 4160 Stop Loss: 4140 Take Profit 1: 4180 Take Profit 2: 4200 Take Profit 3: 4220 Open Target: Open 📚 Educational Market Idea: After the liquidity sweep, Gold is approaching the 4160 buy zone for a potential bullish reaction. A liquidity sweep can occur when price briefly moves below a previous low, takes available liquidity, and then starts recovering. Traders should wait for bullish price-action confirmation inside or around the buy zone before entering. If buyers defend this area and bullish momentum develops, Gold could move toward 4180 first, followed by 4200 and 4220. If the bullish structure remains intact, the remaining position can be managed toward the Open target. This setup can be monitored for both swing and intraday trading. 📌 Trade
XAUUSD M30 - Supporst and resistance structure XAUUSD Long Gold vs US Dollar

XAUUSD M30 - Supporst and resistance structure

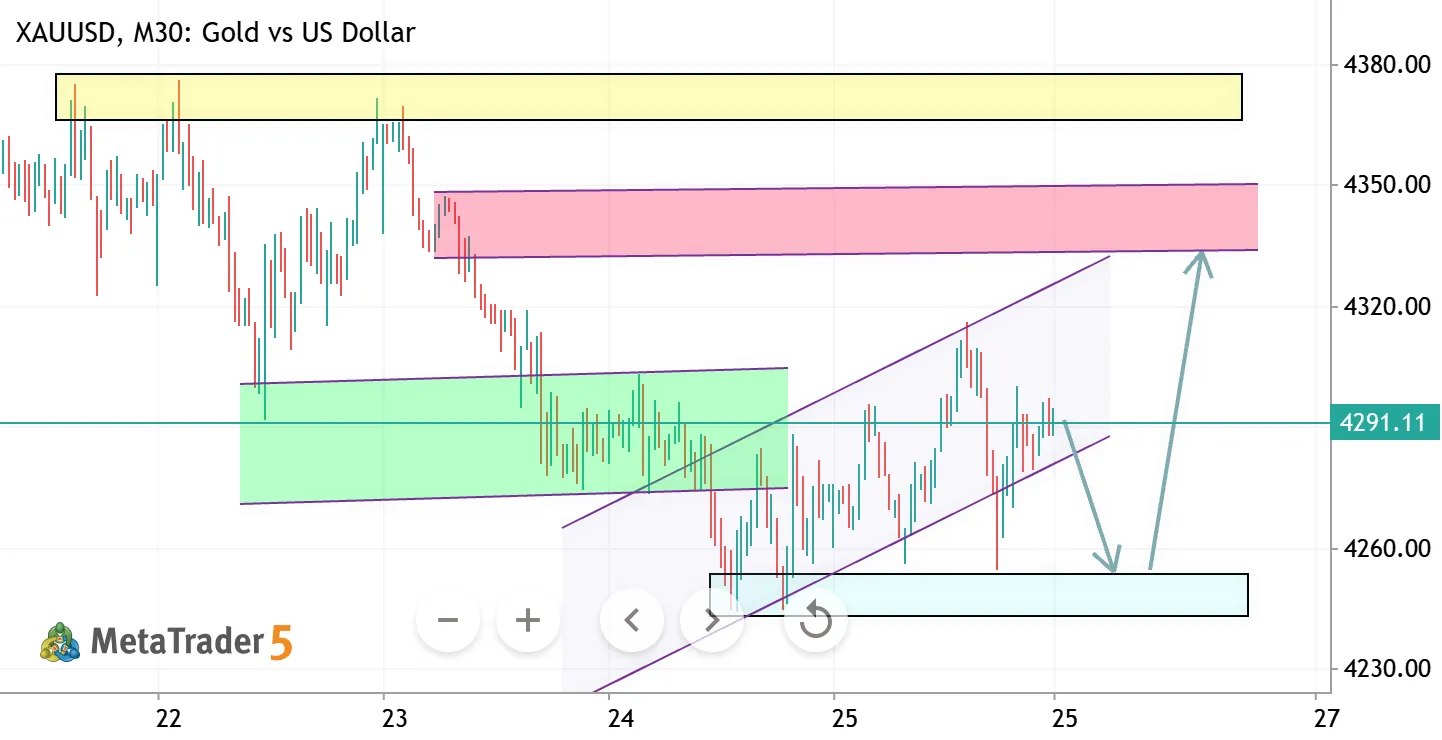
Gold is currently trading around 4291 on the M30 chart. Price is consolidating between the 4250–4260 support zone and the 4335–4355 resistance area. A rejection from the current region could lead to a retest of 4250–4260 support. If support holds and bullish momentum develops, price may attempt a move toward 4335–4355. A sustained breakout above resistance could open the way toward the 4365–4380 zone. Key Levels: • Support: 4250–4260 • Near-term zone: 4280–4305 • Resistance: 4335–4355 • Higher resistance: 4365–4380 Educational market analysis only. Price can move in either direction; always use proper risk management.
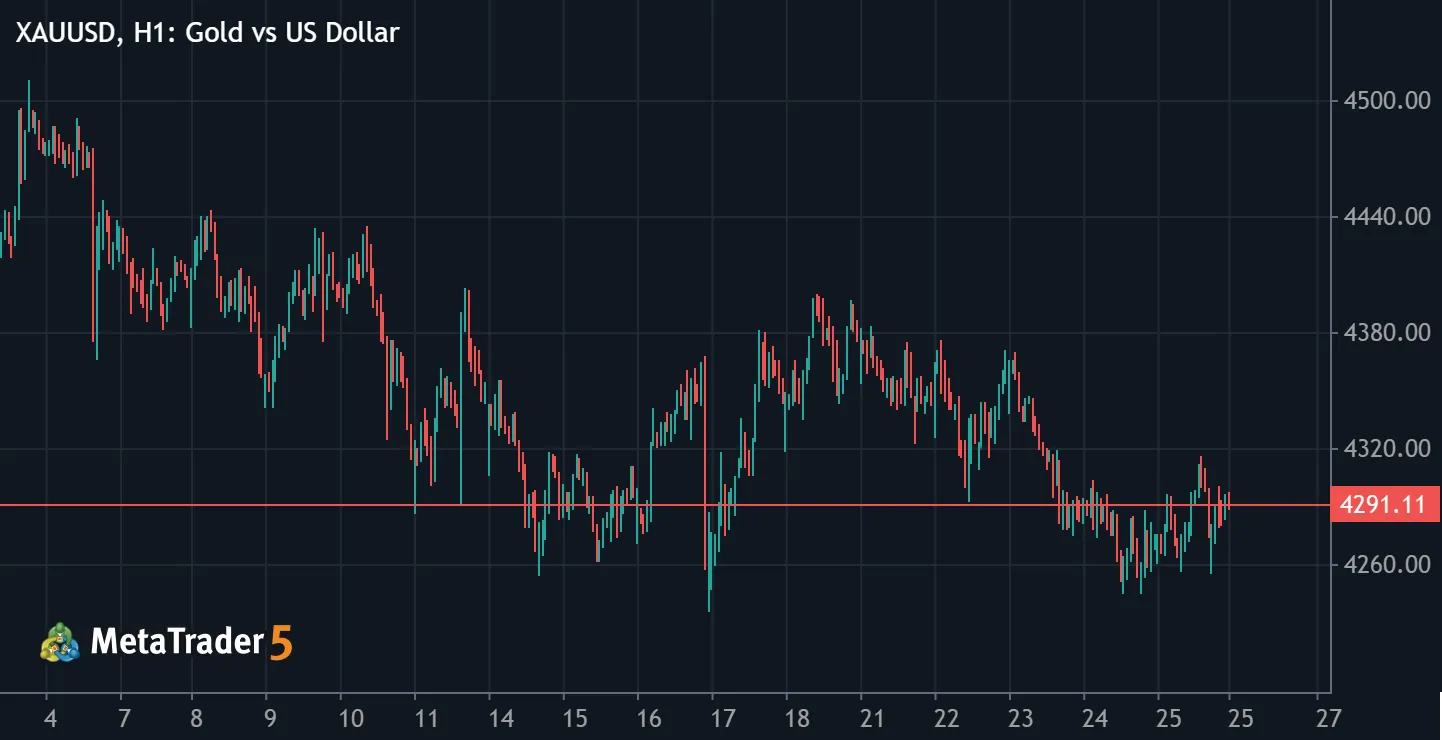
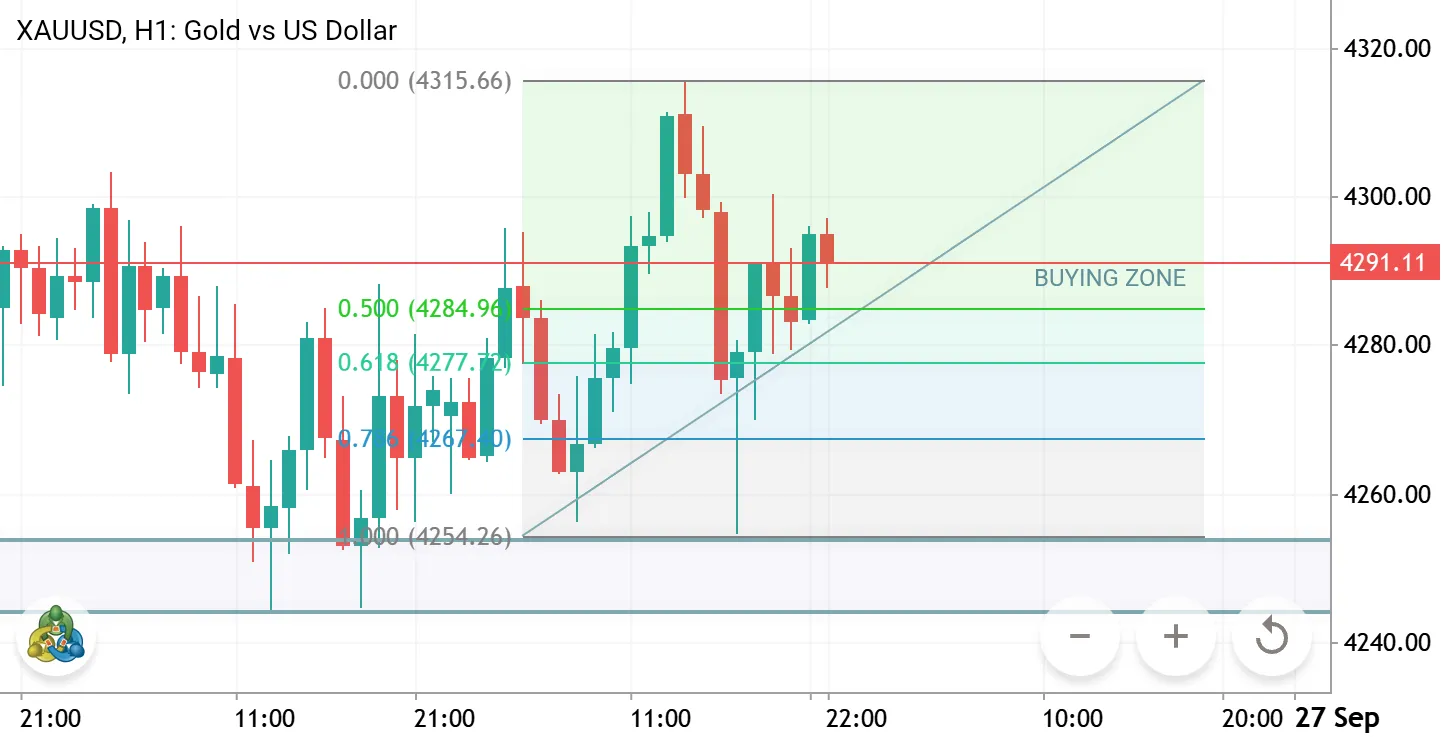
📊 XAUUSD (Gold) 1-Hour Chart Analysis • Current Price: 4291.11 • Trend: Market is testing the Buying Zone. • Strategy: Looking for a potential bounce from this level. Watch the price action closely for an entry! XAUUSD Long Gold vs US Dollar

📊 XAUUSD (Gold) 1-Hour Chart Analysis • Current Price: 4291.11 • Trend: Market is testing the Buying Zone. • Strategy: Looking for a potential bounce from this level. Watch the price action closely for an entry!

📈 XAUUSD (GOLD) 1-HOUR CHART ANALYSIS 📈 🔹 Market Overview: The price is currently consolidating on the H1 timeframe, trading right around 4291.11 . It is highly compressed and testing a vital structural zone. [1, 2] 🔹 Key Technical Levels: Immediate Resistance: 4315.85 (Recent High / 0.00 Fibonacci Level) Current Zone: 4285.09 - 4291.11 ( BUYING ZONE ) Major Support: 4244.33 (Strong Floor / 1.000 Fibonacci Level) [1, 2] 🔹 Trading Strategy & Evidences: Price is reacting closely within the highlighted green Buying Zone . A clear ascending trendline is supporting the price action from below. Bias: Bullish continuity is expected as long as the market actively holds above the Fibonacci retracement levels. Look for structural confirmation on lower timeframes (like M5 or M15) before
XAUUSD H1 — Wyckoff Accumulation XAUUSD Long Gold vs US Dollar

XAUUSD H1 — Wyckoff Accumulation

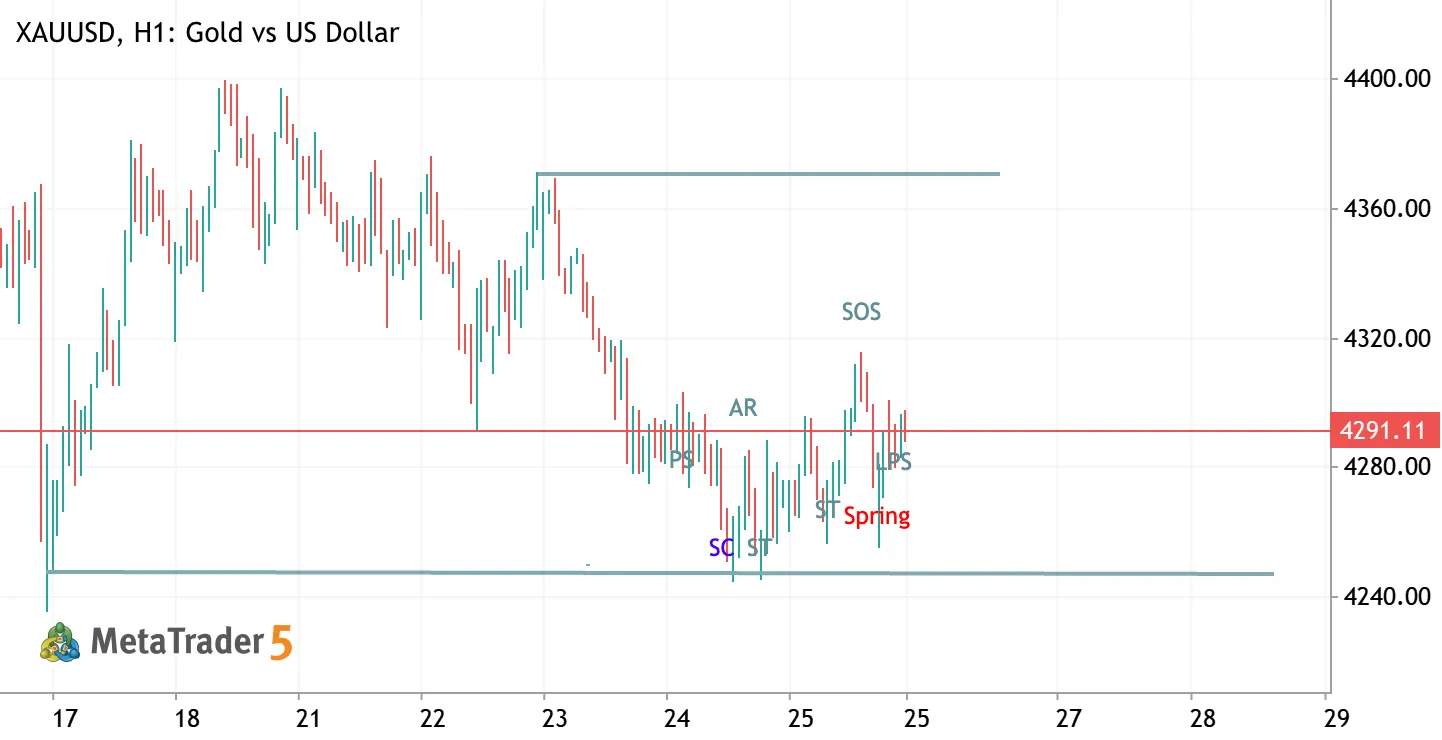
XAUUSD H1 is currently showing a potential Wyckoff Accumulation structure. Price has reacted strongly from the lower range after the Spring/ST area and is now showing early signs of strength. If the accumulation range remains valid and support continues to hold, the next potential phase is Markup , which could create a bullish continuation into next week. Investment flow also appears supportive of the bullish scenario. My current bias remains Long , but confirmation is still needed through sustained strength above the accumulation range and continued demand after the SOS. Accumulation → SOS → Markup